. 2024 Dec 28;14(1):31233.
doi: 10.1038/s41598-024-82488-3.

Salivary extracellular vesicles isolation methods impact the robustness of downstream biomarkers detection

Affiliations

Salivary extracellular vesicles isolation methods impact the robustness of downstream biomarkers detection

Jérémy Boulestreau et al. Sci Rep. .

Abstract

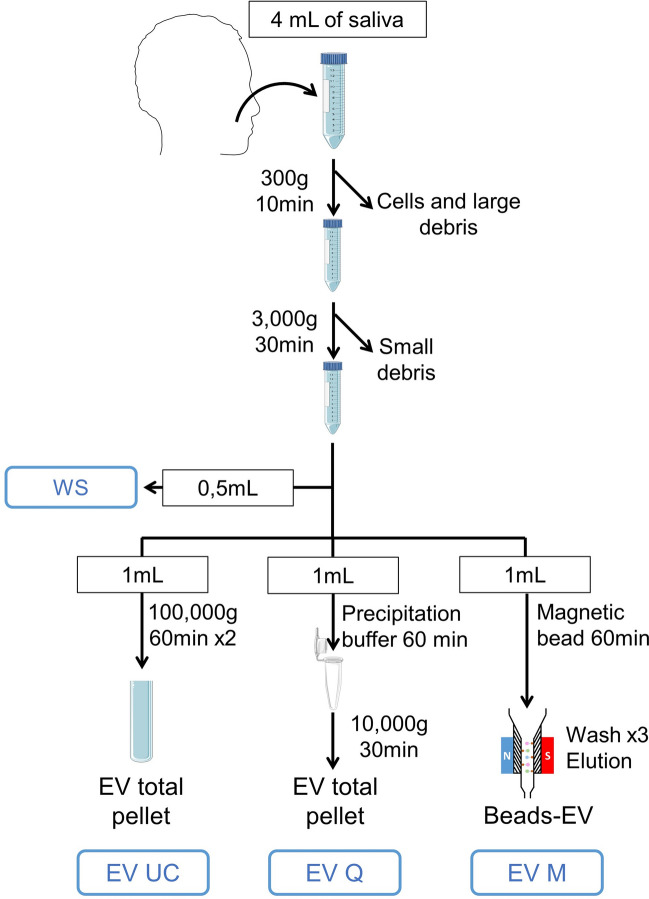
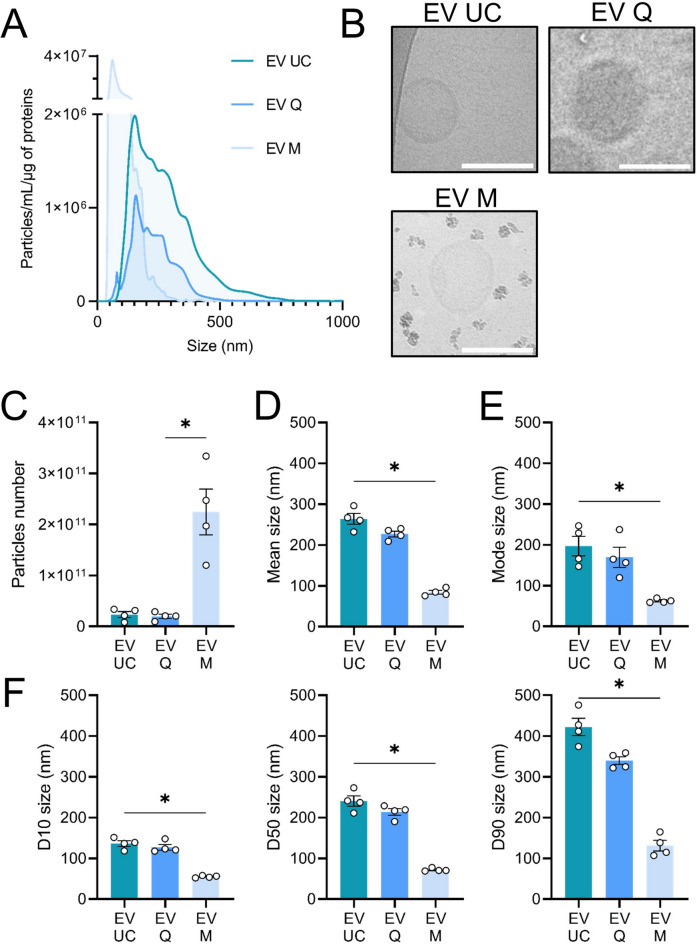
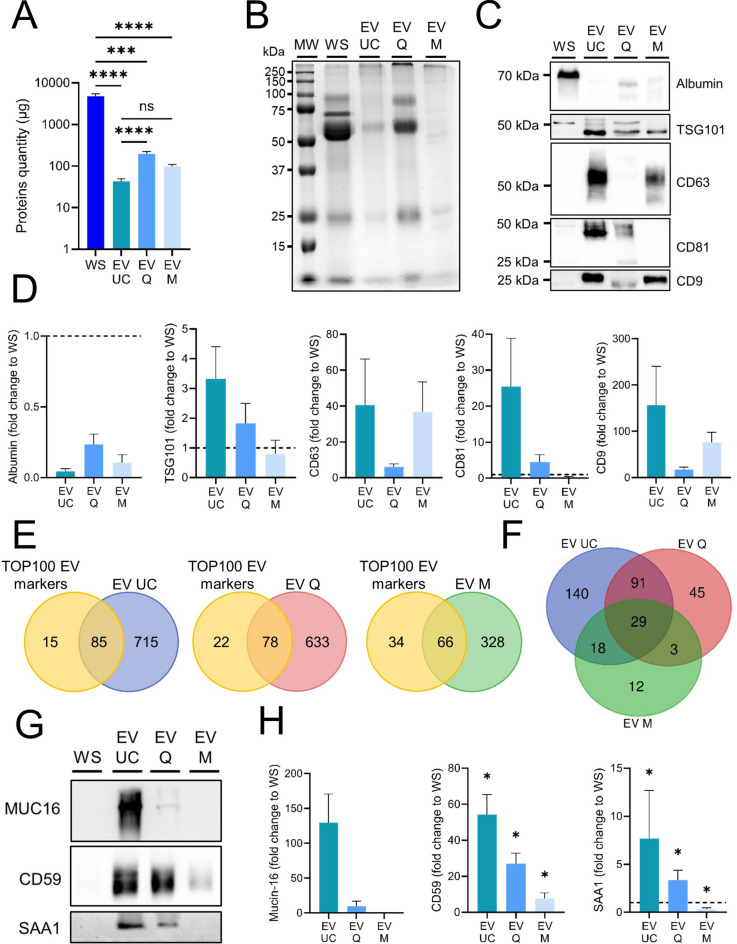
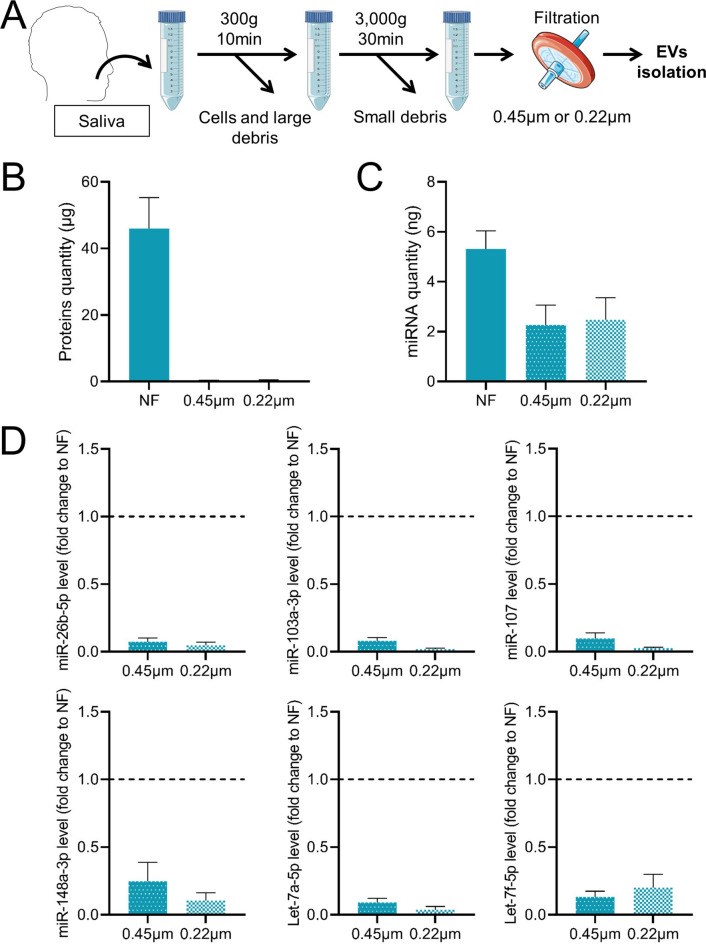
Extracellular vesicles (EVs), crucial mediators in cell-to-cell communication, are implicated in both homeostatic and pathological processes. Their detectability in easily accessible peripheral fluids like saliva positions them as promising candidates for non-invasive biomarker discovery. However, the lack of standardized methods for salivary EVs isolation greatly limits our ability to study them. Therefore, we rigorously compared salivary EVs isolated using two scalable techniques-co-precipitation and immuno-affinity-against the long-established but labor-intensive ultracentrifugation method. Employing Cryo-Electron Microscopy (Cryo-EM), Nanoparticle Tracking Analysis, Western blots (WB), and proteomics, we identified significant method-dependent variances in the size, concentration, and protein content of EVs. Importantly, our study uniquely demonstrates the ability of EV isolation to detect specific biomarkers that remain undetected in whole saliva by WB. RT-qPCR analysis targeting six miRNAs confirmed a consistent enrichment of these miRNAs in EV-derived cargo across all three isolation methods. We also found that pre-filtering saliva samples with 0.22 or 0.45 µm pores adversely affects subsequent analyses. Our findings highlight the untapped potential of salivary EVs in diagnostics and advocate for the co-precipitation method as an efficient, cost-effective, and clinically relevant approach for small-volume saliva samples. This work not only sheds light on a neglected source of EVs but also paves the way for their application in routine clinical diagnostics.


Conflict of interest statement

Declarations. Competing interests: The authors declare no competing interests.

Figures

Fig. 1
Fig. 1
Workflow of human salivary extracellular vesicles isolation. Representative scheme of the workflow. Briefly, 4 mL of saliva were collected from donors and centrifuged successively at 300×g and 3000×g to remove cells and large debris and then small debris respectively. Then, whole saliva supernatant was splited in four fractions: 0.5 mL whole saliva supernatant (WS) used as a control and 1 mL dedicated to each EV isolation methods.
Fig. 2
Fig. 2
Characterization of human salivary extracellular vesicles. (A) Mean size distribution of extracellular vesicles (EV UC, Q and M) assessed by NTA (n = 4). (B) Representative pictures of EVs isolated by ultracentrifugation (EV UC), co-precipitation (EV Q) and by immuno-affinity (EV M) by cryo-transmission electron microscopy. Image bars represent 100 nm. (C) Quantification by NTA of EV particles isolated from 1 mL of human saliva (n = 4). (D) Mean size of EVs derived from saliva (n = 4). (E) Mode size of EVs derived from saliva (n = 4). (F) Particle size distribution D10, D50, and D90 corresponding to the 10% smallest particles, 50% (median), and 10% largest particles within a sample respectively (n = 4). *p < 0.05.
Fig. 3
Fig. 3
Characterization of human salivary extracellular vesicles by protein markers. (A) Total proteins contained in human saliva and salivary EVs (n > 26). (B) Commassie blue staining of total proteins from whole saliva or EV UC, EV Q and EV M. (C) Western blot analysis of salivary markers (albumin, endosomal (TSG101) and tetraspanins (CD9, CD63, CD81)) in EV UC, EV Q and EV M protein extracts. (D) Relative quantification to WS of proteins shown in (C). Results are given as fold-change versus control whole saliva normalized at 1. (n = 4). (E) Venn diagram showing overlap between the ExoCarta Top 100 proteins list (yellow) and the salivary EV proteins in EV UC (blue), EV Q (red) and EV M (green) determined by proteomics. (F) Venn diagram showing the number of EV proteins identified in EV UC (blue), EV Q (red) and EV M (green) not identified in WS determined by proteomics. (G) Western blot analysis of mucin-16, CD59 and serum amyloid A1 biomarkers in EV UC, EV Q and EV M protein extracts. (H) Relative quantification to WS of proteins shown in (G). Results are given as fold-change versus control whole saliva normalized at 1. (n > 5). Original blots in (C, G) are presented in Supplementary Fig. S4.*p < 0.05; **p < 0.01; ***p < 0.001; ****p < 0.0001.
Fig. 4
Fig. 4
MiRNA cargo assessment in human salivary extracellular vesicles. (A) Quantity of total miRNA contained in human saliva and extracellular vesicles (UC, Q and M) (n = 10). (B) Gel-like image of miRNA isolated from whole saliva and EVs, generated from the LabChip® GX system. (C) miRNA levels in EVs (UC, Q and M) relative to whole saliva (WS). Results are given as fold-change of whole saliva normalized at 1. (n > 9). *p < 0.05; **p < 0.01; ***p < 0.001.
Fig. 5
Fig. 5
Impact of filtration on saliva-derived extracellular vesicles isolated by ultracentrifugation. (A) Representative scheme of the workflow. Briefly, saliva collected from donors was centrifuged successively at 300×g and 3000×g to remove cells and large debris and then small debris respectively. Then, whole saliva supernatant was filtered on 0.45 µm or 0.22 µm filter. The filtrate was subsequently used for EVs isolation as described previously. (B) Concentration of total proteins contained in EVs isolated by ultracentrifugation from 1 mL of human non-filtered saliva (NF) and 0.45 µm or 0.22 µm filtered saliva (n = 3). (C) Quantity of total miRNA contained in EVs isolated by ultracentrifugation from 1 mL of human non-filtered saliva (NF) and 0.45 µm or 0.22 µm filtered saliva (n = 4). (D) miRNA levels in EVs isolated by ultracentrifugation from filtered 0.45 µm or 0.22 µm saliva relative to EVs isolated from non-filtered saliva (NF). Results are given as fold-change versus control non-filtered saliva normalized at 1. (n = 4). *p < 0.05; **p < 0.01.

References

    1. van Niel, G., D’Angelo, G. & Raposo, G. Shedding light on the cell biology of extracellular vesicles. Nat. Rev. Mol. Cell Biol.19, 213–228. 10.1038/nrm.2017.125 (2018). - PubMed
    1. Caby, M. P., Lankar, D., Vincendeau-Scherrer, C., Raposo, G. & Bonnerot, C. Exosomal-like vesicles are present in human blood plasma. Int. Immunol.17, 879–887. 10.1093/intimm/dxh267 (2005). - PubMed
    1. Pisitkun, T., Shen, R. F. & Knepper, M. A. Identification and proteomic profiling of exosomes in human urine. Proc. Natl. Acad. Sci. U. S. A.101, 13368–13373. 10.1073/pnas.0403453101 (2004). - PMC - PubMed
    1. Admyre, C. et al. Exosomes with immune modulatory features are present in human breast milk. J. Immunol.179, 1969–1978. 10.4049/jimmunol.179.3.1969 (2007). - PubMed
    1. Bachy, I., Kozyraki, R. & Wassef, M. The particles of the embryonic cerebrospinal fluid: How could they influence brain development?. Brain Res. Bull.75, 289–294. 10.1016/j.brainresbull.2007.10.010 (2008). - PubMed

LinkOut - more resources