. 2024 Dec 28;14(1):31364.
doi: 10.1038/s41598-024-82849-y.

Bioinformatics identifies key genes and potential therapeutic targets in the pathological mechanism of oxidative stress in Randall's plaque

Affiliations

Bioinformatics identifies key genes and potential therapeutic targets in the pathological mechanism of oxidative stress in Randall's plaque

Fan Li et al. Sci Rep. .

Abstract

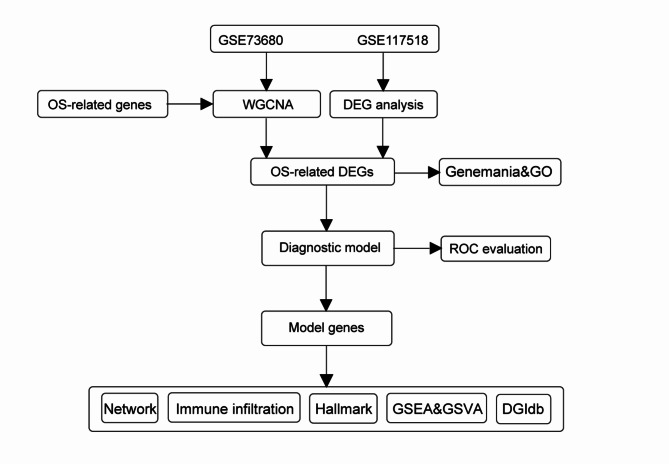
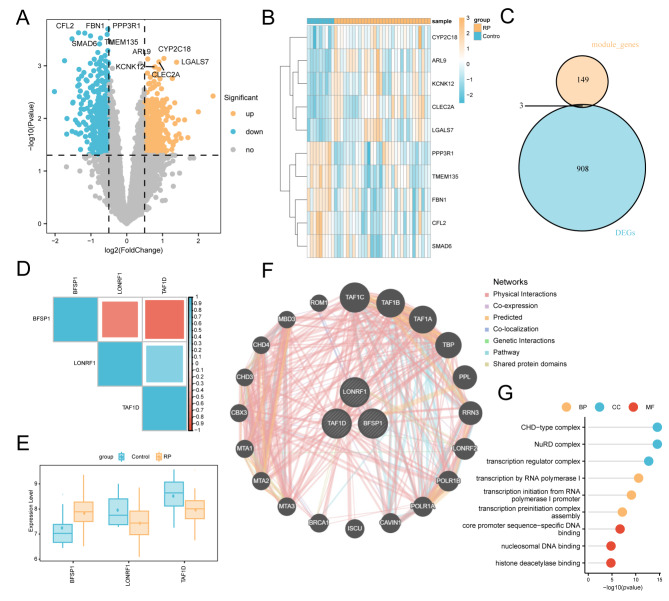
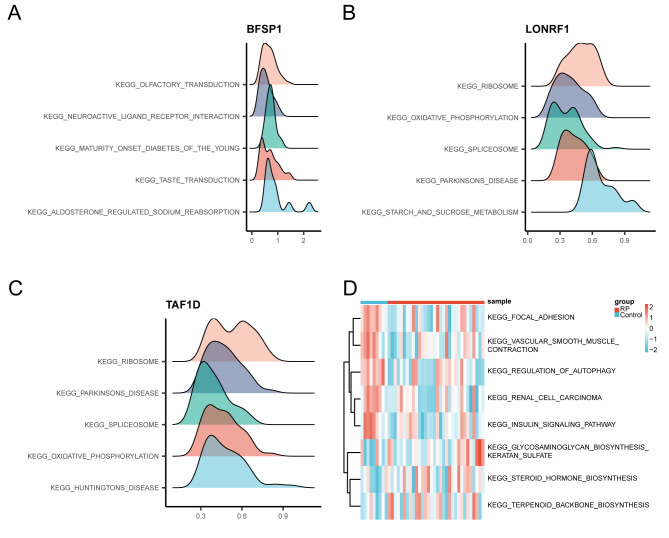
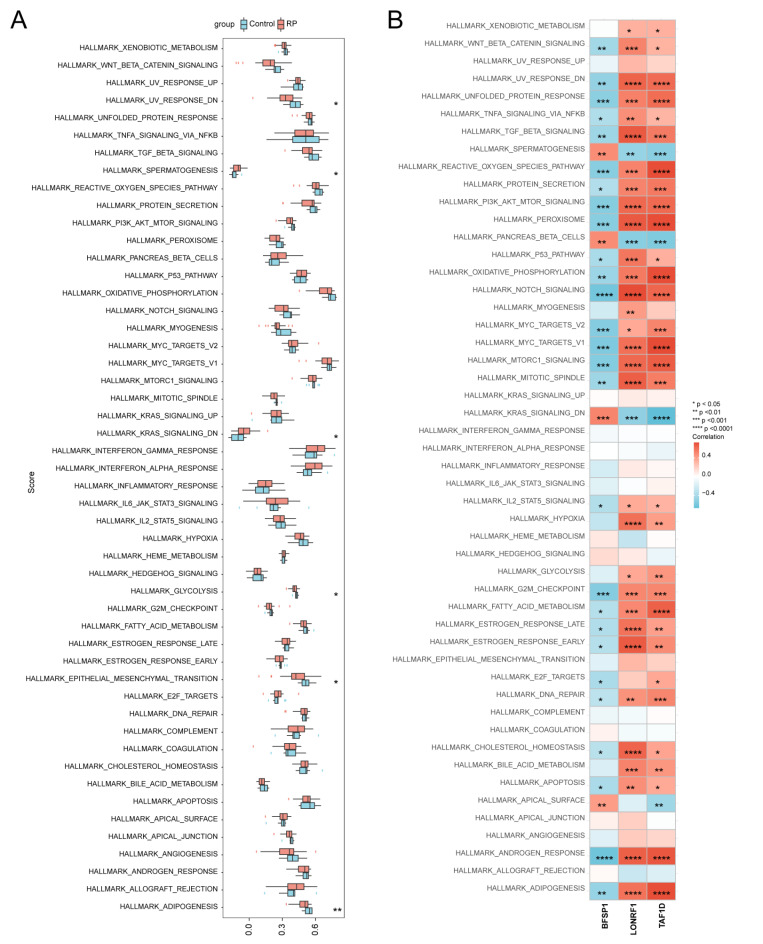
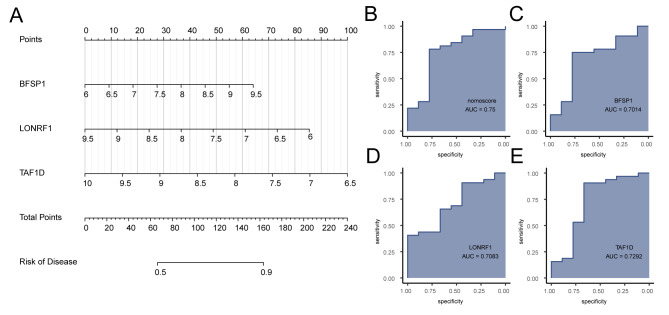
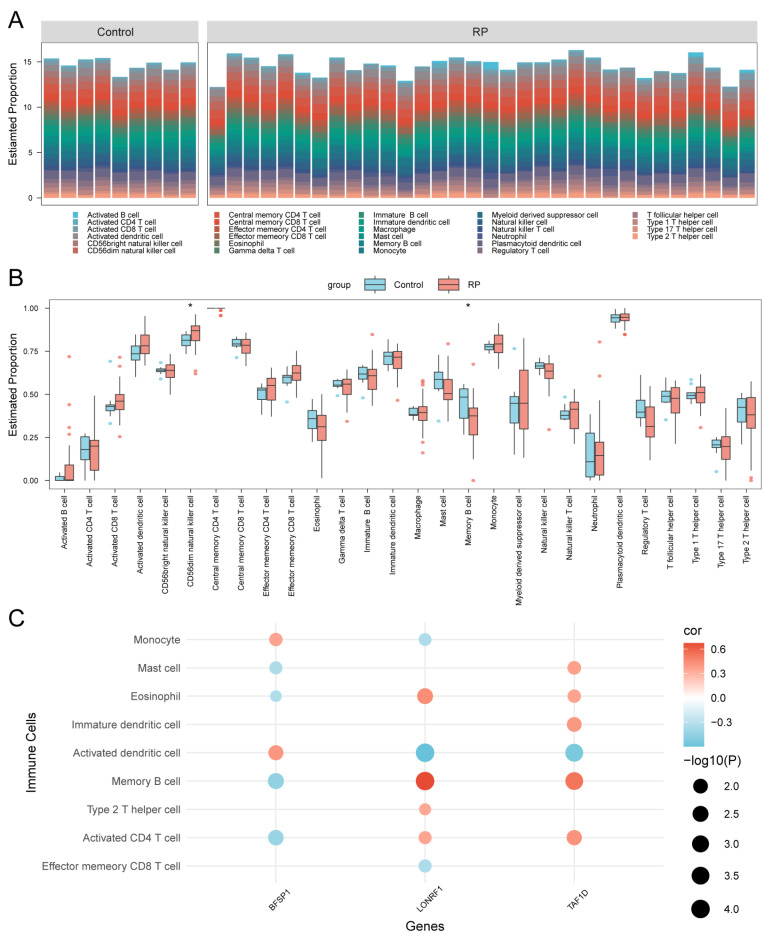
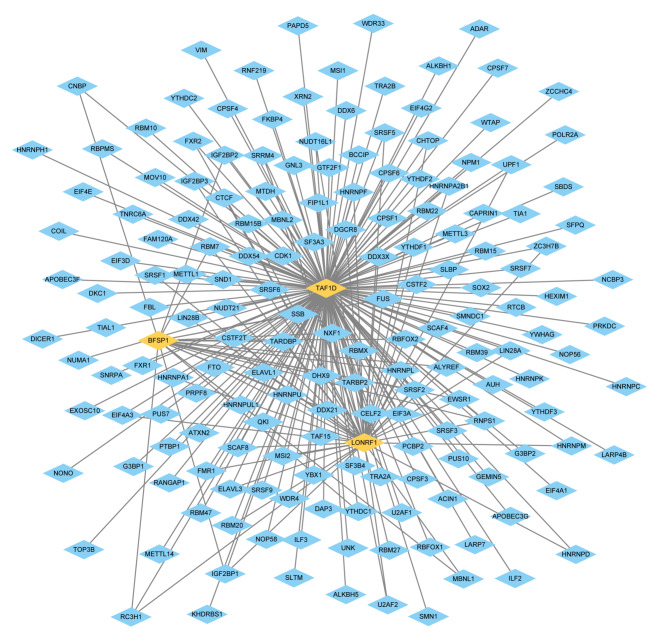
Randall's plaque (RP) is recognized as a precursor lesion for kidney stones, with its formation and progression potentially linked to oxidative stress. Previous studies have provided limited insights into the underlying mechanisms of RP, failing to fully elucidate its molecular pathways. To investigate the relationship between oxidative stress and RP, we employed bioinformatics approaches to identify key genes, predict associated pathways and drug molecules, analyze variations in immune cell populations, and construct diagnostic models. We initially identified three differentially expressed genes related to oxidative stress: BFSP1, LONF1, and TAF1D. These genes and their co-expressed counterparts are enriched in pathways related to oxidative phosphorylation, cellular adhesion processes, steroid hormone biosynthesis, and autophagy. Furthermore, we observed significant differences in two types of immune cells across the study groups. Ultimately, predictions from drug molecular docking suggest that BFSP1 may serve as a promising therapeutic target for RP. We propose that the formation of RP mediated by oxidative stress could be associated with BFSP1, LONF1, TAF1D along with CD56dim natural killer cells and memory B cells. Thus far, BFSP1 emerges as a pivotal therapeutic target for RP development. These findings offer new perspectives on the mechanisms underlying the pathogenesis of RP.

Keywords: BFSP1; Bioinformatic analysis; LONRF1; Oxidative stress; Randall's plaque; TAF1D.


Conflict of interest statement

Declarations. Competing interests: The authors declare no competing interests.

Figures

Fig. 1
Fig. 1
Flow chart.
Fig. 2
Fig. 2
(A) Soft threshold β = 7 and scale-free topology fitting index (R2). (B) Analysis of the gene expression network identified different modules in the co-expression data. (C) Relationship between module eigengenes and oxidative stress. Each row in the table corresponds to a module eigengene, and each column corresponds to a trait. The numbers in the table represent the correlation between the module eigengenes and traits, with P-values shown in parentheses below the correlation values. Correlations are color-coded according to the color legend. (D) Correlation heatmap of the eigengene network. Each row and column in the heatmap corresponds to the eigengenes of a module (color-coded). In the heatmap, red indicates high adjacency, while blue indicates low adjacency. The red rectangles on the diagonal represent meta-modules. (E) Correlation between module membership (MM) and oxidative stress (OS) gene significance (GS) for all genes in the greenyellow module. Cor represents the absolute correlation coefficient between GS and MM.
Fig. 3
Fig. 3
Selection and enrichment analysis of oxidative stress-related differentially expressed genes (DEGs). (A) The volcano plot illustrates the distribution of DEGs between plaque and control samples. Orange, blue, and gray dots represent genes with upregulated, downregulated, and no significant expression, respectively. (B) The heatmap shows the top 10 DEGs ranked by differential expression. (C) The Venn diagram displays the identification of oxidative stress-related DEGs. (D) Correlation heatmap of hub genes. (E) Boxplot of hub gene expression, with p < 0.05. (F) Co-expression protein interaction network of hub genes. (G) GO enrichment analysis results of co-expressed genes of hub genes.
Fig. 4
Fig. 4
Single-gene GSEA and GSVA of hub genes. (A) Single-gene GSEA of BFSP1. (B) Single-gene GSEA of LONRF1. (C) Single-gene GSEA of TAF1D. (D) GSVA of RP.
Fig. 5
Fig. 5
Correlation between hub genes and 50 Hallmark signaling pathways. (A) Comparison of Hallmark signaling pathways between the RP group and the control group. (B) Correlation between hub genes and 50 Hallmark signaling pathways.
Fig. 6
Fig. 6
Construction and Validation of the Diagnostic Model. (A) Nomogram for predicting RP. (B) ROC curve evaluating the predictive ability of the nomogram model. (C) ROC curve evaluating the predictive ability of BFSP1. (D) ROC curve evaluating the predictive ability of LONRF1. (E) ROC curve evaluating the predictive ability of TAF1D.
Fig. 7
Fig. 7
Immune Infiltration Levels between RP and Control Groups. (A) Stacked bar plot showing the relative proportions of infiltrating immune cells. (B) Box plot of estimated proportions of immune cells between the RP and control groups. Asterisks indicate p-values: ****p < 0.0001, ***p < 0.001, **p < 0.01, *p < 0.05. (C) Scatter plot showing the correlation between hub genes and immune cells.
Fig. 8
Fig. 8
RBP-mRNA Network. RBP-mRNA regulatory network of hub genes. Light blue represents RBPs, and orange represents mRNAs.
Fig. 9
Fig. 9
ceRNA Network. Network diagram of lncRNA–miRNA–mRNA interactions for hub genes. Orange-yellow represents lncRNAs, orange-red represents mRNAs, and light blue represents miRNAs.
Fig. 10
Fig. 10
Potential Drugs and Molecular Docking. Molecular docking of the drug compound COMPOUND 111 with the predicted target protein BFSP1.

Similar articles

References

    1. Sorokin, I. et al. Epidemiology of stone disease across the world. World J. Urol.35, 1301–1320 (2017). - PubMed
    1. Romero, V., Akpinar, H. & Assimos, D. G. Kidney stones: A global picture of prevalence, incidence, and associated risk factors. Rev. Urol.12, e86–96 (2010). - PMC - PubMed
    1. Wigner, P., Grębowski, R., Bijak, M., Szemraj, J. & Saluk-Bijak J. Mol. Asp. Nephrolithiasis Dev. Cells10 (2021). - PMC - PubMed
    1. Liu, Y. D. et al. Rosiglitazone suppresses calcium oxalate crystal binding and oxalate-induced oxidative stress in renal epithelial cells by promoting PPAR-γ activation and subsequent regulation of TGF-β1 and HGF expression. Oxid. Med. Cell Longev. 4826525 (2019). - PMC - PubMed
    1. Leek, J. T., Johnson, W. E., Parker, H. S., Jaffe, A. E. & Storey, J. D. The sva package for removing batch effects and other unwanted variation in high-throughput experiments. Bioinformatics28, 882–883 (2012). - PMC - PubMed

LinkOut - more resources