. 2024 Dec 28;14(1):31261.
doi: 10.1038/s41598-024-82670-7.

Coupled echosounder and Doppler profiler measurements in the Strait of Gibraltar

Affiliations

Coupled echosounder and Doppler profiler measurements in the Strait of Gibraltar

Simone Sammartino et al. Sci Rep. .

Abstract

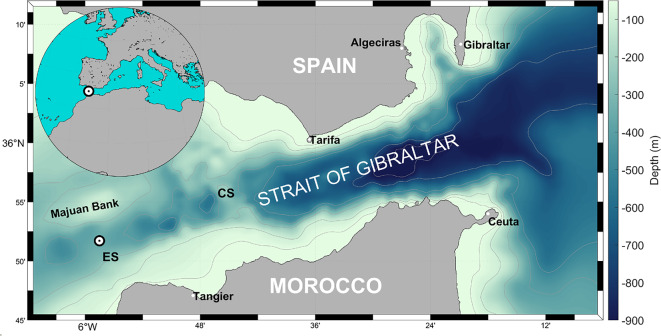
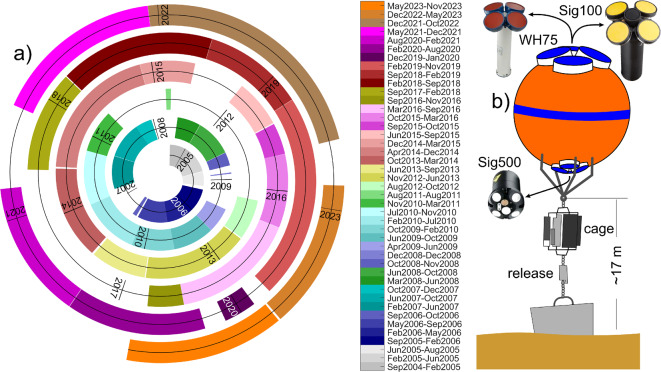
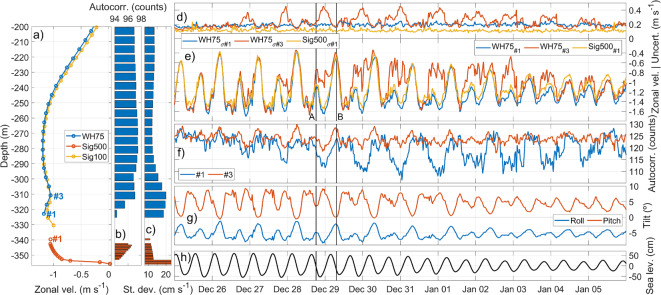
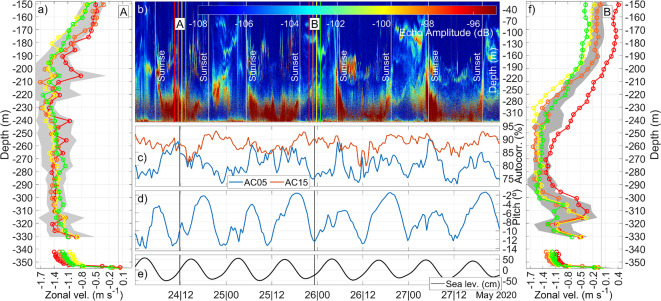
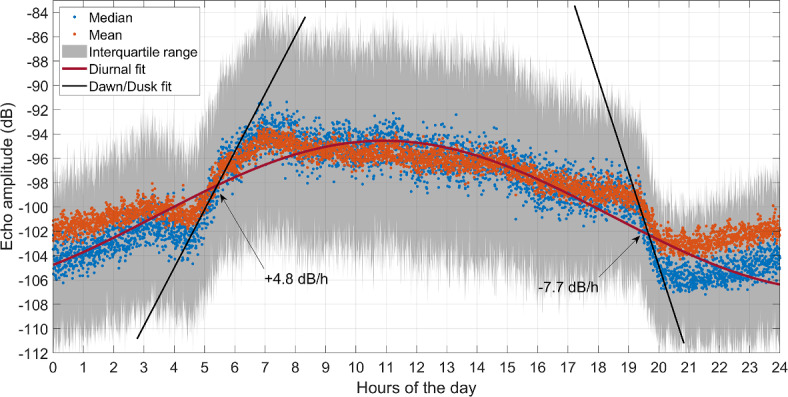
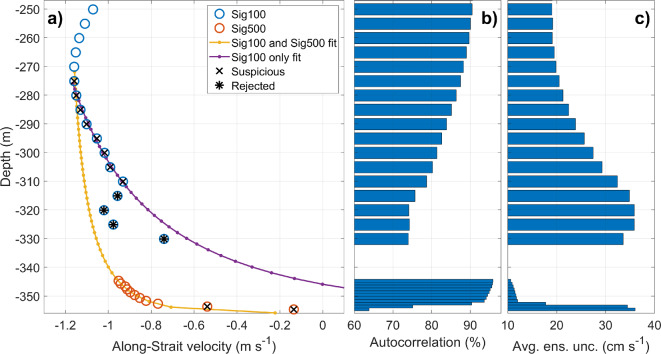
Long time series of velocity profiles collected by up-looking acoustic profilers in the westernmost sill of the Strait of Gibraltar show an unexpected pattern in the deepest ∼80 m of the water column, consisting in an appreciable diurnal weakening of the measured horizontal velocity. A harmonic analysis performed on long time series reveals a surprising magnitude of S1 constituent (exactly 1 cpd of frequency) in the horizontal velocity and echo amplitude, which prevails over the rest of diurnal constituents within this depth range, including K1, despite being around 200 times smaller than it in the tide generating potential. High resolution echograms collected by a new instrument recently installed in the mooring line, point at the diel vertical migration of living acoustic scatterers (zooplankton) as the most reasonable cause. It provokes a nightly depletion of scatterers availability near the bottom, which is registered by the instrument as a nighttime weakening of the velocity, as well as an increase of its uncertainty, at the deepest part of the profile. Newly acquired high spatial resolution measurements of the velocity near the seafloor report intense currents which are incompatible with the ones produced by the scatterers scarceness. This result indicates an overall underestimation of the Mediterranean current in previous works of approximately 17% within the depth range of 280-360 m, which in turn translates into an underestimation of previously computed outflow of ∼5%. These new findings make it necessary the re-computation of all the near-20-year long (to date) series of Mediterranean outflow based on the observations collected at this sill of the Strait of Gibraltar.

Keywords: ADCP; Law of the wall; Mediterranean outflow; Strait of Gibraltar; Velocity profile; Zooplankton diel vertical migration.


Conflict of interest statement

Competing interests: The authors declare no competing interests.

Figures

Fig. 1
Fig. 1
Map of the Strait of Gibraltar with the position (white circle) of the monitoring station in Espartel Sill (ES). The main Camarinal Sill is indicated by the acronym CS.
Fig. 2
Fig. 2
(a) Spiral plot of the 43 deployments in the ES from September 2004 to November 2023. The durations of the experiments are scaled over the radius of the spiral and they are not directly comparable. (b) Simplified sketch of the mooring structure. The buoy is not to scale with the rest of the structure.
Fig. 3
Fig. 3
(a) Averaged zonal velocity measured with WH75 (blue), Sig100 (yellow) and Sig500 (red) ADCPs during the period December 2019–February 2020. Bins are numbered according to the instrument orientation: upwards for the up-looking WH75 and downwards for the down-looking Sig500. (b) Averaged autocorrelation of the backscattered echo. (c) Averaged zonal velocity ensemble standard deviation. (e) Time series of zonal velocity (negative values) and (d) its corresponding ensemble standard deviation of WH75 bins #1 and #3, and Sig500 bin #1 (see legend for color-coding) from 25th December 2019 to 6th January 2020. The two timestamps A and B, discussed in the text, are highlighted with labeled vertical lines. (f) Autocorrelation of WH75 bins #1 and #3. (g) WH75 roll and pitch. (h) Sea level measured by the Tarifa tide gauge (see location in Fig. 1).
Fig. 4
Fig. 4
(a) Amplitude of S1 constituent computed on WH75 zonal velocity profile (blue lines) and scattered echo amplitude (averaged over the four beams in orange lines), during the period September 2018–December 2019. K1 amplitude profile of the zonal velocity (blue line) and scattered echo amplitude (orange line) are also shown in dot-dashed line. Zonal velocity and scattered echo are read as cm s−1 and dimensionless counts, respectively, in the same axes. (b) Same as (a) only for phase of the S1 constituent (degrees). In both panels, semitransparent areas depict ± 0.95 confidence intervals.
Fig. 5
Fig. 5
(a) and (f) Four zonal velocity profiles collected by Sig100 and Sig500 ADCPs around the time of maximum flood (3 h after low water, see (e) on 24th May, 2020 around 12:00 (set A) and on 26th May, 2020 around 0:00 (set B), respectively. Gray shadows represent the Sig100|Sig500 mean zonal velocity uncertainty (see text). (b) 99 kHz echogram (dB) collected with 2 0 s sampling interval and 1 m vertical resolution, between 24 and 28th of May, 2020. Vertical lines indicate the sunset and sunrise times at the mooring latitude. The time of the profiles displayed in panels (a) and (f) are indicated with the same color code. (c) Autocorrelation (%) of the backscattered echo averaged over bins 1–10 (AC05—from 285 to 330 m depth) and bins 11–20 (AC15—from 235 to 280 m depth). (d) Sig100 pitch (degrees). (e) Sea level measured in Tarifa.
Fig. 6
Fig. 6
(a) Time average of the dimensionless-transformed 99 kHz echogram (quantity I - black thick line) with the associated standard deviation (gray area), computed for the whole experiment mentioned in the text. (b) Echogram anomaly obtained as the echo record subtracted by the average profile of (a). The time interval is the same of Fig. 5. The original echogram series has been backward converted to linear dimensionless quantities by using equation (2).
Fig. 7
Fig. 7
Median (blue dots) and mean (orange dots) of the echogram time series extracted at 310 m depth grouped every 20 s over an entire day. Gray area depicts the interquartile range centered in the median values. Purple line is the 1 cpd harmonic fit and the two black lines are the linear fits of the portion of the series around dawn (left) and dusk (right), with indication of the linear slope.
Fig. 8
Fig. 8
(a) Deepest 100 m of the time-averaged profile of along-strait velocity (May to December 2021). Sig100 and Sig500 velocity data are depicted in blue and red circles, respectively. Rejected and suspicious bins are marked with asterisks and crosses, respectively. Yellow line is the fit to Sig100 and Sig500 data after removing rejected and suspicious bins. Purple line is the fit to Sig100 data only, after excluding the rejected bins. (b) Averaged profiles of autocorrelation. (c) Averaged profiles of standard deviation of the ensembles (averaged ensemble uncertainty).
Fig. A1
Fig. A1
(a) Ensemble uncertainty (blue line), and average and RMS (yellow and red line, respectively) of the zonal current standard deviation of the ensembles obtained from 2 to 300 ppe in the period December 2019–January 2020. The ensemble uncertainty is computed as εe=εp/N, with N the varying ppe, and εp = 22.3 cm s−1 the single ping standard deviation as prescribed by . (b) Zonal current standard deviation of ensembles obtained by averaging 10 (light blue) and 300 (dark blue) pings, velocity error averaged over 10 (light orange) and 300 (dark red) pings. (c) Zonal current during the measured period. All quantities are computed at the third bin from the bottom, corresponding to the maximum averaged uncertainty (see Fig. 3c).

References

    1. Bethoux, J. P. Budgets of the Mediterranean Sea. Their dependence on the local climate and on the characteristics of the Atlantic waters. Oceanol. Acta2, 157–163 (1979).
    1. Armi, L. & Farmer, D. M. The flow of Mediterranean water through the Strait of Gibraltar. Prog. Oceanogr.21, 1–105 (1988).
    1. Bryden, H. L., Candela, J. & Kinder, T. H. Exchange through the Strait of Gibraltar. Prog. Oceanogr.33, 201–248 (1994).
    1. Lacombe, H. & Richez, C. The regime of the strait of Gibraltar, in Elsevier Oceanography Series (ed. Jacques, C. J. N.) vol. 34 13–73 (Elsevier, 1982).
    1. García Lafuente, J. et al. Tide at the eastern section of the Strait of Gibraltar. J. Geophys. Res. Oceans105, 14197–14213 (2000).

LinkOut - more resources