. 2024 Dec 28;14(1):31454.
doi: 10.1038/s41598-024-83184-y.

Integrating immune multi-omics and machine learning to improve prognosis, immune landscape, and sensitivity to first- and second-line treatments for head and neck squamous cell carcinoma

Affiliations

Integrating immune multi-omics and machine learning to improve prognosis, immune landscape, and sensitivity to first- and second-line treatments for head and neck squamous cell carcinoma

Ji Yin et al. Sci Rep. .

Abstract

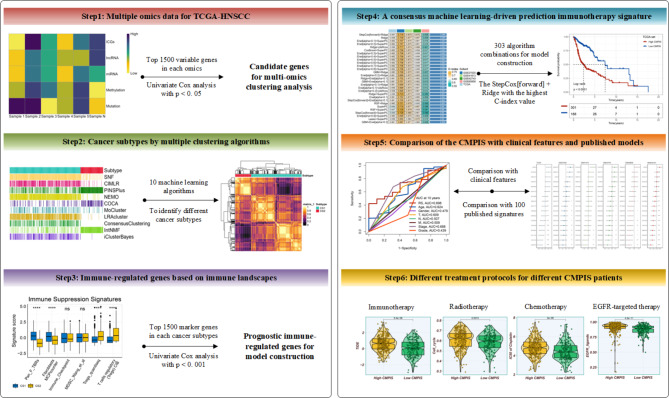
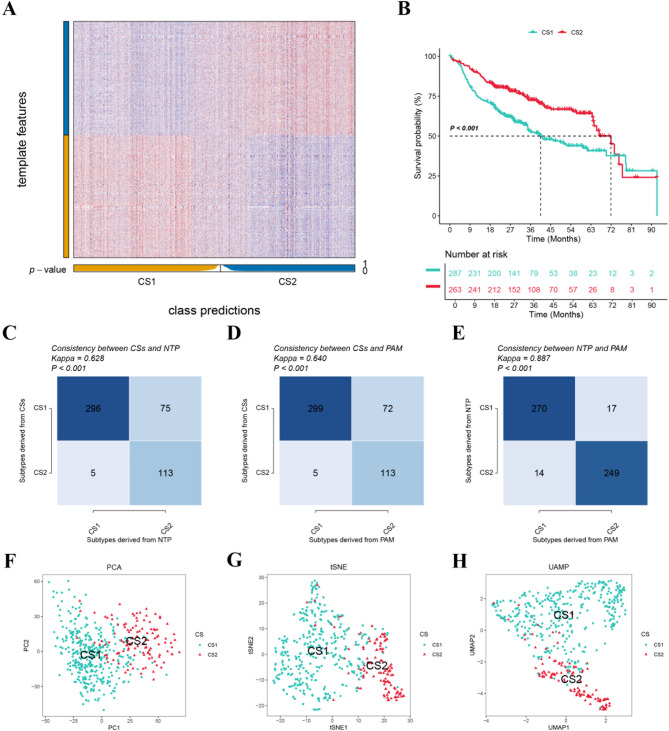
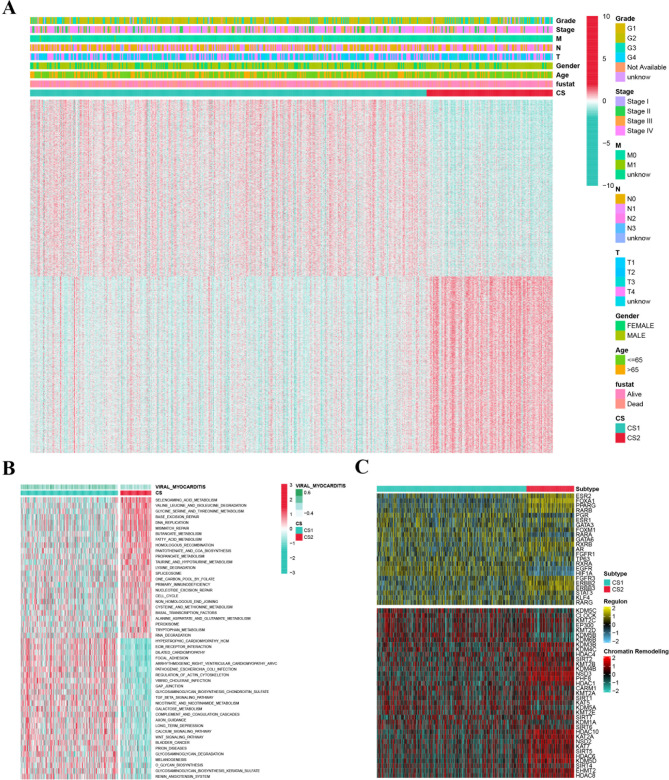
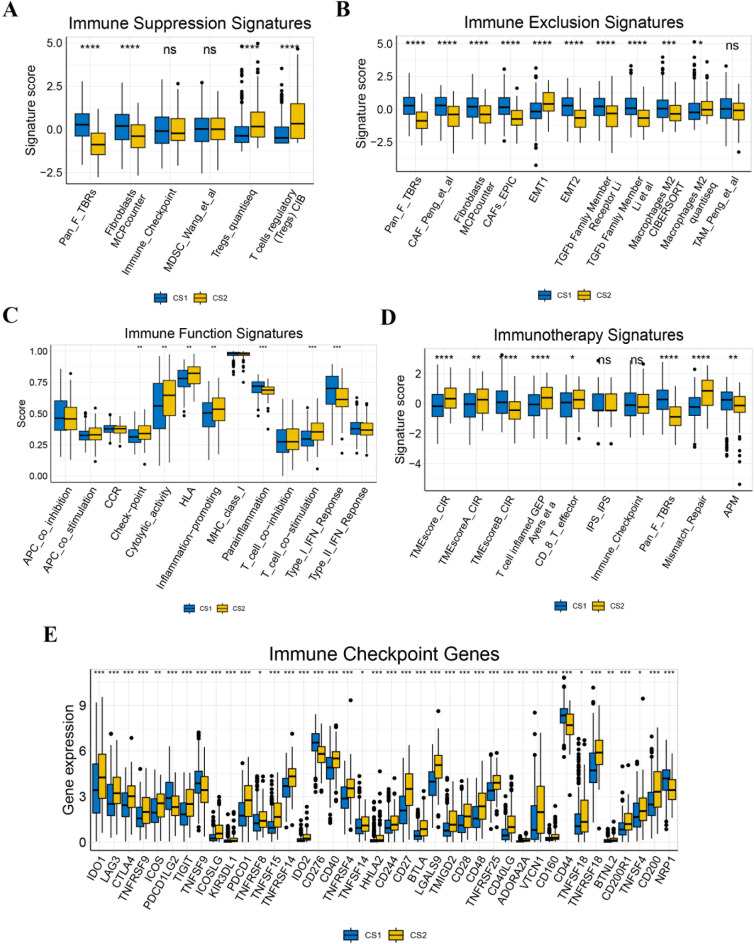
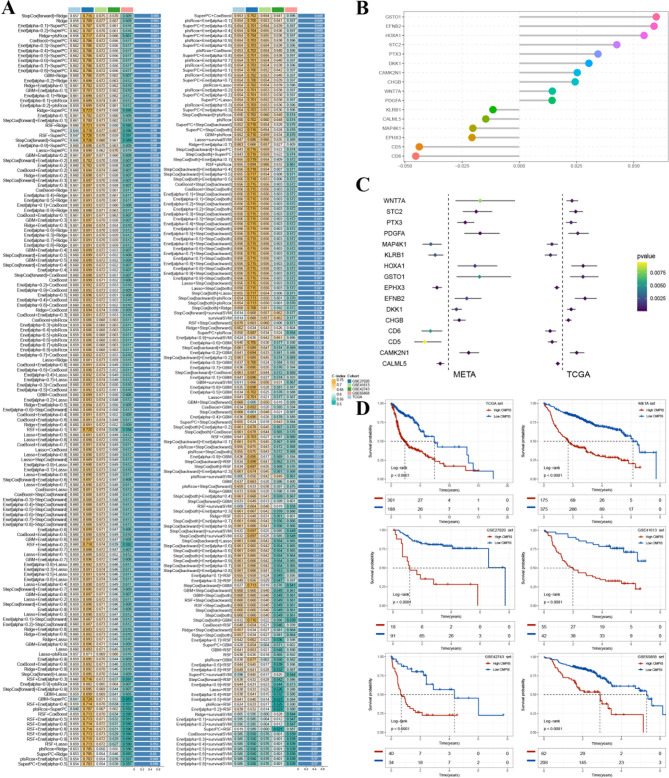
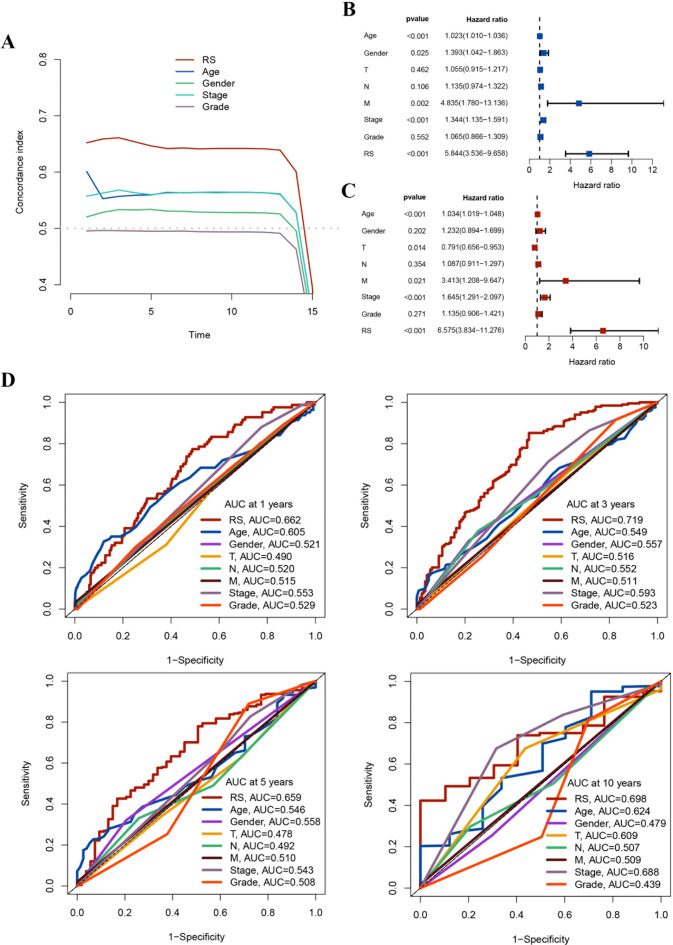
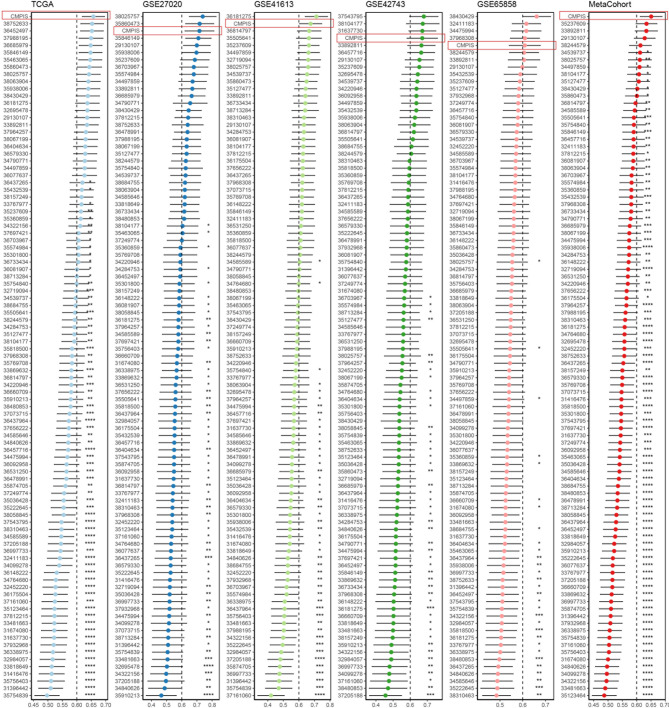
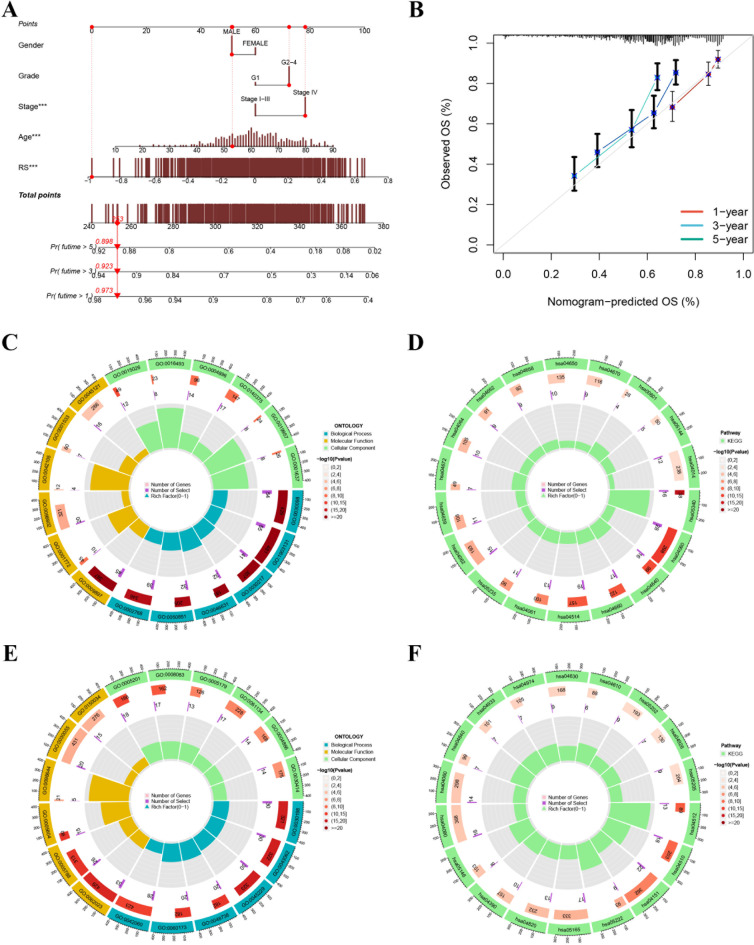
In recent years, immune checkpoint inhibitors (ICIs) has emerged as a fundamental component of the standard treatment regimen for patients with head and neck squamous cell carcinoma (HNSCC). However, accurately predicting the treatment effectiveness of ICIs for patients at the same TNM stage remains a challenge. In this study, we first combined multi-omics data (mRNA, lncRNA, miRNA, DNA methylation, and somatic mutations) and 10 clustering algorithms, successfully identifying two distinct cancer subtypes (CSs) (CS1 and CS2). Subsequently, immune-regulated genes (IRGs) and machine learning algorithms were utilized to construct a consensus machine learning-driven prediction immunotherapy signature (CMPIS). Further, the prognostic model was validated and compared across multiple datasets, including clinical characteristics, external datasets, and previously published models. Ultimately, the response of different CMPIS patients to immunotherapy, targeted therapy, radiotherapy and chemotherapy was also explored. First, Two distinct molecular subtypes were successfully identified by integrating immunomics data with machine learning techniques, and it was discovered that the CS1 subtype tended to be classified as "cold tumors" or "immunosuppressive tumors", whereas the CS2 subtype was more likely to represent "hot tumors" or "immune-activated tumors". Second, 303 different algorithms were employed to construct prognostic models and the average C-index value for each model was calculated across various cohorts. Ultimately, the StepCox [forward] + Ridge algorithm, which had the highest average C-index value of 0.666, was selected and this algorithm was used to construct the CMPIS predictive model comprising 16 key genes. Third, this predictive model was compared with patients' clinical features, such as age, gender, TNM stage, and grade stage. The findings indicated that this prognostic model exhibited the best performance in terms of C-index and AUC values. Additionally, it was compared with previously published models and it was found that the C-index of CMPIS ranked in the top 5 among 94 models across the TCGA, GSE27020, GSE41613, GSE42743, GSE65858, and META datasets. Lastly, the study revealed that patients with lower CMPIS were more sensitive to immunotherapy and chemotherapy, while those with higher CMPIS were more responsive to radiation therapy and EGFR-targeted treatments. In summary, our study identified two CSs (CS1 and CS2) of HNSCC using multi-omics data and predicted patient prognosis and treatment response by constructing the CMPIS model with IRGs and 303 machine learning algorithms, which underscores the importance of immunotherapy biomarkers in providing more targeted, precise, and personalized immunotherapy plans for HNSCC patients, significantly contributing to the optimization of clinical treatment outcomes.

Keywords: Consensus machine learning-driven prediction immunotherapy signature; Head and neck squamous cell carcinoma; Immune checkpoint inhibitors; Machine learning; Multi-omics; Prognosis.


Conflict of interest statement

Declaration. Competing interests: The authors declare no competing interests.

Figures

Fig. 1
Fig. 1
The research workflow.
Fig. 2
Fig. 2
Identification of cancer subtypes by immune multi-omics consensus clustering analysis. (A) The CPI and gap statistical analysis of the immune multi-omics clusters. (B) The sample similarity of each subgroup was assessed by calculating the silhoutte score. (C) Visualization of immune multi-omics consensus clustering analysis. (D) Consensus heatmap for CSs. (E) Consensus clustering matrix based on the 10 multi-omics algorithms. (F) Kaplan–Meier analysis of CSs in the TCGA cohort.
Fig. 3
Fig. 3
Validation of cancer subtypes. (A) Molecular subtype validation in the META cohort based on IRGs by the NTP algorithm. (B) Kaplan–Meier analysis of CSs in the META cohort. (C) The consistency between CSs and NTP in the TCGA cohort. (D) The consistency between CSs and PAM in the TCGA cohort. (E) The consistency between NTP and PAM in the META cohort. (F–H) The PCA, tSNE, and UMAP methods unveiled notable distinctions among the CSs.
Fig. 4
Fig. 4
Molecular characterization of cancer subtypes. (A) A heat map showed that CS1 was associated with higher mortality, older age, and a higher clinicopathologic stage. (B) CS1 was notably enriched in pathways related to the extracellular matrix, coagulation system, and TGF-beta signaling pathway. CS2 was significantly enriched in pathways related to the cell cycle, immune-related signaling, and metabolism-related signaling. (C) RXRA, EGFR, HIF1A, PGR, and RARA regulators were significantly activated in CS1, whereas ESR2, FOXA1, PPARG, RARB, RXRB, FGFR3, ERBB2, and ERBB3 were specifically enriched in CS2.
Fig. 5
Fig. 5
Immune cell infiltration of cancer subtypes. (A-E) T cells and B cells were significantly enriched in CS2, suggesting an immune-activated state, while CAFs were mainly enriched in CS1, suggesting an immune-suppressed state.
Fig. 6
Fig. 6
Immunotherapy of cancer subtypes. (A-E) Immune suppression signatures and immune exclusion signatures were significantly enriched in CS1, while immune function signatures, immunotherapy signatures, and ICGs were significantly enriched in CS2.
Fig. 7
Fig. 7
Construction of a consensus machine learning-driven prediction immunotherapy signature. (A) Models were constructed based on each of the 303 algorithms, and the average C-index value was calculated for each model across all cohorts. The highest average C-index (0.666) was achieved by the StepCox [forward] + Ridge algorithm. (B) The coefficients of individual PIRGs in the CMPIS. (C) The PIRGs in the univariate Cox analysis in the TCGA and META cohorts. (D) Survival analysis of different CMPIS groups in the TCGA, GSE27020, GSE41613, GSE42743, GSE65858, and META cohorts.
Fig. 8
Fig. 8
Comparison of the CMPIS with clinical features. (A) The C-index of CMPIS was higher than the clinical features. (B and C) Univariate and multivariate Cox analyses for the CMPIS and clinical features. (D) The AUC values for CMPIS at 1, 3, 5, and 10 years were greater than 0.65, exceeding the clinical features.
Fig. 9
Fig. 9
Comparison of CMPIS with published signatures. The CMPIS showed better C-index performance than almost 94 models in the TCGA, GSE27020, GSE41613, GSE42743, GSE65858, and META cohorts.
Fig. 10
Fig. 10
Construction of a nomogram and implementation of enrichment analysis. (A) A nomogram combining the CMPIS with pertinent clinical characteristics to enhance the clinical utility of the CMPIS. (B) The calibration curve analysis illustrated that the nomogram’s predictive accuracy aligns closely with real-world outcomes. (C and D) The marker genes in the low CMPIS group were significantly associated with immune cell activation, immune cell differentiation, immune-related signaling pathways, and immune checkpoint pathways. (E and D) The marker genes in the high CMPIS group were significantly associated with a variety of tumor-related pathways, cancer invasion and metastasis, and cytokine pathways.
Fig. 11
Fig. 11
Evaluation of immunotherapy response. (A) The RMS time difference by 12 and 24 months after treatment. (B) The LTS difference after 6 months of treatment. (C) A significantly lower CMPIS score in the responder group compared to the nonresponder group. (D-F) Lower CMPIS scores correlated with improved prognostic outcomes post-immunotherapy in the GSE78220 cohort and GSE135222 cohort, as well as better immunotherapy responses in the GSE91061 cohort. (G) Significant differences in priming and activation, trafficking of immune cells to tumors, and infiltration of immune cells into tumors among patients with low CMPIS scores. (H) Higher responsiveness in the low CMPIS group. (I-K) The low CMPIS group exhibited higher MSI scores and Dysfunction scores, while the high CMPIS group displayed elevated Exclusion scores.
Fig. 12
Fig. 12
Evaluation of radiotherapy, chemotherapy, and EGFR-targeted therapy responses. (A) Two radiotherapy-related biomarkers (hypoxia and cell cycle) were significantly enriched in the high CMPIS patients. (B) Three commonly used chemotherapeutic drugs (Cisplatin, 5-Fluorouracil, and Gemcitabine) were more sensitive in the low CMPIS patients. (C) EGFR ligand scores were higher in the high CMPIS patients, and the three EGFR-targeted therapeutic agents were more sensitive in the high CMPIS patients.

Similar articles

Cited by

References

    1. Wu, Z. H., Yun, T. & Cheng, Q. Data mining identifies six proteins that can act as prognostic markers for head and neck squamous cell carcinoma. Cell Transplant.29, 2138922012 (2020). - PMC - PubMed
    1. Torre, L. A. et al. Global cancer statistics, 2012. Ca. Cancer. J. Clin.65, 87–108 (2015). - PubMed
    1. Shield, K. D. et al. The global incidence of lip, oral cavity, and pharyngeal cancers by subsite in 2012. Ca. Cancer. J. Clin.67, 51–64 (2017). - PubMed
    1. Wang, Q., Zhao, Y., Wang, F. & Tan, G. A novel immune signature predicts immunotherapy responsiveness and reveals the landscape of the tumor immune microenvironment in head and neck squamous cell carcinoma. Front. Genet.13, 1051051 (2022). - PMC - PubMed
    1. Zhao, X. & Cui, L. A robust six-mirna prognostic signature for head and neck squamous cell carcinoma. J. Cell. Physiol.235, 8799–8811 (2020). - PubMed

Publication types

MeSH terms

Substances