. 2024 Dec 28;14(1):31236.
doi: 10.1038/s41598-024-82578-2.

Mitochondrial transplantation normalizes transcriptomic and proteomic shift associated with ischemia reperfusion injury in neonatal hearts donated after circulatory death

Affiliations

Mitochondrial transplantation normalizes transcriptomic and proteomic shift associated with ischemia reperfusion injury in neonatal hearts donated after circulatory death

Ilias P Doulamis et al. Sci Rep. .

Abstract

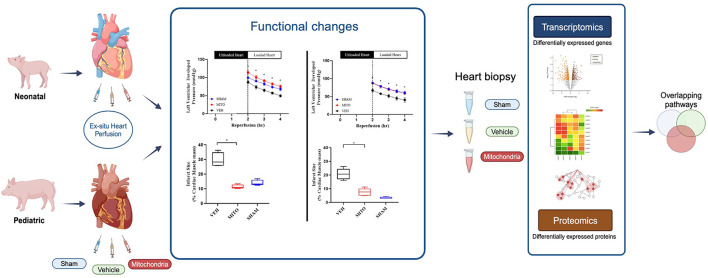
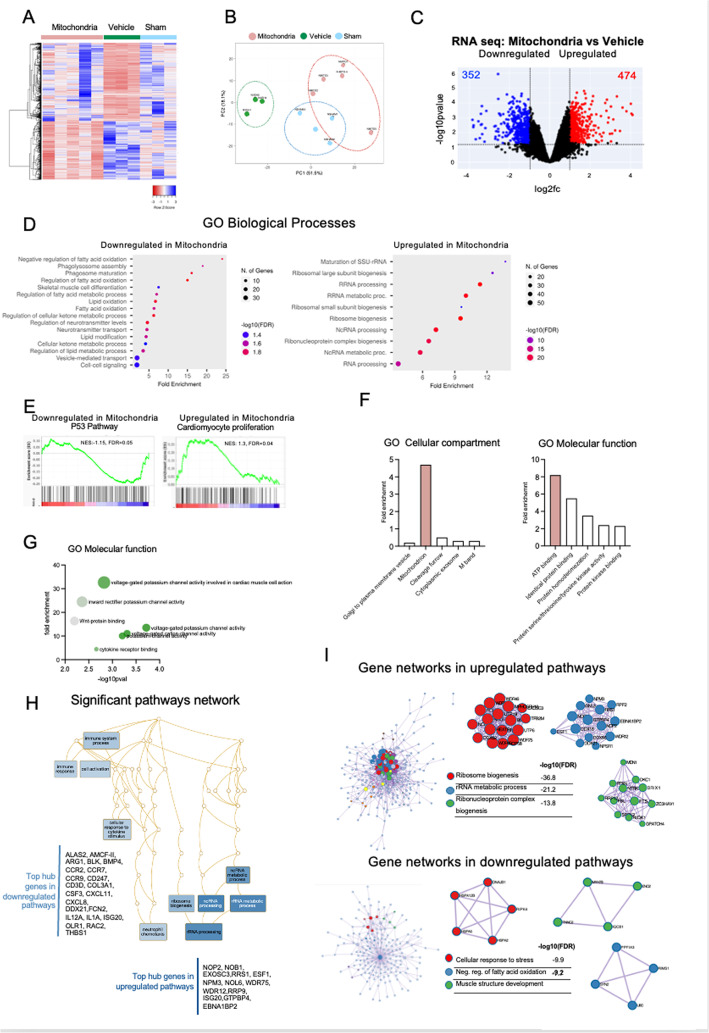
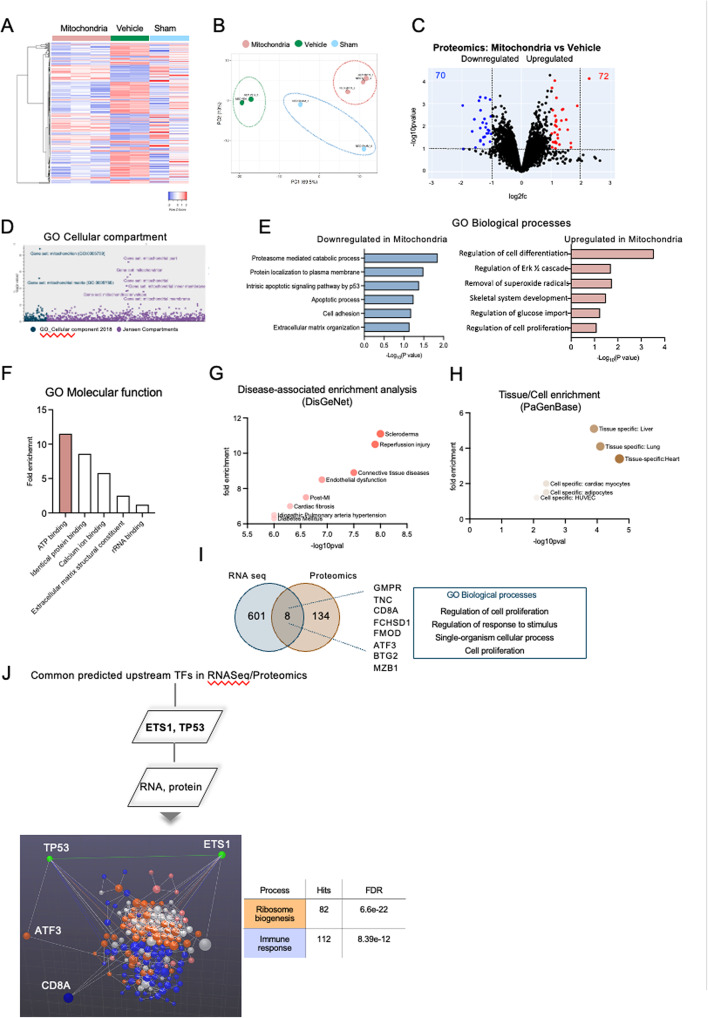
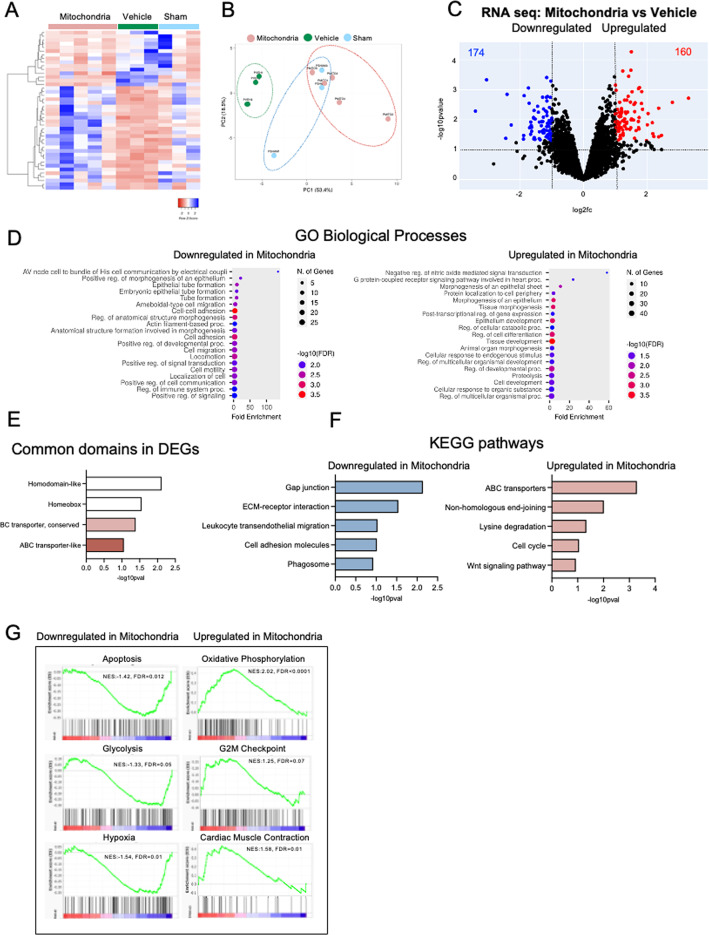
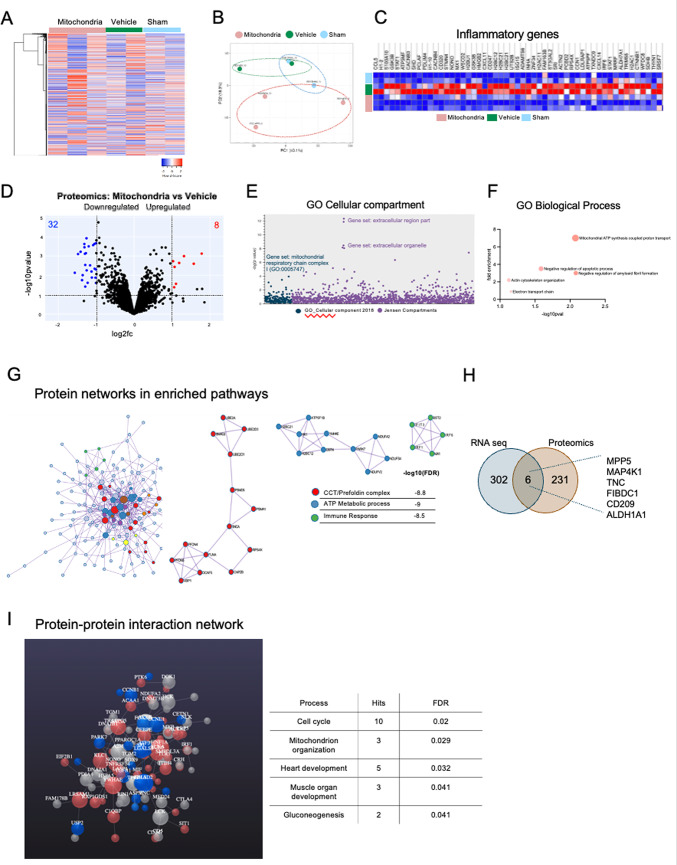
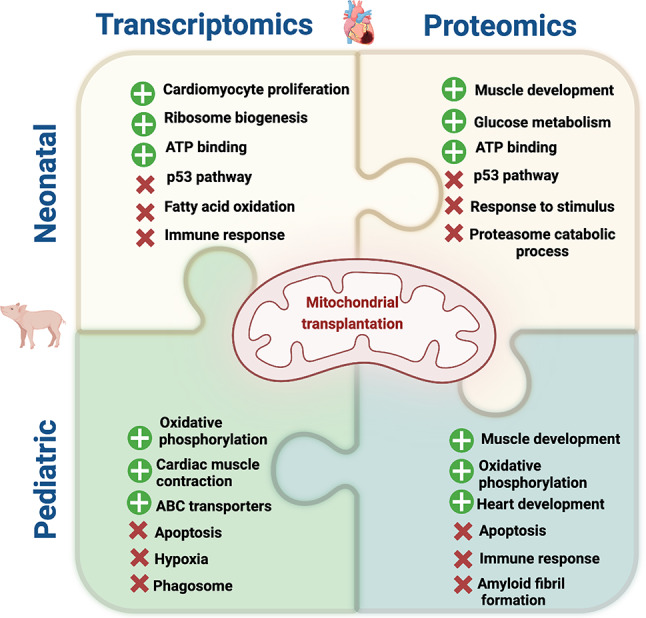
Heart transplantation remains the ultimate treatment strategy for neonates and children with medically refractory end-stage heart failure and utilization of donors after circulatory death (DCD) can expand th donor pool. We have previously shown that mitochondrial transplantation preserves myocardial function and viability in neonatal swine DCD hearts to levels similar to that observed in donation after brain death (DBD). Herein, we sought to investigate the transcriptomic and proteomic pathways implicated in these phenotypic changes using ex situ perfused swine hearts. Pathway analysis showed that ATP binding, voltage-gated K channel activity involved in cardiac cell muscle contraction and ribosomal RNA biogenesis were upregulated in the mitochondrial transplantation group, while mitochondria were the predicted source. Promotion of ribosome biogenesis and downregulation of apoptosis were the overlapping mechanisms between transcriptomic and proteomic alterations. Moreover, we showed that mitochondrial transplantation modulates ischemic transcriptomic and proteomic profiles to that of non-ischemia through the mitochondria. Replication of these findings in human in vivo experiments is warranted.

Keywords: Donation after cardiac death; Ex situ heart perfusion; Mitochondrial transplantation; Neonatal; Proteomic; RNA sequencing.


Conflict of interest statement

Declarations. Competing interests: The authors declare no competing interests.

Figures

Fig. 1
Fig. 1
Graphic representation of the study outline. Neonatal (3–4.5 kg) or pediatric (10–15 kg) female Yorkshire pigs underwent cardiac death by induction of deep anesthesia and neuromuscular blockade and extubation. Hearts were harvested and received either vehicle or mitochondria and underwent ex situ heart perfusion. A group of sham hearts underwent ex situ heart perfusion but not the part of the cardiac death. Tissue was collected and snap frozen in the end of the perfusion and RNA seq and SOMAscan were performed. Left ventricle developed pressure (mmHg) and infarct size (% of total cardiac mass) following 2 h. of unloaded and 2 h. of loaded ex-situ heart blood perfusion for sham control hearts receiving no warm ischemia (SHAM, blue), DCD hearts receiving vehicle alone (VEH, black) and DCD hearts receiving vehicle containing 5 × 109 mitochondria (MITO, red). VEH and MITO were both delivered as a bolus antegrade into the aortic root over 5 s. (Figures retrieved from Alemany, et al.). *p < 0.05 for Mitochondria vs Vehicle groups; VEH: Vehicle group; MITO: Mitochondria group; SHAM: Sham group.
Fig. 2
Fig. 2
(A) Heatmap of transcriptomic regulation patterns in neonatal DCD Mitochondria (Mitochondria), DCD Vehicle (Vehicle) and Sham (DBD) control hearts. Τhe log fold change of gene expression is shown with pseudocolor scale (-2 to 2), with blue denoting downregulation and orange denoting upregulation when comparing hearts that received mitochondria to vehicle. Columns represent FC comparisons, and rows represent the genes. Neonatal experimental groups are indicated. (B) Principal component analysis (PCA) for neonatal hearts receiving mitochondria (red circles) or vehicle alone (green circles). Sham indicated in blue. (C) Volcano plot indicating the downregulated (blue) and upregulated (red) genes in the neonatal mitochondria group compared to vehicle. (D) Gene ontology (GO) pathway analysis indicating downregulated and upregulated biological process in the neonatal mitochondria group compared to vehicle. The size of the dot correlates with the number of genes and the color with the fold change. (E) Enrichment plot analysis indicating downregulated and upregulated pathways in the neonatal mitochondria group compared to vehicle. NES: Normalized enrichment plot; FDR: False discovery rate. (F) Gene ontology analysis indicating the most significant cellular compartment and molecular function in the neonatal mitochondria group compared to vehicle. (G) Gene ontology molecular function analysis indicating the top 200 genes in the neonatal mitochondria group compared to vehicle. (H) Network analysis indicating the top hub genes in significantly downregulated and upregulated pathways in the neonatal mitochondria group compared to vehicle. (I) Gene networks in upregulated and downregulated pathways in the neonatal mitochondria group compared to vehicle. All results are shown following 4 h perfusion, consisting of 2 h. unloaded and then 2 h of isovolumic loaded heart perfusion for each group.
Fig. 3
Fig. 3
(A) Heatmap of proteomic regulation patterns in neonatal DCD Mitochondria (Mitochondria), DCD Vehicle (Vehicle) and Sham (DBD) control hearts. Τhe log fold change of gene expression is shown with pseudocolor scale (-2 to 2), with blue denoting downregulation and orange denoting upregulation. Columns represent FC comparisons, and rows represent the proteins. Neonatal experimental groups are found on the bottom. (B) Principal component analysis (PCA) for neonatal hearts receiving mitochondria (red circles) or vehicle alone (green circles). Sham indicated in blue. (C) Volcano plot indicating the downregulated (blue) and upregulated (red) proteins in the neonatal mitochondria group compared to vehicle. (D) Manhattan plot of two databases (Gene Ontology (GO) Cellular Component 2018 and Jensen Compartments) indicating the most significant GO cellular compartments when comparing neonatal mitochondria group to vehicle. (E) Barplots indicating upregulated and downregulated GO biological processes in the neonatal mitochondria group compared to vehicle. (F) Barplot indicating upregulated and downregulated GO molecular function in the neonatal mitochondria group compared to vehicle. (G) Dotplot indicating disease associated enrichment analysis when comparing neonatal mitochondria group to vehicle. (H) Dotplot indicating tissue/cell enrichment analysis when comparing neonatal mitochondria group to vehicle. (I) Venn diagram depicting the number and name of overlapping genes as well as the respective processes of the RNA seq and proteomics data when comparing neonatal mitochondria group to vehicle. (J) Common predicted upstream transcription factors (TF) in RNA seq and proteomics data when comparing neonatal mitochondria group to vehicle. Interaction network of ribosome biogenesis (orange) and immune response (blue) also shown. FDR: False discovery rate. All results are shown following 4 h perfusion, consisting of 2 h. unloaded and then 2 h of isovolumic loaded heart perfusion for each group.
Fig. 4
Fig. 4
(A) Heatmap of transcriptional regulation patterns at the end of the perfusion period. Τhe log fold change of gene expression is shown with pseudocolor scale (-2 to 2), with blue denoting downregulation and orange denoting upregulation. Columns represent FC comparisons, and rows represent the genes. Pediatric experimental groups are found on the bottom. (B) Principal component analysis (PCA) for pediatric hearts receiving mitochondria (red circles) or vehicle alone (green circles). Sham indicated in blue. (C) Volcano plot indicating the downregulated (blue) and upregulated (red) genes in the pediatric mitochondria group compared to vehicle. (D) Gene ontology (GO) pathway analysis indicating downregulated and upregulated biological process in the pediatric mitochondria group compared to vehicle. The size of the dot correlates with the number of genes and the color with the fold change. (E) Barplot indicating common domains of differentially expressed genes (DEGs) when comparing pediatric mitochondria group with vehicle. (F) Barplots indicating significant Kyoto Encyclopedia of Genes and Genomes (KEGG) pathways when comparing pediatric mitochondria group with vehicle. (G) Enrichment plot analysis indicating downregulated and upregulated pathways in the pediatric mitochondria group compared to vehicle. NES: Normalized enrichment plot; FDR: False discovery rate.
Fig. 5
Fig. 5
(A) Heatmap of proteomic regulation patterns at the end of the perfusion period. Τhe log fold change of gene expression is shown with pseudocolor, with blue denoting downregulation and orange denoting upregulation. Columns represent FC comparisons, and rows represent the proteins. Pediatric experimental groups are found on the bottom. (B) Principal component analysis (PCA) for pediatric hearts receiving mitochondria (red circles) or vehicle alone (green circles). Sham indicated in blue. (C) Heatmap of proteomic inflammatory alterations at the end of the perfusion period. Τhe log fold change of gene expression is shown with pseudocolor, with blue denoting downregulation and orange denoting upregulation. Columns represent FC comparisons, and rows represent the proteins. Pediatric experimental groups are found on the bottom. (D) Volcano plot indicating the downregulated (blue) and upregulated (red) proteins in the pediatric mitochondria group compared to vehicle. (E) Manhattan plot of two databases (Gene Ontology (GO) Cellular Component 2018 and Jensen Compartments) indicating the most significant GO cellular compartments when comparing pediatric mitochondria group to vehicle. (F) Dotplot indicating significant gene ontology (GO) biological processes when comparing pediatric mitochondria group to vehicle. (G) Protein networks in enrichment pathways when comparing neonatal mitochondria group to vehicle. FDR: False discovery rate. (H) Venn diagram depicting the number and name of overlapping genes as well as the respective processes of the RNA seq and proteomics data when comparing pediatric mitochondria group to vehicle. (I) Protein–protein interaction network for cell cycle, mitochondrion organization, heart development, muscle organ development and gluconeogenesis when comparing neonatal mitochondria group to vehicle. FDR: False discovery rate.
Fig. 6
Fig. 6
Graphical representation of the most important up- and down-regulated transcriptomic and proteomic pathways associated with mitochondrial transplantation in neonatal and pediatric DCD hearts. DCD: Donation after cardiac death.

Similar articles

Cited by

References

    1. Alemany, V. S. et al. Mitochondrial transplantation preserves myocardial function and viability in pediatric and neonatal pig hearts donated after circulatory death. J Thorac Cardiovasc Surg167, e6–e21 (2024). - PubMed
    1. Guariento, A. et al. Mitochondrial transplantation for myocardial protection in ex-situ-perfused hearts donated after circulatory death. J Heart Lung Transplant39, 1279–1288 (2020). - PubMed
    1. Soraya, A. S. et al. ATF3 expression in cardiomyocytes and myofibroblasts following transverse aortic constriction displays distinct phenotypes. Int J Cardiol Heart Vasc32, 100706 (2021). - PMC - PubMed
    1. Nobori, K. et al. ATF3 inhibits doxorubicin-induced apoptosis in cardiac myocytes: A novel cardioprotective role of ATF3. J Mol Cell Cardiol34, 1387–1397 (2002). - PubMed
    1. Masuzawa, A. et al. Transplantation of autologously derived mitochondria protects the heart from ischemia-reperfusion injury. Am J Physiol Heart Circ Physiol304, H966 (2013). - PMC - PubMed

LinkOut - more resources