

Understanding the association between urban noise and nighttime light in China
- PMID: 39732997
- PMCID: PMC11682171
- DOI: 10.1038/s41598-024-83125-9
Understanding the association between urban noise and nighttime light in China
Abstract
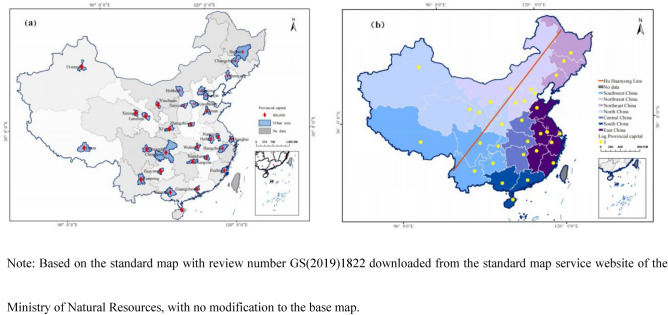
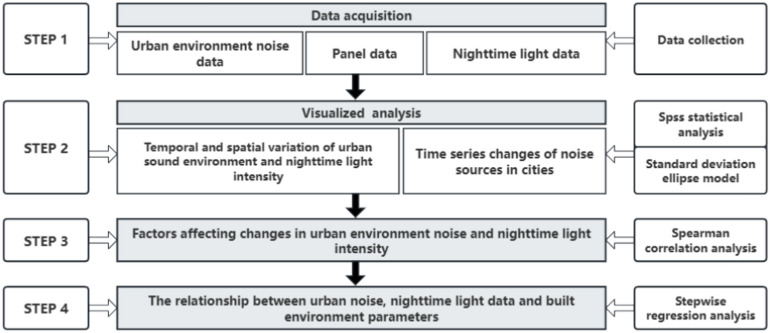
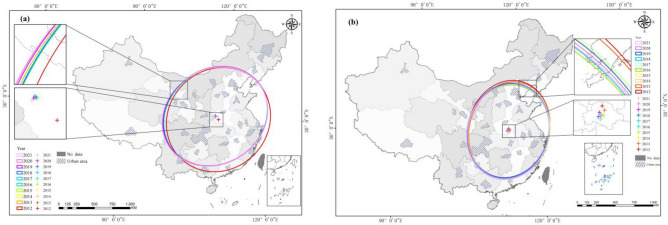
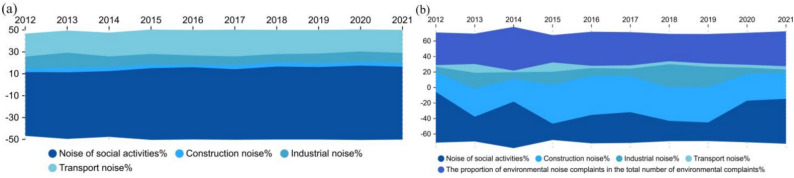
Nighttime light data partially reflects the process of urban modernization and its reaction to urban scale, but its correlation with noise remains unclear, especially over a long-term time series, remains unclear. To address this gap, we examine 31 provincial capital cities and municipalities in China as the study area, utilizing noise monitoring data and nighttime light data to explore their relationship in urban areas from 2012 to 2021. The results show that: (1) During the study period, the regional environmental noise and night light index of 31 major cities exhibited a consistent upward trend, with the average equivalent sound level of environmental noise in most urban areas fluctuating between 50.1 dB (A) and 60.0 dB (A). The overall quality evaluation was average, indicating that the effectiveness of noise pollution prevention and control was difficult to sustain in the long term. (2) The driving factor affecting the change in environmental noise quality in urban areas is population density. (3) There is a significant correlation between different types of noise proportion and urban construction and development, with the closest correlation observed with the urban economy, urban built-up area, and urban construction land area. Cities with high levels of urbanization tend to have more vulnerable acoustic environments. (4) Industrial noise percentage of urban environmental noise has a significant positive impact on nighttime light data. This study provides valuable insights for promoting the coordinated development between urbanization and acoustic environment optimization, as well as fostering a healthy and sustainable living environment.
Keywords: Correlation research; Influencing factors; Nighttime light data; Temporal and spatial variation; Urban environmental noise.
© 2024. The Author(s).
Conflict of interest statement
Declarations. Competing interests: The authors declare no competing interests.
Figures


References
-
- Ren, Y. et al. What is the efficiency of fast urbanization? A China study. Sustainability.10, 3180 (2018).
-
- Farrell, K. & Westlund, H. J. A. G. China’s rapid urban ascent: an examination into the components of urban growth. Asian Geogr.35, 106–185 (2018).
-
- Džambas, T., Ivančev, A. Č, Dragčević, V. & Bezina, Š. Analysis of road traffic noise in an urban area in Croatia using different noise prediction models. Noise Map.10.1515/noise-2024-0003 (2024).
-
- Clark, C., Crumpler, C., Notley, & Hilary,. Evidence for environmental noise effects on health for the United Kingdom policy context: a systematic review of the effects of environmental noise on mental health, wellbeing, quality of life, cancer, dementia, birth, reproductive outcomes, and cognition. Int. J. Environ. Res. Public Health.17, E393 (2020). - PMC - PubMed
LinkOut - more resources
Full Text Sources
Miscellaneous
