. 2024 Dec 28;14(1):31302.
doi: 10.1038/s41598-024-82692-1.

Vertical land motion is underestimated in sea-level projections from the Oka estuary, northern Spain

Affiliations

Vertical land motion is underestimated in sea-level projections from the Oka estuary, northern Spain

Tanghua Li et al. Sci Rep. .

Abstract

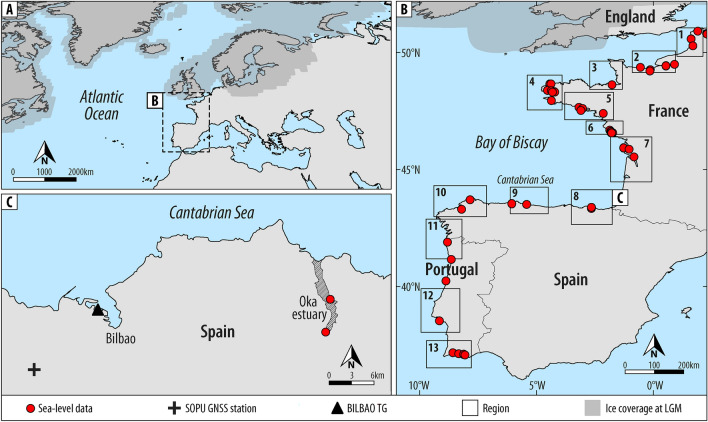
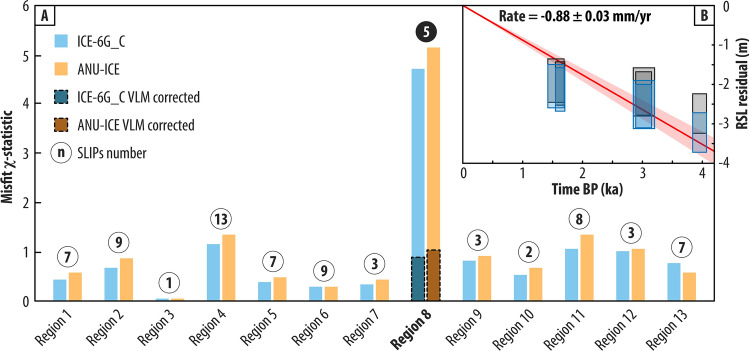
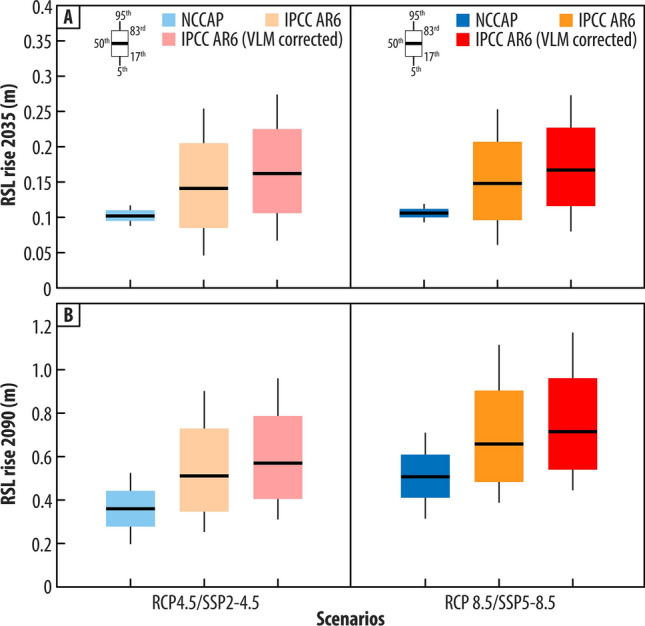
Coastal populations are susceptible to relative sea-level (RSL) rise and accurate local projections are necessary for coastal adaptation. Local RSL rise may deviate from global mean sea-level rise because of processes such as geoid change, glacial isostatic adjustment (GIA), and vertical land motion (VLM). Amongst all factors, the VLM is often inadequately estimated. Here, we estimated the VLM for the Oka estuary, northern Spain and compared it to the VLM component of sea-level projections in the Intergovernmental Panel on Climate Change (IPCC) Sixth Assessment Report (AR6) and the Spanish National Climate Change Adaptation Plan (NCCAP). To estimate VLM, we updated Holocene RSL data from the Atlantic coast of Europe and compared it with two 3D GIA models. Both models fit well with RSL data except in the Oka estuary. We derived a VLM rate of - 0.88 ± 0.03 mm/yr for the Oka estuary using the residuals of GIA misfits. Comparable VLM rates of - 0.85 ± 0.14 mm/yr and - 0.80 ± 0.32 mm/yr are estimated based on a nearby Global Navigation Satellite Systems station and differenced altimetry-tide gauge technique, respectively. Incorporating the updated late Holocene estimate of VLM in IPCC AR6 RSL projections under a moderate emissions scenario increased the rate of RSL rise by 15% by 2030, 11% by 2050, and 9% by 2150 compared to the original IPCC AR6 projections, and also increased the magnitude of RSL rise by over 40% by 2035 and 2090 compared with projections from the Spanish NCCAP. Our study demonstrates the importance of accurate VLM estimates for local sea-level projections.


Conflict of interest statement

Declarations. Competing interests: The authors declare no competing interests.

Figures

Fig. 1
Fig. 1
Atlantic coast of Europe study region and location of relative sea-level (RSL) databases. (A) The Atlantic coast of Europe and (B) the updated deglacial RSL database modified after ref. showing regions 1–13 and (C) region 8, Oka estuary and location of SOPU Global Navigation Satellite Systems (GNSS) and Bilbao tide gauge (TG) stations. The gray-shaded areas in panel A and B represent the ice coverage at Last Glacial Maximum (LGM, 26 ka BP) of ICE-6G_C,. The figure is generated using Generic Mapping Tools software version 5.4.5.
Fig. 2
Fig. 2
Holocene relative sea-level (RSL) data compared with predictions from 3D glacial isostatic adjustment (GIA) model ICE-6G_C (HetML140). Holocene RSL data showing sea-level index points (SLIP) are plotted as boxes with 2formula image vertical and temporal uncertainties and terrestrial and marine limiting data providing upper and lower constraints on RSL, respectively. The RSL comparison plot of 3D GIA model ANU-ICE (HetML140) and RSL data at 13 regions are shown in Fig. S1.
Fig. 3
Fig. 3
Summary of the late Holocene relative sea-level (RSL) misfit formula image-statistic. (A) Late Holocene RSL misfit formula image-statistic with the two glacial isostatic adjustment models ICE-6G_C (HetML140) and ANU-ICE (HetML140) at 13 regions along the Atlantic coast of Europe. (B) The inset shows the derived vertical land motion (VLM) rate of − 0.88 ± 0.03 mm/yr via linear regression using late Holocene RSL residuals with ICE-6G_C model at region 8 and considering the geoid contribution from ICE-6G_C (HetML140) as uncertainty in VLM rate derivation. The shaded boxes in the inset indicate the upper and lower bounds of the RSL residual. The misfit formula image-statistics after late Holocene RSL data correction of a VLM rate of − 0.88 ± 0.03 mm/yr at region 8 are indicated by bars with dashed outlines. After the VLM correction, the misfit formula image-statistics for ICE-6G_C at region 8 (Oka estuary) declined by ~ 80% from 4.7 to 0.9.
Fig. 4
Fig. 4
Estimated vertical land motion (VLM) rates from instrumental records and VLM rate used in IPCC AR6 projections. (A) The Global Satellite Navigation Systems (GNSS) vertical positions at SOPU station produced by the Nevada Geodetic Laboratory and the derived linear rate and its associated uncertainty (1σ) of − 0.85 ± 0.14 mm/yr. (B) The calculated VLM from differencing satellite altimetric sea-level anomalies and tide gauge records at Bilbao tide gauge station, and the derived VLM rate and its associated uncertainty (1σ) of − 0.80 ± 0.32 mm/yr. For more details see the text. (C) Comparison of the VLM rates of − 0.88 ± 0.03 mm/yr derived from late Holocene RSL data (red solid line with pink envelope, Fig. 3 inset), GNSS data, differenced altimetry-tide gauge data and VLM rate used in IPCC AR6. The blue bars with black lines indicate the derived VLM rates with 1σ uncertainties. The grey-dashed line indicates the 0 value line.
Fig. 5
Fig. 5
Comparison of projections of relative sea-level (RSL) rise from the Spanish National Climate Change Adaptation Plan (NCCAP) and IPCC AR6. Projected likely (17–83rd percentiles) and very likely (5–95th percentiles) RSL rise from the NCCAP under RCP4.5 and RCP8.5 scenarios by 2026–2045 and by 2081–2100, compared with the IPCC AR6 sea-level projections under SSP2-4.5 and SSP5-8.5 scenarios by (A) 2035 and (B) 2090, respectively. The IPCC AR6 projections with the updated VLM rate of − 0.88 ± 0.03 mm/yr are also presented. The difference in the projected magnitude of sea-level rise (50th percentile value) are summarized in Table 2. We have standardized the Spanish NCCAP projection to the same baseline as IPCC AR6 of 1995–2014 following ref..

References

    1. Neumann, B., Vafeidis, A. T., Zimmermann, J. & Nicholls, R. J. Future coastal population growth and exposure to sea-level rise and coastal flooding-a global assessment. PLoS ONE10, e0118571 (2015). - PMC - PubMed
    1. Hauer, M. E. et al. Sea-level rise and human migration. Nat. Rev. Earth Environ.1, 28–39 (2020).
    1. Fox-Kemper, B. et al. Ocean, cryosphere, and sea level change. In Climate Change 2021: The Physical Science Basis. Contribution of Working Group I to the Sixth Assessment Report of the Intergovernmental Panel on Climate Change 1211–1361 (Cambridge University Press, 2021).
    1. Kulp, S. A. & Strauss, B. H. New elevation data triple estimates of global vulnerability to sea-level rise and coastal flooding. Nat. Commun.10, 1–12 (2019). - PMC - PubMed
    1. Hinkel, J. et al. Coastal flood damage and adaptation costs under 21st century sea-level rise. Proc. Natl. Acad. Sci.111, 3292–3297 (2014). - PMC - PubMed

LinkOut - more resources