

Synthetic polarization-sensitive optical coherence tomography using contrastive unpaired translation
- PMID: 39733058
- PMCID: PMC11682212
- DOI: 10.1038/s41598-024-82839-0
Synthetic polarization-sensitive optical coherence tomography using contrastive unpaired translation
Abstract
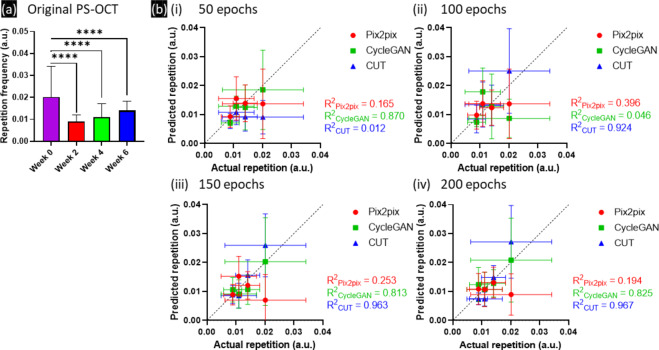
Polarization-sensitive optical coherence tomography (PS-OCT) measures the polarization state of backscattered light from tissues and provides valuable insights into the birefringence properties of biological tissues. Contrastive unpaired translation (CUT) was used in this study to generate a synthetic PS-OCT image from a single OCT image. The challenges related to extensive data requirements relying on labeled datasets using only pixel-wise correlations that make it difficult to efficiently regenerate the periodic patterns observed in PS-OCT images were addressed. The CUT model captures birefringence patterns by leveraging patch-wise correlations from unpaired data, which allows learning of the underlying structural features of biological tissues responsible for birefringence. To demonstrate the performance of the proposed approach, three generative models (Pix2pix, CycleGAN, and CUT) were compared on an in vivo dataset of injured mouse tendons over a six-week healing period. CUT outperformed Pix2pix and CycleGAN by producing high-fidelity synthetic PS-OCT images that closely matched the original PS-OCT images. Pearson correlation and two-way ANOVA tests confirmed the superior performance of CUT (p-value < 0.0001) over the comparison models. Additionally, a ResNet-152 classification model was used to assess tissue damage, which achieved an accuracy of up to 90.13% compared to the original PS-OCT images. This research demonstrates that CUT is superior to conventional methods for generating high-quality synthetic PS-OCT images and offers better improvements in most scenarios, in terms of efficiency and image fidelity.
© 2024. The Author(s).
Conflict of interest statement
Declarations. Ethics Statement: The authors confirm that all methods are based on relevant guidelines and regulations, and that research has been conducted in accordance with the guidelines of ARRIVE. ( https://arriveguidelines.org ). Competing interests: The authors declare no competing interests.
Figures


Similar articles
-
Determination of characteristics of degenerative joint disease using optical coherence tomography and polarization sensitive optical coherence tomography.Lasers Surg Med. 2006 Oct;38(9):852-65. doi: 10.1002/lsm.20394. Lasers Surg Med. 2006. PMID: 16998913
-
En face parametric imaging of tissue birefringence using polarization-sensitive optical coherence tomography.J Biomed Opt. 2013 Jun;18(6):066005. doi: 10.1117/1.JBO.18.6.066005. J Biomed Opt. 2013. PMID: 23733021
-
Polarization-sensitive optical coherence tomography imaging of the anterior mouse eye.J Biomed Opt. 2018 Aug;23(8):1-12. doi: 10.1117/1.JBO.23.8.086005. J Biomed Opt. 2018. PMID: 30168301
-
Characterizing of tissue microstructure with single-detector polarization-sensitive optical coherence tomography.Appl Opt. 2006 Jun 20;45(18):4464-79. doi: 10.1364/ao.45.004464. Appl Opt. 2006. PMID: 16778957
-
Review of polarization sensitive optical coherence tomography and Stokes vector determination.J Biomed Opt. 2002 Jul;7(3):359-71. doi: 10.1117/1.1483879. J Biomed Opt. 2002. PMID: 12175285 Review.
Cited by
-
A comprehensive review of high-performance photoacoustic microscopy systems.Photoacoustics. 2025 Jun 4;44:100739. doi: 10.1016/j.pacs.2025.100739. eCollection 2025 Aug. Photoacoustics. 2025. PMID: 40528993 Free PMC article. Review.
-
Evaluation of retinal pigment epithelium changes in serous pigment epithelial detachment using synthesized multi-contrast polarization-sensitive optical coherence tomography.Sci Rep. 2025 Jul 7;15(1):24304. doi: 10.1038/s41598-025-09302-6. Sci Rep. 2025. PMID: 40624086 Free PMC article.
References
-
- Schmitt, J. M. Optical coherence tomography (OCT): a review. IEEE J. Sel. Top. Quantum Electron.5, 1205–1215 (1999).
-
- Everett, M., Magazzeni, S., Schmoll, T. & Kempe, M. Optical coherence tomography: from technology to applications in ophthalmology. Translational Biophotonics. 3, e202000012 (2021).
-
- Wan, B. et al. Applications and future directions for optical coherence tomography in dermatology. Br. J. Dermatol.184, 1014–1022 (2021). - PubMed
-
- Matthews, T. J. & Adamson, R. Optical coherence tomography: current and future clinical applications in otology. Curr. Opin. Otolaryngol. Head Neck Surg.28, 296 (2020). - PubMed
Publication types
MeSH terms
Grants and funding
LinkOut - more resources
Full Text Sources
