. 2024 Dec 28;14(1):31337.
doi: 10.1038/s41598-024-82808-7.

Serum lipid profiling reveals characteristic lipid signatures associated with stroke in patients with leukoaraiosis

Affiliations

Serum lipid profiling reveals characteristic lipid signatures associated with stroke in patients with leukoaraiosis

Feng Lin et al. Sci Rep. .

Abstract

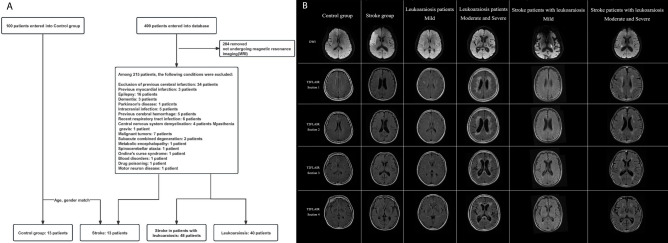
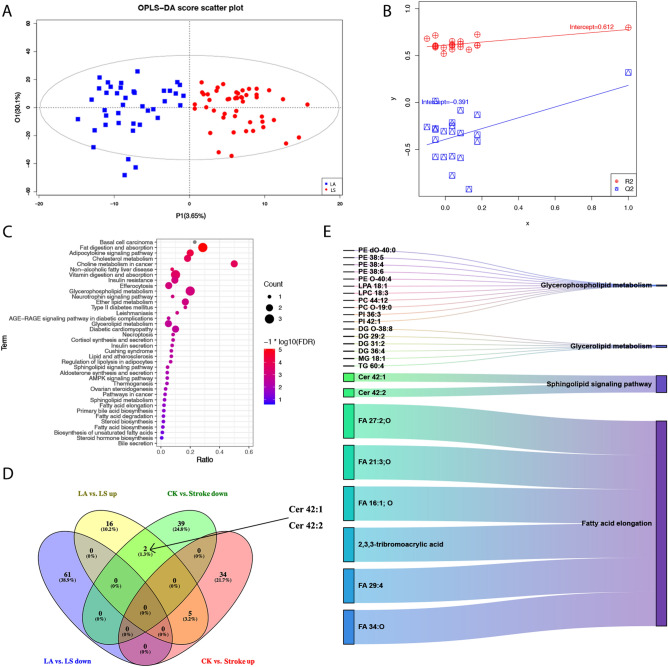
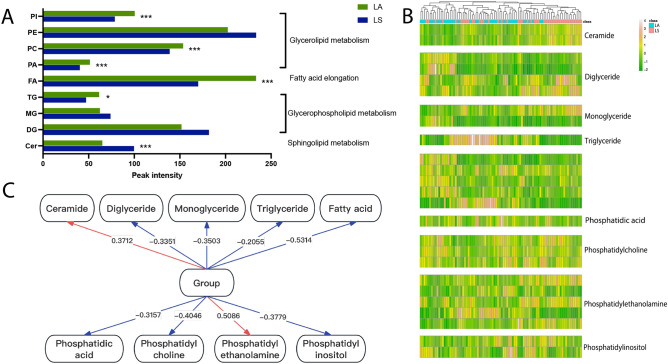
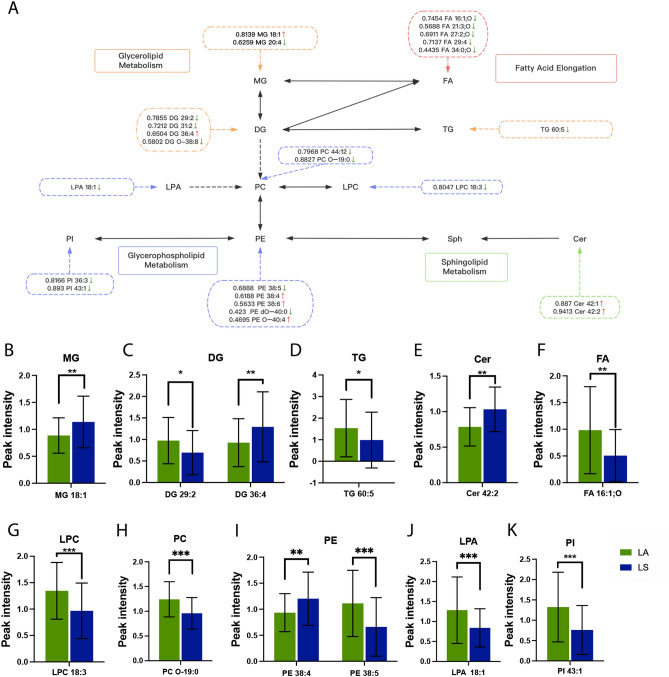
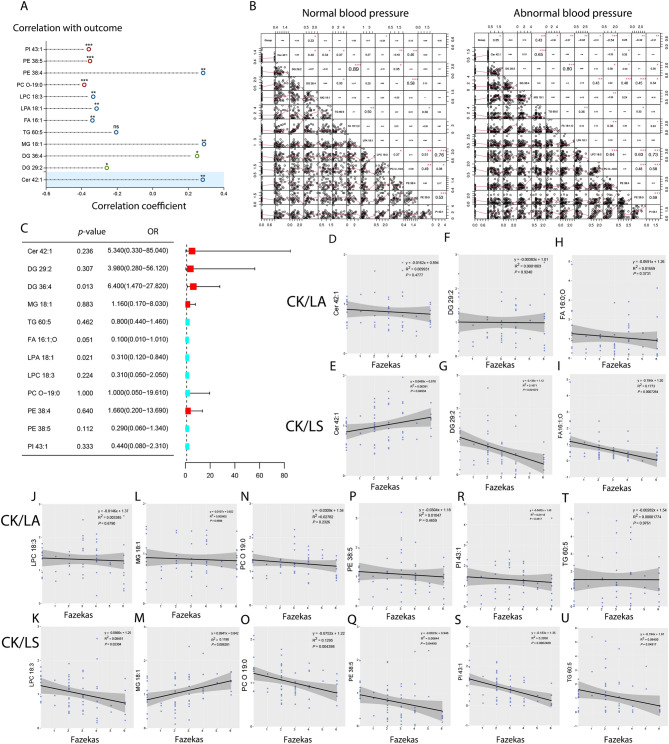
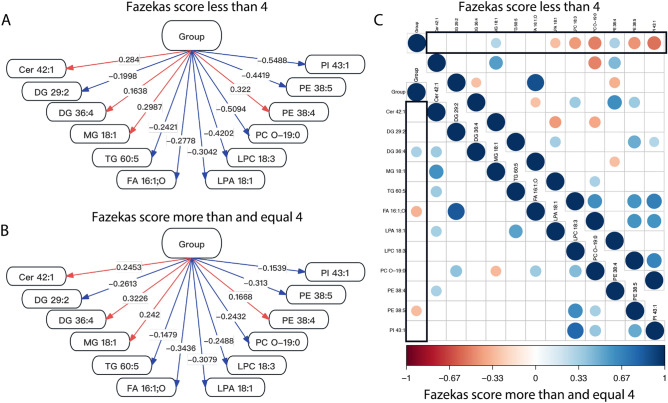
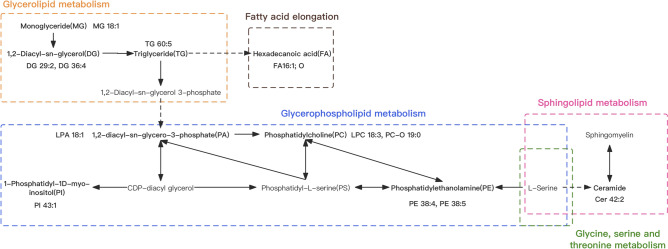
Many lipid biomarkers of stroke have been identified, but the lipid metabolism in elderly patients with leukoaraiosis remains poorly understood. This study aims to explore lipid metabolic processes in stroke among leukoaraiosis patients, which could provide valuable insights for guiding future antithrombotic therapy. In a cohort of 215 individuals undergoing MRI, 13 stroke patients were matched with controls, and 48 stroke patients with leukoaraiosis were matched with 40 leukoaraiosis patients. Serum lipidomics was profiled using UPLC-TOF, and OPLS-DA was applied for metabolite identification. Partial Least Squares Path Model (PLS-PM) assessed pathway weights of novel metabolites in stroke risk, while linear regression explored correlations with clinical outcomes. Lipid profiling identified 168 distinct compounds. From these, 25 lipid molecules were associated with glycerolipid, glycerophospholipid, and sphingolipid metabolism. PLS-PM identified 12 key metabolites, including DG 36:4 (OR = 6.40) as a significant risk factor. Metabolites such as PE 38:5 and FA 16:1;O showed significant correlations with stroke in leukoaraiosis, particularly when the Fazekas score was ≥ 4. Twelve metabolites were identified as key factors in stroke incidence among leukoaraiosis patients. Lipid disturbances in glycerolipids and glycerophospholipids provide valuable insights for further studies on the progression from leukoaraiosis to stroke.

Keywords: Leukoaraiosis; Lipidomics; Metabolic pathway; Plasma; Stroke.


Conflict of interest statement

Declarations. Competing interests: The authors declare that the research was conducted in the absence of any commercial or financial relationships that could be construed as a potential conflict of interest. Ethics approval and consent to participate: This study was reviewed and approved by the Ethics Committee of the Sanming First Hospital Affiliated with Fujian Medical University (Ethics Approval Number: 2022–44). The participants provided written informed consent to participate in this study. Consent for publication: Before participating in the study, all participants signed up with informed permission.

Figures

Fig. 1
Fig. 1
(A) Flowchart for the recruitment processes of study subjects in a study on Chinese stroke patients with leukoaraiosis. (B) Stroke definition on DWI; Leukoaraiosis definition and heterogeneous forms on FLAIR-MRI.
Fig. 2
Fig. 2
Alterations in lipid molecules between leukoaraiosis patients and stroke patients with leukoaraiosis as well as between Control and Stroke group. (A) OPLS-DA score scatter plot between leukoaraiosis patients and stroke patients with leukoaraiosis; p1 means covariance of projection-based OPLS-DA model and pcorr1 means correlation of projection-based OPLS-DA model. (B) Permutation test between leukoaraiosis patients and stroke patients with leukoaraiosis. (C) KEGG enrichment analysis of leukoaraiosis patients and stroke patients with leukoaraiosis. Scatter plots present the enriched metabolic pathways. (D) Venn Analysis: Comparing similarities and differences in lipid molecules among groups. Control vs. Stroke down or up means that lipid molecules exhibit a significant decrease or increase in Stroke compared to Control group. leukoaraiosis patients vs. stroke patients with leukoaraiosis down or up means lipid molecules exhibit a significant decrease or increase in stroke patients with leukoaraiosis compared to leukoaraiosis patients. (E) Sankey Diagram concentrating lipid molecules to metabolic pathways.
Fig. 3
Fig. 3
Alternations in lipid classification between leukoaraiosis and stroke patients with leukoaraiosis groups. (A) Lipid skeleton alteration between leukoaraiosis patients and stroke patients with leukoaraiosis. (B) Cluster heat map of changed lipids between leukoaraiosis patients and stroke patients with leukoaraiosis. (C) Customizing structural equation analysis of lipid classifications for the outcome (“Group” in the middle) of leukoaraiosis patients or stroke patients with leukoaraiosis. *p < .05; **p < .01; ***p < .001.
Fig. 4
Fig. 4
Screening for the key metabolites for stroke patients with leukoaraiosis. (A) Diagram showing the weights of node molecules in pathway enriched by changed metabolites between leukoaraiosis patients and stroke patients with leukoaraiosis. (BK) The corresponding key metabolites in stroke patients with leukoaraiosis compared to the leukoaraiosis patients.
Fig. 5
Fig. 5
Correlation of 12 key metabolites with the outcomes. (A) Correlation analysis of DG 29:2; DG 36:4; MG 18:1; TG 60:5; FA 16:1;O; LPC 18:3; PC O-19:0; PE 38:4; PE 28:5 LPA 18:1; PI 43:1 and Cer 42:2 with the outcome. (B) Correlation analysis of key metabolites with the outcome under normal or abnormal blood pressure condition. The lower part of the graph represents the scatter plot showing the changes between variables. The numerical values in the upper part display the magnitude of the correlations. The higher the correlation, the larger the “numerical shape”. The significance is indicated by asterisks, with one asterisk (*) denoting a value less than 0.05, two asterisks (**) denoting a value less than 0.01, and three asterisks (***) denoting a value less than 0.001. (C) Multivariable regression analysis for the outcome of stroke with leukoaraiosis incidence using odds ratios with 95% confidence intervals (CIs) and p-values. (DU) Linear regression was performed for 12 key metabolites and Fazekas score between Control + leukoaraiosis groups (Control/leukoaraiosis) and Control + stroke patients with leukoaraiosis (Control/stroke patients with leukoaraiosis).
Fig. 6
Fig. 6
Key metabolites for stroke patients with leukoaraiosis in subgroups divided by Fazekas Score. (AB) Customizing structural equation analysis for the outcomes under Fazekas score less than 4 or more than and equal to 4 conditions. (C) Correlation analysis of key metabolites under Fazekas score less than 4 (upper) or more than and equal to 4 (lower) conditions.
Fig. 7
Fig. 7
The metabolic processes involved in the 12 key metabolites associated with stroke in patients with leukoaraiosis. The 12 key metabolites were indicated in bold.

Similar articles

References

    1. Tang, X. et al. Leukoaraiosis and acute ischemic stroke. Eur. J. Neurosci.54, 6202–6213 (2021). - PubMed
    1. Arsava, E. M. et al. Severity of leukoaraiosis correlates with clinical outcome after ischemic stroke. Neurology72, 1403–1410 (2009). - PMC - PubMed
    1. Curtze, S. et al. Cerebral computed tomography-graded white matter lesions are associated with worse outcome after thrombolysis in patients with stroke. Stroke46, 1554–1560 (2015). - PubMed
    1. Epstein, A. et al. Chronic covert brain infarctions and white matter hyperintensities in patients with stroke, transient ischemic attack, and stroke mimic. J. Am. Heart Assoc.11, e024191 (2022). - PMC - PubMed
    1. Ryu, W. S. et al. Grading and interpretation of white matter hyperintensities using statistical maps. Stroke45, 3567–3575 (2014). - PubMed

Publication types

LinkOut - more resources