

Genome-wide association mapping in safflower (Carthamus tinctorius L.) for genetic dissection of drought tolerance using DArTseq markers
- PMID: 39733113
- PMCID: PMC11682058
- DOI: 10.1038/s41598-024-82932-4
Genome-wide association mapping in safflower (Carthamus tinctorius L.) for genetic dissection of drought tolerance using DArTseq markers
Abstract
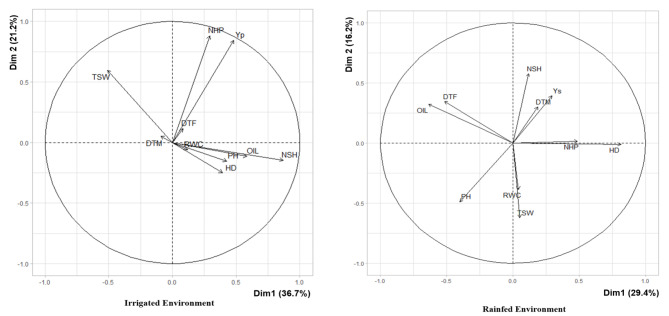
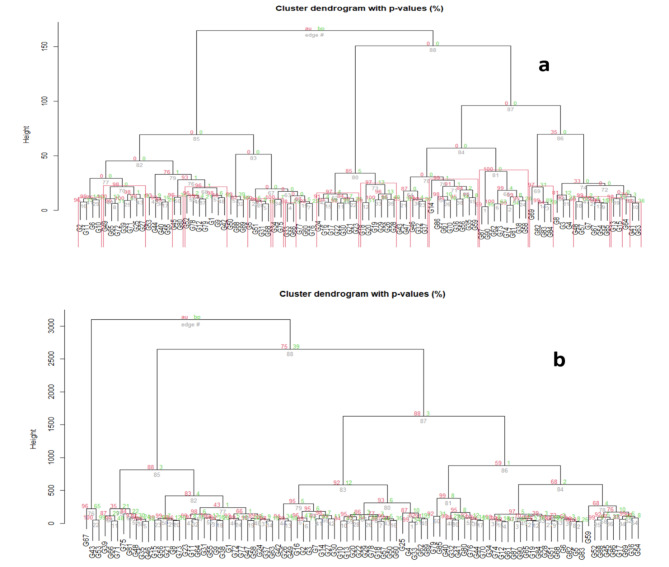
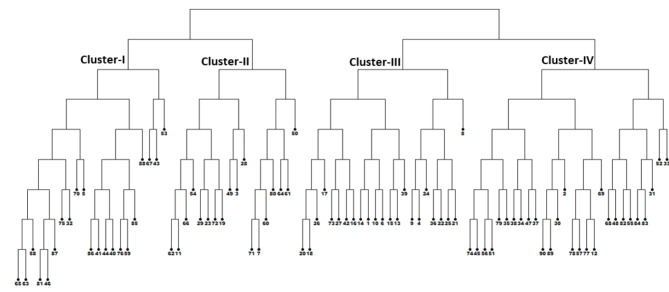
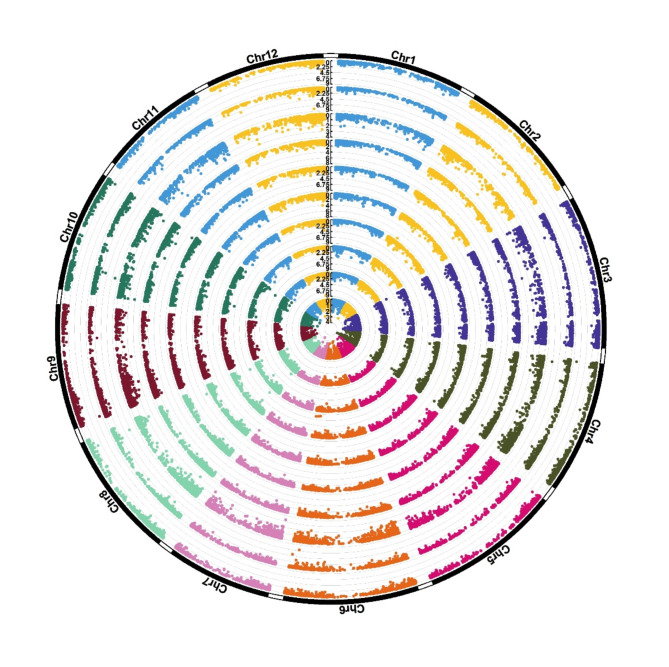
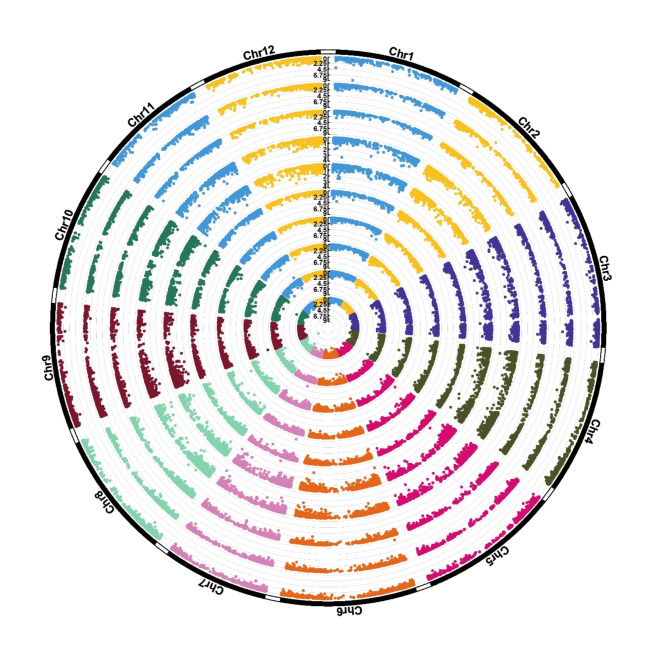
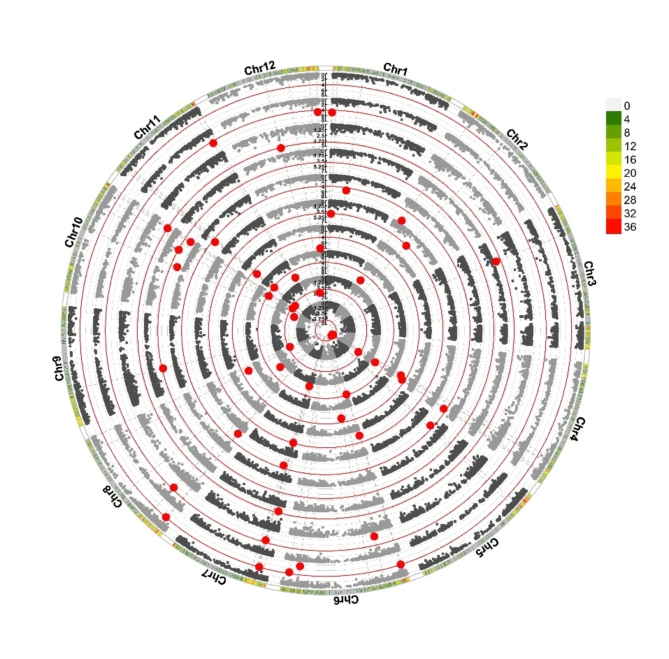
Understanding the genetic basis of drought tolerance in safflower (Carthamus tinctorius L.) is essential for developing resilient varieties. In this study, we performed a genome-wide association study (GWAS) using DArTseq markers to identify marker-trait associations (MTAs) linked to drought tolerance across 90 globally diverse safflower genotypes. These genotypes were evaluated under both rainfed (drought) and irrigated conditions over three consecutive years (2016-2018). Significant variation in seed yield and morphological traits was observed between genotypes and across environments, with notably reduced performance under rainfed conditions. A total of 66 MTAs were identified for key agronomic traits, including seed yield, 1000-seed weight, number of heads per plant, and days to maturity, with 45 MTAs showing significant associations with the stress-tolerance index (STI). Twelve MTAs were consistently detected across both stress and non-stress conditions, suggesting stable loci for breeding applications. BLAST searches indicated that several identified markers corresponded to genes involved in abiotic stress response, including biotin carboxylase, serine/threonine-protein kinase, and zinc finger domain proteins. The clustering of genotypes based on drought-tolerance coefficient (DC) and STI values grouped genotypes into drought-susceptible and drought-tolerant categories, with no strong correlation to geographic origin. These findings provide valuable insights into the genetic architecture of drought tolerance in safflower and highlight candidate loci for marker-assisted selection, supporting the development of drought-resilient varieties.
Keywords: DArTseq; Drought; GWAS; Safflower.
© 2024. The Author(s).
Conflict of interest statement
Declarations. Competing interests: The authors declare no competing interests. Ethics approval and consent to participate: All the plant materials provided by Iranian Seed and Plant Improvement Institute (SPII) and Dryland Agricultural Research Institute (DARI) that were in compliance with relevant institutional, national, and international guidelines and legislation.
Figures


Similar articles
-
In-depth genome diversity, population structure and linkage disequilibrium analysis of worldwide diverse safflower (Carthamus tinctorius L.) accessions using NGS data generated by DArTseq technology.Mol Biol Rep. 2020 Mar;47(3):2123-2135. doi: 10.1007/s11033-020-05312-x. Epub 2020 Feb 15. Mol Biol Rep. 2020. PMID: 32062796
-
Genome-wide identification, characterization and expression analysis of WRKY transcription factors under abiotic stresses in Carthamus tinctorius L.BMC Plant Biol. 2025 Jan 21;25(1):81. doi: 10.1186/s12870-025-06079-8. BMC Plant Biol. 2025. PMID: 39838282 Free PMC article.
-
High-throughput phenotyping to dissect genotypic differences in safflower for drought tolerance.PLoS One. 2021 Jul 23;16(7):e0254908. doi: 10.1371/journal.pone.0254908. eCollection 2021. PLoS One. 2021. PMID: 34297757 Free PMC article.
-
Exploring genomic loci and candidate genes associated with drought tolerance indices in spring wheat evaluated under two levels of drought.BMC Plant Biol. 2025 Apr 1;25(1):408. doi: 10.1186/s12870-025-06413-0. BMC Plant Biol. 2025. PMID: 40165081 Free PMC article.
-
Genetic, molecular and physiological crosstalk during drought tolerance in maize (Zea mays): pathways to resilient agriculture.Planta. 2024 Aug 28;260(4):81. doi: 10.1007/s00425-024-04517-9. Planta. 2024. PMID: 39196449 Review.
References
-
- Talebi, R., Nosrati, S., Etminan, A. & Naji, A. M. Genetic diversity and population structure analysis of landrace and improved safflower (Cartamus tinctorious L.) germplasm using arbitrary functional gene-based molecular markers. Biotechnol. Biotechnol. Equip.32, 1183–1194 (2018).
-
- Talebi, R. & Abhari, S. A. Evaluation of genetic diversity in safflower (Carthamus tinctorius L.) using agro-morphological, fatty acid composition and ISSR molecular markers. Res. J. Biotechnol.11(7), 19–27 (2016).
-
- Hassani, S. M. R., Talebi, R., Pourdad, S. S., Naji, A. M. & Fayaz, F. Morphological description, genetic diversity and population structure of safflower (Carthamus tinctorius L.) mini core collection using SRAP and SSR markers. Biotechnol. Biotechnol. Equip.34, 1043–1055 (2020).
MeSH terms
Substances
LinkOut - more resources
Full Text Sources
Research Materials
