

Metabolic profiling reveals altered amino acid and fatty acid metabolism in children with Williams Syndrome
- PMID: 39733135
- PMCID: PMC11682280
- DOI: 10.1038/s41598-024-83146-4
Metabolic profiling reveals altered amino acid and fatty acid metabolism in children with Williams Syndrome
Abstract
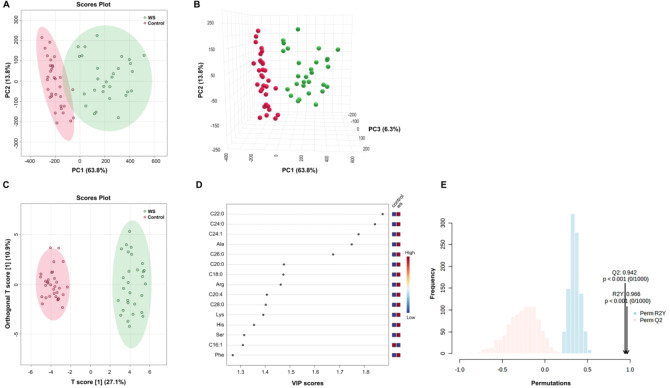
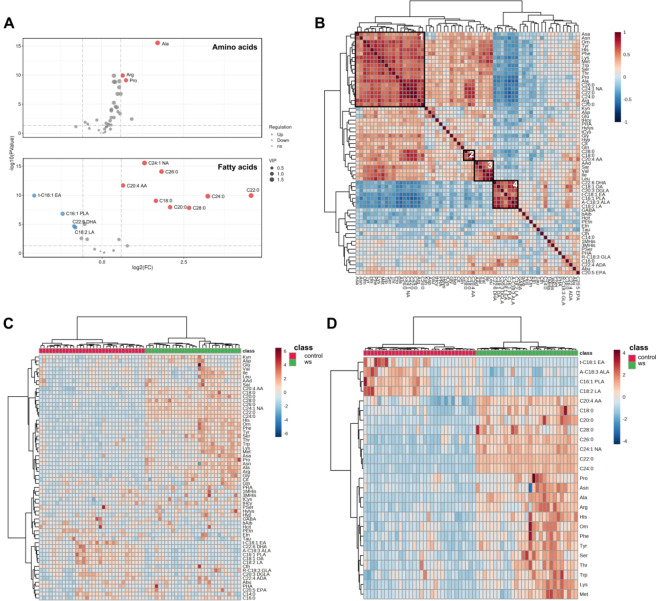
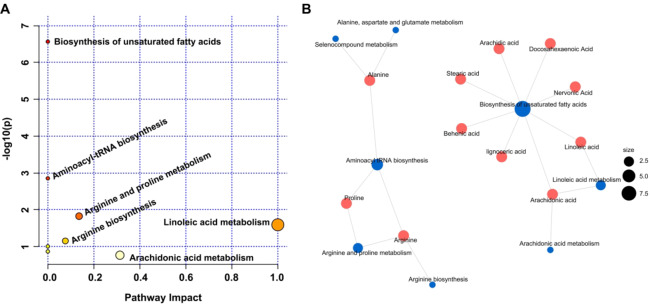
Williams Syndrome (WS) is a rare neurodevelopmental disorder with a prevalence of 1 in 7500 to 1 in 20,000 individuals, caused by a microdeletion in chromosome 7q11.23. Despite its distinctive clinical features, the underlying metabolic alterations remain largely unexplored. This study employs targeted metabolomics to investigate the metabolic characteristics of children with WS. Using liquid chromatography-tandem mass spectrometry (LC-MS/MS), we identified significant dysregulation of 15 metabolites, with 11 upregulated and 4 downregulated. Notably, amino acids such as alanine, proline, and arginine were significantly elevated. Fatty acid metabolism showed pronounced upregulation of long-chain saturated fatty acids (C18:0, C20:0, C22:0, C24:0, C26:0, and C28:0) and downregulation of long-chain unsaturated fatty acids (C18:2 LA, C22:6 DHA, C16:1 PLA, and t-C18:1 EA), except for upregulated nervonic acid (C24:1) and arachidonic acid (C20:4). Metabolic pathway analysis highlighted disruptions in arginine synthesis, arginine/proline metabolism, alanine, aspartate and glutamate metabolism, biosynthesis of unsaturated fatty acids, linoleic acid metabolism, and arachidonic acid metabolism. This study provides the first comprehensive analysis of amino acid and fatty acid metabolism in children with WS, offering insights into the disorder's complex metabolic landscape. Further validation in larger cohorts is essential to confirm these findings and their potential as biomarkers and therapeutic targets.
Keywords: Amino acids; Arachidonic acid (ARA); Docosahexaenoic acid (DHA); Long-chain saturated fatty acids (LC-SFAs); Targeted metabolomics; Williams Syndrome.
© 2024. The Author(s).
Conflict of interest statement
Competing interests: The authors declare no competing interests. Institutional Review Board Statement: The study was conducted in accordance with the Dec-laration of Helsinki, and approved by the Ethics Committee of the Children’s Hospital Affiliated to Zhejiang University School of Medicine (NO. 2019-IBR-122) on 13 July 2020. Informed Consent: Informed consent was obtained from all subjects involved in the study.
Figures
References
-
- Morris, C. A. et al. GeneReviews((R)) (eds M (P. Adam, 1993).
-
- Wilson, M. & Carter, I. B. in StatPearls (2023).
MeSH terms
Substances
LinkOut - more resources
Full Text Sources
