. 2024 Dec 28;14(1):31450.
doi: 10.1038/s41598-024-82985-5.

Identification and validation of up-regulated TNFAIP6 in osteoarthritis with type 2 diabetes mellitus

Affiliations

Identification and validation of up-regulated TNFAIP6 in osteoarthritis with type 2 diabetes mellitus

Siyi Liu et al. Sci Rep. .

Abstract

Lines of evidence have indicated that type 2 diabetes mellitus (T2DM) is an independent risk factor for osteoarthritis (OA) progression. However, the study focused on the relationship between T2DM and OA at the transcriptional level remains empty. We downloaded OA- and T2DM-related bulk RNA-sequencing and single-cell RNA sequencing data from the Gene Expression Omnibus (GEO) dataset. Differential expression analysis and weighted gene co-expression network analysis (WGCNA) were performed to screen out hub genes between OA and T2DM, and functional enrichment was done. Single-cell sequencing analysis was further used to screen key genes on OA and T2DM datasets. Rat chondrocytes and human articular cartilage were used to validate biomarkers among OA and T2DM. Sixty-eight hub genes were obtained, which were mainly enriched in the inflammatory response. We found that the hub gene TNFAIP6 is not only closely related to OA and T2DM but also a marker of prehypertrophic chondrocytes, which are closely related to the progression of OA. TNFAIP6 was found to be significantly elevated in CD14 + monocytes in T2DM patients, and this group of cells can promote inflammation. Validation on rat chondrocytes and human cartilage showed that TNFAIP6 was highly expressed in OA and further increased in the presence of T2DM or high glucose. Our study identified several characteristic modules and hub genes in the pathogenesis of T2DM-induced OA, which may facilitate further investigation of its molecular mechanisms. Up-regulated TNFAIP6 may contribute to OA in patients with T2DM by the recruitment of pro-inflammatory CD14 + monocytes in the OA synovium, which provides a potential target for the diagnosis and treatment of T2DM-associated OA.

Keywords: Bioinformatics; Osteoarthritis; Single-cell RNA sequencing; Type 2 diabetes mellitus; Weighted gene co-expression network analysis.


Conflict of interest statement

Declarations. Competing interests: The authors declare no competing interests. Ethics statement: All animal procedures were conducted according to the Guidelines for Care and Use of Laboratory Animals of the National Institutes of Health and approved by the Experimental Animal Welfare Ethics Committee, Zhongnan Hospital of Wuhan University (ZN2022191). The studies involving human specimens were reviewed and approved by the Medical Ethics Committee, Zhongnan Hospital of Wuhan University (2022151 K). The authors ensured that all participants were given the necessary information and signed informed consent forms before proceeding with the study.

Figures

Fig. 1
Fig. 1
Schematic representation of the present study.
Fig. 2
Fig. 2
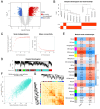
Differential expression analysis and weighted gene co-expression network analysis (WGCNA) on the type 2 diabetes mellitus (T2DM) bulk RNA-sequencing data. (A) The volcano plot of differentially expressed genes (DEGs) in the T2DM matrix. DEGs with |log2FoldChange| > 1 are labeled red or blue. (B) The sample dendrogram and trait heatmap on the T2DM matrix. (C) Determination of the soft threshold. (D) Cluster dendrogram utilized to detect coexpression clusters with corresponding color assignments. Gene clusters in different colors stand for different coexpression modules, and genes that are not co-expressed in any modules are assigned to the gray module. (E) Correlation matrix of module eigengene values obtained from WGCNA. Twenty modules were identified, and each module eigengene was tested for correlation with a trait. Within each cell, upper values are correlation coefficients between module eigengene and the traits; lower values are the corresponding P value. (F) Scatter plot of gene significance (GS) and module membership (MM) in the turquoise module. Key genes were screened out in the upper-right area where |GS| >0.2 and |MM| >0.8. (G) The heatmap depicts the topological overlap matrix (TOM) among all modules included in the analysis. The light color represents a low overlap, and the progressively darker red color represents an increasing overlap.
Fig. 3
Fig. 3
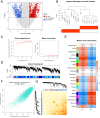
Identification of differentially expressed genes (DEGs) and construction of weighted gene co-expression network analysis (WGCNA) on osteoarthritis (OA) bulk RNA-sequencing data. (A) The volcano plot of DEGs in the OA matrix. (B) Clustering dendrogram of samples based on their Euclidean distance. (C) Determination of the soft-threshold power. (D) Cluster dendrogram of genes, with dissimilarity based on topological overlap, together with assigned module colors. (E) Module–trait associations. Each row corresponds to a module, and each column corresponds to a trait. Each cell contains the corresponding correlation and P value. (F) Scatter plot analysis of the turquoise module. (G) The heatmap depicts the topological overlap matrix (TOM) among all modules included in the analysis.
Fig. 4
Fig. 4
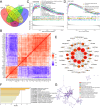
Gene set enrichment analysis (GSEA) of type 2 diabetes mellitus (T2DM) and osteoarthritis (OA) bulk RNA-sequencing data and correlation and functional enrichment of hub genes. (A) The Venn plot showed the identification of intersection genes. (B) Pearson correlation analysis of hub genes in OA matrix. (C, D) GSEA analysis of (C) T2DM and (D) OA matrix. (E) Visualization of PPI network of hub genes. (F) Gene Ontology (GO) and Kyoto Encyclopedia of Genes and Genomes (KEGG) enrichment of hub genes using Metascape. (G) Gene enrichment clusters and nodes colored by cluster ID.
Fig. 5
Fig. 5
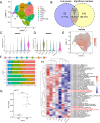
Analysis of osteoarthritis (OA) single-cell RNA sequencing data. (A) Eight clusters were annotated and labeled with different colors. (B) The Venn plot showed the intersection of hub genes and significant markers in osteoarthritis (OA) single-cell RNA sequencing data. (C) Violin plots showing the expression levels of TNFAIP6 grouped by samples. (D) Violin plot and (E) dim plot showing the expression of TNFAIP6 in each cell cluster. (F) Stacked Column Chart showing the ratio of each cell cluster grouped by samples. (G) Scatter plot showing the ratio of prehypertrophic chondrocytes between osteoarthritis and control samples (P = 0.011). (H) Heatmap showing the result of gene set variation analysis (GSVA) in each cell cluster.
Fig. 6
Fig. 6
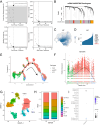
High dimensional weighted gene co-expression network analysis and pseudotime analysis in osteoarthritis (OA) single-cell RNA sequencing data and analysis of single-cell RNA sequencing data on type 2 diabetes mellitus peripheral blood mononuclear cells (PBMCs). (A) Optimal soft threshold selection. (B) Construction of co-expression network using the optimal soft threshold of 9, with genes divided into 7 modules and resulting in a dendrogram. (C) UMAP plot of module 7 with ME staining. (D) KMes for module 7 characterization gene. (E) Monocle pseudotime trajectory showing the progression of Proliferative chondrocytes, prehypertrophic chondrocytes, and hypertrophic chondrocytes. (F) Pseudotemporal expression dynamics showing the expression level of TNFAIP6. (G) UMAP plot of 10 subpopulations in PBMC samples. (H) Stacked Column Chart showing the ratio of each cell cluster grouped by diseases. (I) Dot plot showing the expression of TNFAIP6 in each cell cluster.
Fig. 7
Fig. 7
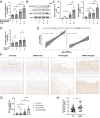
Validation of TNFAIP6 expression level in rat chondrocytes and human articular cartilage, and IL6 levels in osteoarthritis (OA) and combined type 2 diabetes mellitus and osteoarthritis (DMOA) patients. (A) Induction of TNFAIP6 with normal glucose (5.5 mM) and high glucose (25 mM) in rat chondrocytes treated with or without IL-1β (5 ng/mL) at 72 h. Quantitative RT-PCR (qRT-PCR) analysis of mRNA levels of TNFAIP6, IL6, and MMP13 relative to that of β-actin (n = 6). (B) Western blot was used to determine protein expression of TNFAIP6, IL6, and MMP13 (n = 3). (C) QRT-PCR was used to determine the mRNA expression of IL6 and MMP13 (n = 6). (D) Impact of osmotic stress on the expression of TNFAIP6 by rat chondrocytes with or without IL-1β stimulation. Cells were incubated with normal glucose (5.5 mM) or mannitol (19.5 mM) for 72 h. the mRNA level of TNFAIP6 was detected by qRT-PCR (n = 6). (E) Correlation of ΔCt (compared to β-actin) of TNFAIP6 with IL6 (R = 0.82, P = 7.6e-07) and MMP13 (R = 0.71, P = 0.00011) (n = 24). (F) The expression of TNFAIP6 in the articular cartilage shown in immunohistochemical staining (n = 6). (G) The mRNA expression of TNFAIP6 in human articular cartilage was detected using quantitative RT-PCR (n = 12). (H) Concentration of IL6 in serum in OA and DMOA patients. *P < 0.05, **P < 0.01, ***P < 0.001.

Similar articles

References

    1. David, J., Hunter, S. B. Z. & Osteoarthritis Lancet393, 1745–1759, doi:10.1016/S0140-6736(19)30417-9 (2019). - PubMed
    1. Lawrence, R. C. et al. Estimates of the prevalence of arthritis and other rheumatic conditions in the United States. Part II. Arthritis Rheum.58, 26–35. 10.1002/art.23176 (2008). - PMC - PubMed
    1. Visser, A. W. et al. The relative contribution of mechanical stress and systemic processes in different types of osteoarthritis: the NEO study. Ann. Rheum. Dis.74, 1842–1847. 10.1136/annrheumdis-2013-205012 (2015). - PubMed
    1. Xie, C., Chen, Q. & Adipokines New Therapeutic Target for Osteoarthritis? Curr. Rheumatol. Rep.21, 71. 10.1007/s11926-019-0868-z (2019). - PMC - PubMed
    1. Rehling, T., Bjorkman, A. D., Andersen, M. B., Ekholm, O. & Molsted, S. Diabetes Is Associated with Musculoskeletal Pain, Osteoarthritis, Osteoporosis, and Rheumatoid Arthritis. Journal of diabetes research 6324348, doi: (2019). 10.1155/2019/6324348 (2019). - PMC - PubMed

Publication types

MeSH terms