. 2024 Dec 28;14(1):31401.
doi: 10.1038/s41598-024-82939-x.

Imaging phenotype reveals that disulfirams induce protein insolubility in the mitochondrial matrix

Affiliations

Imaging phenotype reveals that disulfirams induce protein insolubility in the mitochondrial matrix

Ken Ohno et al. Sci Rep. .

Abstract

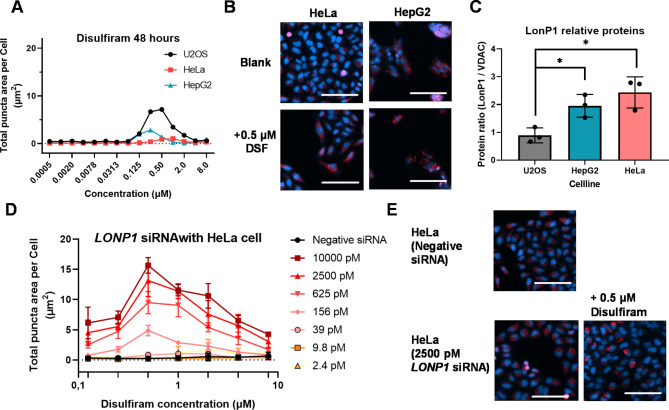
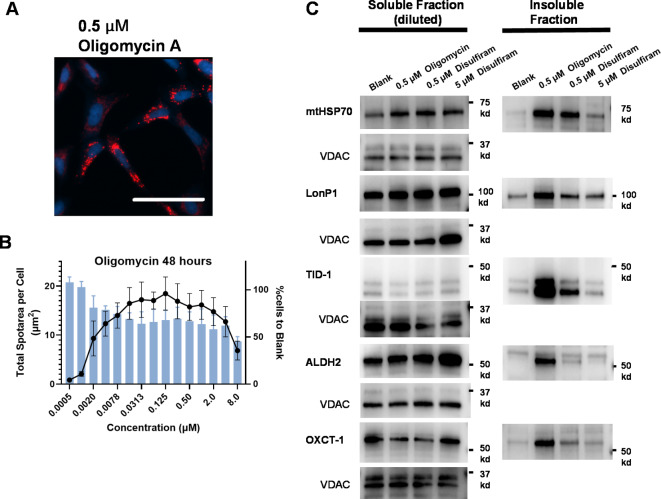
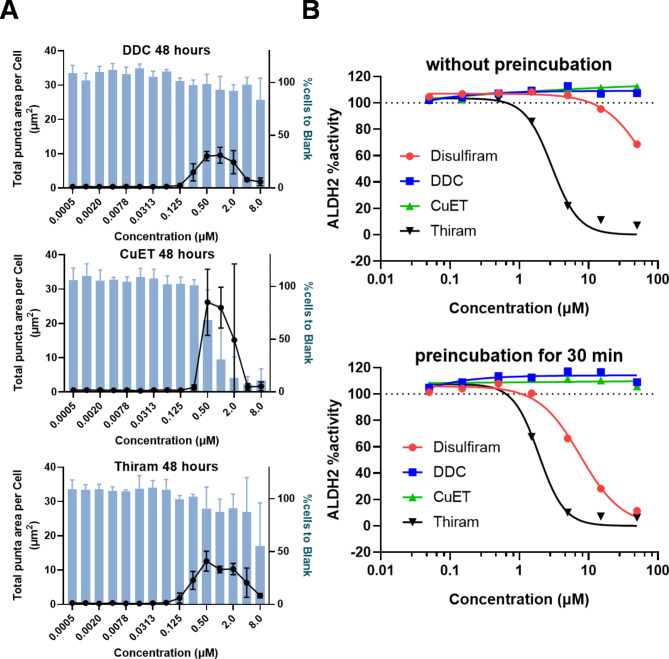
The cell painting assay is useful for understanding cellular phenotypic changes and drug effects. To identify other aspects of well-known chemicals, we screened 258 compounds with the cell painting assay and focused on a mitochondrial punctate phenotype seen with disulfiram. To elucidate the reason for this punctate phenotype, we looked for clues by examining staining steps and gene knockdown as well as examining protein solubility and comparing cell lines. From these results, we found that the punctate phenotype was caused by protein insolubility in the mitochondrial matrix. Interestingly, the punctate phenotype of disulfiram was sensitive to the relative expression of LonP1, a protease in the mitochondrial matrix that regulates proteostasis, suggesting that the punctate phenotype manifests when the protein quality control capacity in the mitochondrial matrix is exceeded. Moreover, we discovered that disulfiram and its derivatives, which have all been reported to increase acetaldehyde in the blood after the in vivo intake of alcohol, induced a punctate phenotype as well. The investigated punctate phenotype not only provides a novel clue for elucidating the common mechanism of action among disulfiram derivatives but is also a novel example of chemical perturbation of proteostasis in the mitochondrial matrix.

Keywords: Cell painting assay; Disulfiram; LonP1; Oligomycin A; Protein insolubility; Proteostasis.


Conflict of interest statement

Competing interests: The authors declare no competing interests.

Figures

Fig. 1
Fig. 1
Mitochondrial punctate phenotype with disulfiram. (A) Representative images of U2OS cells treated with disulfiram for 48 h, obtained by an ArrayScan XTi. Blue pseudocolor shows nuclear staining with Hoechst 33342 while red pseudocolor shows mitochondrial staining with MitoTracker Deep Red. To enhance the visualization of puncta in mitochondria, the image contrast was adjusted to reveal only puncta, and not the pale peripheral mitochondria. Scale bar is 100 μm. (B) Dose–response curve for the strength of the punctate phenotype and cell numbers. The total area of puncta per cell as the strength of the punctate phenotype is plotted with lines, and the residual percentage of cell numbers from nuclear staining is plotted with bars, from the well images (9 fields). Data are presented as the mean ± SD from triplicate experiments testing three replicate wells. The highest concentration was 8 µM with a 1 in 2 dilution. (C) Dose responses of the cell population with puncta on mitochondria staining were plotted as means ± SD at each concentration from triplicate experiments. Exposure time was 48 h. (D) Time dependencies of punctate accumulation were plotted as means from duplicated experiments. Treatment with 0.5 µM disulfiram was stained at 24–72 h exposure time. Solid lines indicate co-incubations, and dotted lines are the results from replacing the medium condition, which was washed with media twice at 48 h exposure, followed by further incubation for 24-h without compounds.
Fig. 2
Fig. 2
Image comparison of the punctate phenotype during staining steps and a similar phenotype from mitochondrial gene knockdown. (A) Representative image in grayscale with only MitoTracker channel from treatment with 0.5 µM disulfiram comparing before and after fixation and washing steps. The image on the left was taken just after MitoTracker Deep Red staining following HBSS wash. The image in the middle was taken from the same field but after permeabilization with 0.1% Triton X-100 and the second staining incubation with Hoechst and 0.1% BSA; identical exposure time and contrast as in the left image. The image on the right was taken from the same field after the fixation steps as in the middle image; the contrast is identical, but the exposure time is longer. Scale bar is 100 μm. (B) Evaluation of the punctate phenotype by siRNA knockdown of some genes located in mitochondrial matrix. After preculture for 24-h, cells were transfected with 5 nM of various siRNAs using Lipofectamine RNAiMAX. The blank condition is no treatment, and the positive control was cultured for 48 h with 0.5 µM disulfiram without any transfection. Bars are the mean ± SD of the total mitochondrial puncta area per cell from triplicate experiments testing 12 replicate wells. Statistical analysis was performed with one-way ANOVA followed by Dunnett’s test versus control groups. * means an adjusted p-value < 0.01. (C) Representative images of siRNA conditions with puncta. Blue shows nuclear staining with Hoechst 33342 while red shows mitochondrial staining with MitoTracker Deep Red. Scale bar is 100 μm. (D) Representative image of cells treated with CDDO (LonP1 inhibitor), which perturbs mitochondrial proteostasis.
Fig. 3
Fig. 3
Cell line comparison of the mitochondrial punctate phenotype. (A) U2OS, HeLa, and HepG2 cells were treated with the indicated concentration of disulfiram for 48 h after 24-h preculture. The total puncta area per cell with MitoTracker Deep Red stain is plotted with lines, and the percentage of cell numbers from well images is plotted with bars. Data are the mean ± SD from duplicate experiments testing 3 replicate wells. (B) Representative images with the HeLa or HepG2 cell line, with or without disulfiram. Scale bar is 100 μm. (C) Estimation of the relative LonP1 protein expression in these cell mitochondria from western blotting. Ratios are calculated from the total signal of LonP1 and VDAC for each sample and are plotted as the mean ± SD from independent triplicate experiments. Statistical analysis was performed with t test versus U2OS cells. * means an adjusted p-value < 0.05. (D) Summarized data of HeLa cells under various LONP1 knockdown conditions. Representative results of duplicate experiments are plotted as the mean ± SD from 4 replicate wells. Cells were precultured for 12 h and then transfected with the indicated concentration of LONP1-1 siRNA. After 12 h incubation with siRNA, the cells were replaced with fresh media and further treated with disulfiram for another 48 h. (E) Representative images of HeLa cells with mitochondrial punctate phenotypes. Scale bar is 100 μm.
Fig. 4
Fig. 4
Mitochondrial punctate phenotype with oligomycin A and protein insolubility by disulfiram and oligomycin A. (A) Representative images obtained using U2OS cells with 0.5 µM oligomycin A. Pseudocolor and contrast are the same as in Fig. 1A. Data are presented as the mean ± SD from triplicate experiments testing three replicate wells. Scale bar is 100 μm. (B) Dose–response punctate phenotype of oligomycin A. Plotted in the same way as in Fig. 1B. (C) Evaluation of insolubilization in U2OS cells by treatment with disulfiram and oligomycin. U2OS cells treated with disulfiram in the indicated concentrations were lysed with 0.1% Triton X-100 and then fractionated into soluble and insoluble fractions. Note that the soluble factions were 1 in 5 dilutions of the original samples. VDAC in the soluble fraction is a reference marker for mitochondrial abundance. ALDH2, TID-1, and OXCT-1 were first blotted and imaged without VDAC antibody and then blotted with the addition of VDAC antibody.
Fig. 5
Fig. 5
Inhibition of the mitochondrial punctate phenotype. (A) Relation between total puncta area and seeding cell density. Treatment with 1 µM disulfiram and 1 µM oligomycin A was obtained at 48 h exposure with various cell densities. The standardized normal condition is 1500 cells/well at seeding. Data are plotted as means from duplicate experiments. (B) U2OS cells were treated with 0.5 µM oligomycin A or 0.5 µM disulfiram for 48 h and co-treated with 5 µM CCCP, 0.1 µM rotenone, or 10 mM NAC. Data are plotted as means ± SD of the total mitochondrial puncta area per cell from triplicate experiments with testing 10 replicate wells. Statistical analysis was performed with t-test versus no combination wells. * means an adjusted p-value < 0.05 while ** means an adjusted p-value < 0.01. (C) Representative images of the inhibitory effect shown in (B). Blue pseudocolor shows nuclear staining with Hoechst 33342 while red pseudocolor shows mitochondrial staining with MitoTracker Deep Red. Scale bar is 100 μm.
Fig. 6
Fig. 6
Investigation of disulfiram derivatives. (A)Total puncta area per cell with MitoTracker staining and the percentage of total cell numbers from nuclei are plotted for DDC, CuET, and thiram. Data are presented as means ± SD from triplicate experiments with 3 replicate wells. (B) Inhibition of ALDH2 enzyme with disulfiram and its derivatives. Because disulfiram is an irreversible and active cysteine attacker, ALDH2 activity was calculated by the change of fluorescence with and without pre-incubation for 30 min with disulfirams. The 100% of ALDH2 activity was calculated from wells with no compound and 0% was calculated from wells without enzyme. Data are presented as the means from duplicate experiments testing 3 replicate wells.

Similar articles

References

    1. Bray, M. A. et al. Cell Painting, a high-content image-based assay for morphological profiling using multiplexed fluorescent dyes. Nat. Protoc.11, 1757 (2016). - PMC - PubMed
    1. States, C. et al. Multiplex cytological profiling assay to measure diverse. PLoS One8, e8099 (2013). - PMC - PubMed
    1. Rohban, M. H. et al. Systematic morphological profiling of human gene and allele function via cell painting. Elife6, 24060 (2017). - PMC - PubMed
    1. Bray, M. A. et al. A dataset of images and morphological profiles of 30,000 small-molecule treatments using the Cell Painting assay. GigaScience6, 85. 10.1093/gigascience/giw014 (2017). - PMC - PubMed
    1. Singh, S. et al. Morphological profiles of RNAi-induced gene knockdown are highly reproducible but dominated by seed effects. PLoS One10, e131370 (2015). - PMC - PubMed

LinkOut - more resources