. 2024 Dec 28;14(1):31466.
doi: 10.1038/s41598-024-83155-3.

Harnessing Raman spectroscopy and multimodal imaging of cartilage for osteoarthritis diagnosis

Affiliations

Harnessing Raman spectroscopy and multimodal imaging of cartilage for osteoarthritis diagnosis

Anna Crisford et al. Sci Rep. .

Abstract

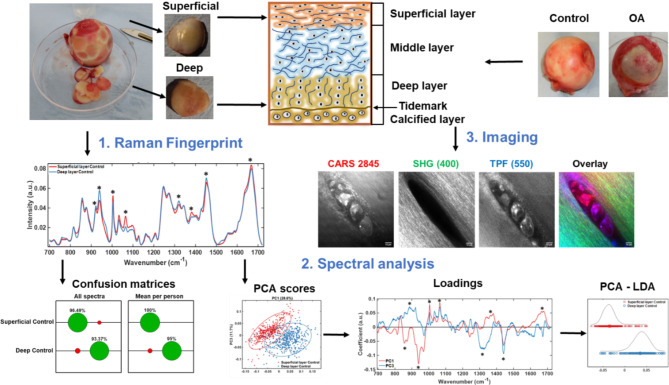
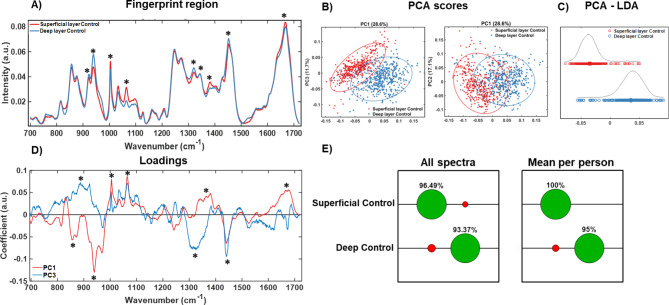
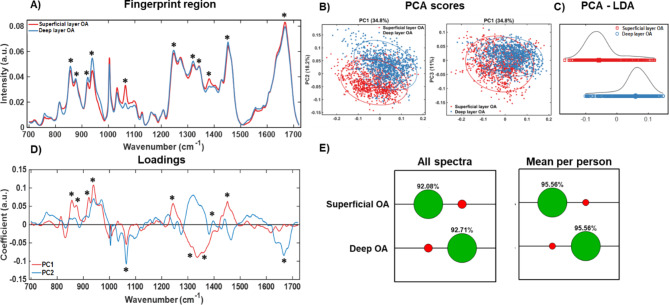
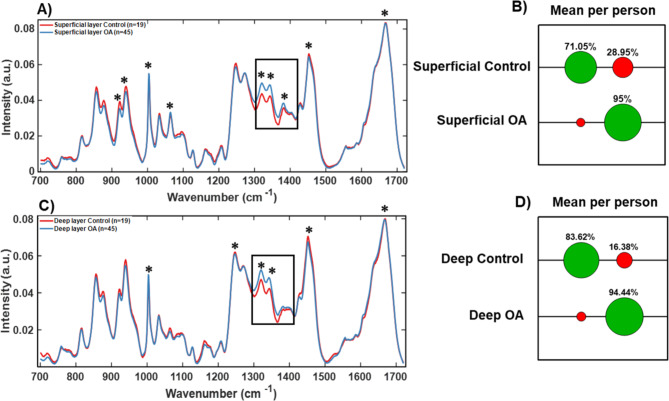
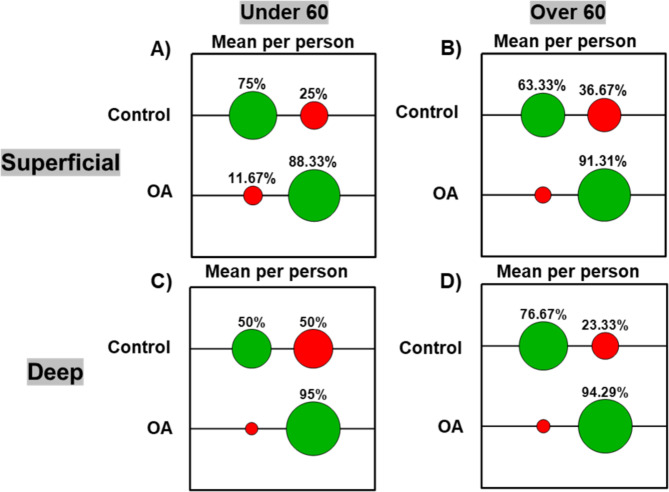
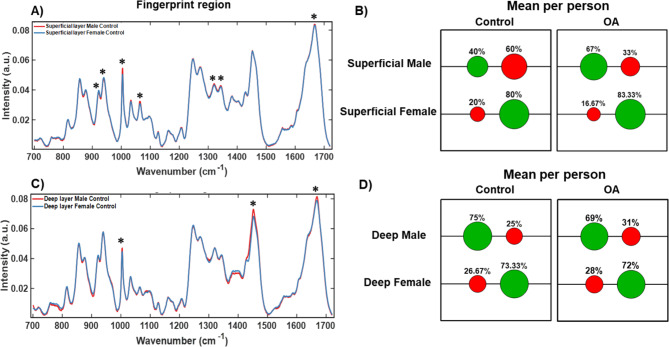
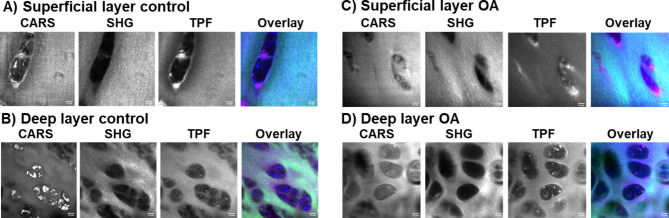
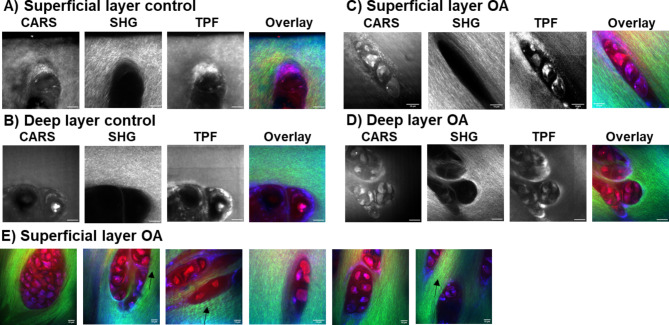
Osteoarthritis (OA) is a complex disease of cartilage characterised by joint pain, functional limitation, and reduced quality of life with affected joint movement leading to pain and limited mobility. Current methods to diagnose OA are predominantly limited to X-ray, MRI and invasive joint fluid analysis, all of which lack chemical or molecular specificity and are limited to detection of the disease at later stages. A rapid minimally invasive and non-destructive approach to disease diagnosis is a critical unmet need. Label-free techniques such as Raman Spectroscopy (RS), Coherent anti-Stokes Raman scattering (CARS), Second Harmonic Generation (SHG) and Two Photon Fluorescence (TPF) are increasingly being used to characterise cartilage tissue. However, current studies are based on whole tissue analysis and do not consider the different and structurally distinct layers in cartilage. In this work, we use Raman spectroscopy to obtain signatures from the superficial (top) and deep (bottom) layer of healthy and osteoarthritic cartilage samples from 64 patients (19 control and 45 OA). Spectra were acquired both in the 'fingerprint' region from 700 to 1720 cm- 1 and high-frequency stretching region from 2500 to 3300 cm- 1. Principal component and linear discriminant analysis was used to identify the peaks that contributed significantly to classification accuracy of the different samples. The most pronounced differences were observed at the proline (855 cm- 1 and 921 cm- 1) and hydroxyproline (877 cm- 1 and 938 cm- 1), sulphated glycosaminoglycan (sGAG) (1064 cm- 1 and 1380 cm- 1) frequencies for both control and OA as well as the 1245 cm- 1 and 1272 cm- 1, 1320 cm- 1 and 1345 cm- 1, 1451 cm- 1 collagen modes were altered in OA samples, consistent with expected collagen structural changes. Classification accuracy based on Raman fingerprint spectral analysis of superficial and deep layer cartilage for controls was found to be 97% and 93% on using individual/all spectra and, 100% and 95% on using mean spectra per patient, respectively. OA diseased cartilage was classified with an accuracy of 88% and 84% for individual/all spectra, and 96% and 95% for mean spectra per patient based on analysis of the superficial and the deep layers, respectively. Raman spectra from the C-H stretching region (2500-3300 cm- 1) resulted in high classification accuracy for identification of different layers and OA diseased cartilage but low accuracy for controls. Differential changes in superficial and deep layer cartilage signatures were observed with age (under 60 and over 60 years), in contrast, less significant differences were observed with gender. Prominent chemical changes in the different layers of cartilage were preliminarily imaged using CARS, SHG and TPF. Cell clustering was observed in OA together with differences in pericellular matrix and collagen structure in the superficial and the deep layers correlating with the Raman spectral analysis. The current study demonstrates the potential of Raman Spectroscopy and multimodal imaging to interrogate cartilage tissue and provides insight into the chemical and structural composition of its different layers with significant implications for OA diagnosis for an increasing aging demographic.

Keywords: Deep tissue imaging; Fingerprint Raman; Multimodal imaging; cartilage layers; osteoarthritis diagnosis.


Conflict of interest statement

Declarations. Competing interests: The authors declare no competing interests.

Figures

Fig. 1
Fig. 1
Workflow and methodology used in this work illustrated using control cartilage samples. Top right shows femoral heads received post-surgery and the samples generated for analysis of superficial and deep layers (top left). The schematic shows the layered structure of the cartilage. (1) Shows the mean Raman spectra for the different cartilage layers (2) Spectra were analysed using Principal Component Analysis (PCA) and the scatter plot and loadings are shown. PCA was cascaded into Linear Discriminant Analysis (LDA) which improves the separation between classes. Confusion matrices show the classification accuracy into superficial and deep layers based on its spectral signatures from all individual spectra to investigate heterogeneity and average spectra per patient for diagnostics. Confusion matrices were created with SVM analysis of the spectra directly. (3) Representative multimodal images of articular cartilage showing lipids and cell phospholipid bilayers (CARS), collagen fibres (SHG) and autofluorescent biological molecules (TPF). In overlay, the three modalities are combined: CARS (red), SHG (green), TPF (blue). Scale bar 10 μm.
Fig. 2
Fig. 2
Raman spectroscopic analysis of superficial and deep layers of healthy cartilage. (A) Fingerprint region (700 to 1720 cm− 1) of RS of superficial (red) and deep (blue) layers of healthy “control” cartilage. (B) 2-D PCA scatter plots show distribution of superficial and deep layer spectra along PC1, PC2 and PC3 axes. (C) LDA analysis shows further separation of superficial (red) and deep (blue) layers based on class labels. (D) PC1 and PC3 loadings from the PCA. (E) Confusion matrices show the classification accuracy with correct classifications indicated in green and mis-classifications indicated in red of spectra from superficial or deep layer cartilage using all individual spectra and average spectra per patient. N = 19 (male n = 9, female n = 10). Asterisks (“*”) in (A) refer to “*” in (D) to highlight the main spectral peaks that contribute to PCA in (B).
Fig. 3
Fig. 3
Raman spectroscopic analysis of superficial and deep layers of osteoarthritic (OA) cartilage. (A) Fingerprint region (700 to 1720 cm− 1) of RS of superficial (red) and deep (blue) layers of OA cartilage. (B) 2-D PCA scatter plots showing the distribution of superficial and deep layer spectra along PC1, PC2 and PC3 axes. (C) LDA analysis showed clear separation of superficial (red) and deep (blue) layer spectra into the respective classes. (D) PC1 and PC2 loadings corresponding to PCA scatter plot shown in (B). (E) Confusion matrices show correct classifications (green) and misclassifications (red) of superficial and deep layer spectra from OA cartilage samples using all individual spectra and average spectra per patient. N = 45 (male n = 21, female n = 24). Asterisks (“*”) in (A) refer to “*” in (D) and point to spectral peaks contributing to PCA scores in (B).
Fig. 4
Fig. 4
Raman fingerprint for OA diagnosis of articular cartilage. (A) RS of superficial layer and (C) of deep layer from Control (red) vs. OA (blue) cartilage. Boxed regions show the region with the highest difference for OA and contains 1320/1345 cm− 1 collagen modes and 1380 cm− 1 sGAG peak identified by asterisks. Confusion matrices in (B) and (D) show classification accuracy with correct assignments indicated in green and mis-assignments indicated in red for average spectra per patient. Additional “*” in (A) and in (C) refer to loadings in Suppl. Fig.S2 and indicate spectral peaks that contribute to PCA scores. Suppl. Fig. S2 also includes PCA-LDA, PC scores and Confusion matrices for all spectra.
Fig. 5
Fig. 5
Effect of age on Raman spectral signatures of superficial and deep cartilage layers. Confusion matrices based on Raman spectra for OA diagnosis in under − 60 and over − 60 patient age groups (mean spectra per person). Superficial layer (A) and Deep layer (C) in under 60 cohort (control n = 5, OA n = 13). Superficial layer (B) and Deep layer (D) in over − 60 cohort (control n = 14, OA n = 32). Confusion matrices demonstrate percentage classification accuracy (green) and mis-classifications (red) based on SVM analysis of RS. RS, PCA, PCA-LDA, PCA scores and SVM on all spectra analysis are included in Suppl. Fig. S5 and S6.
Fig. 6
Fig. 6
Effect of gender on Raman signatures in different layers of healthy articular cartilage. (A) RS of superficial layer and (C) of deep layers from healthy cartilage samples of male (red) vs. female (blue). Confusion matrices in (B) and (D) demonstrate positive (green circles) and negative (red circles) scores in assignments to Male or Female samples in controls and OA cartilage. Asterisks (“*”) in (A) refer to Loadings in Controls in Suppl. Fig. S3 and show spectral peaks that contribute to PCA scores. Suppl. Fig. S3 also includes PCA, PCA-LDA, PC scores and Confusion matrices for all spectra for Control samples. Suppl. Fig. S4 includes RS, PCA, PCA-LDA, PC scores and Confusion matrices for all spectra for OA samples.
Fig. 7
Fig. 7
Multimodal imaging of the longitudinal direction (from the top and the bottom) sections of cartilage. (A) Superficial and (B) Deep layer from a control patient sample (M84 Control); (C) Superficial and (D) Deep layer from an OA patient sample (F44 OA). CARS at 2845 cm− 1 showing lipids, cell membranes and matrix, SHG (400 nm) showing type II collagen fibres in cartilage, TPH (550 nm) showing autofluorescence of collagen and other biological molecules, overlay with CARS (red), SHG (green) and TPF (blue). The scale bar is 10 μm.
Fig. 8
Fig. 8
Multimodal imaging in the transverse (perpendicular to the bone) samples of cartilage. (A) Superficial (M88 Control) and (B) Deep (F58 Control) layer from a control sample; (C) Superficial (F69 OA) and (D) Deep (M62 OA) layer from an OA sample. CARS at 2845 cm− 1 showing lipids, cell membranes and cartilage matrix, SHG (400 nm) showing type II collagen fibres, TPH (550 nm) showing autofluorescence of collagen and other biological molecules, overlay with CARS (red) of cells, SHG (green) of collagen and TPF (blue) of autofluorescent biological molecules. (E) Representative composite images of cells clustering in OA in Superficial layer and “wavy” structure of collagen fibers shown by arrows, overlay as in above. The scale bar is 10 μm.

Similar articles

Cited by

References

    1. Hunter, D. J., March, L. & Chew, M. Osteoarthritis in 2020 and beyond: a Lancet Commission. Lancet396, 1711–1712. 10.1016/S0140-6736(20)32230-3 (2020). - PubMed
    1. Wittenauer, R., Smith, L. & Aden K. M.
    1. Mandelbaum, B. & Waddell, D. Etiology and pathophysiology of osteoarthritis. Orthopedics28, s207–214. 10.3928/0147-7447-20050202-05 (2005). - PubMed
    1. Bachrach, N. M. et al. Changes in proteoglycan synthesis of chondrocytes in articular cartilage are associated with the time-dependent changes in their mechanical environment. J. Biomech.28, 1561–1569. 10.1016/0021-9290(95)00103-4 (1995). - PubMed
    1. Mow, V. C., Ratcliffe, A. & Poole, A. R. Cartilage and diarthrodial joints as paradigms for hierarchical materials and structures. Biomaterials13, 67–97. 10.1016/0142-9612(92)90001-5 (1992). - PubMed

Publication types

LinkOut - more resources