. 2025 May;32(5):818-836.
doi: 10.1038/s41418-024-01428-w. Epub 2024 Dec 29.

Inactivation of the SLC25A1 gene during embryogenesis induces a unique senescence program controlled by p53

Affiliations

Inactivation of the SLC25A1 gene during embryogenesis induces a unique senescence program controlled by p53

Anna Kasprzyk-Pawelec et al. Cell Death Differ. 2025 May.

Abstract

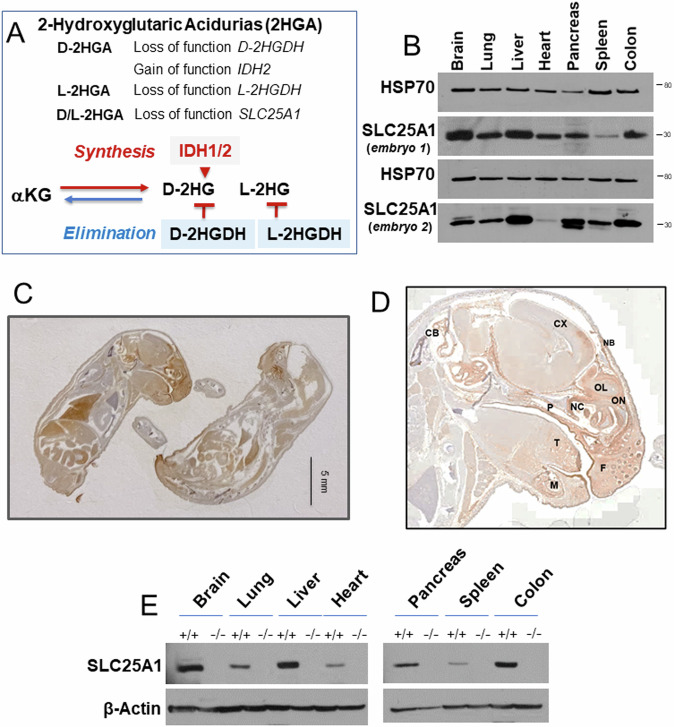
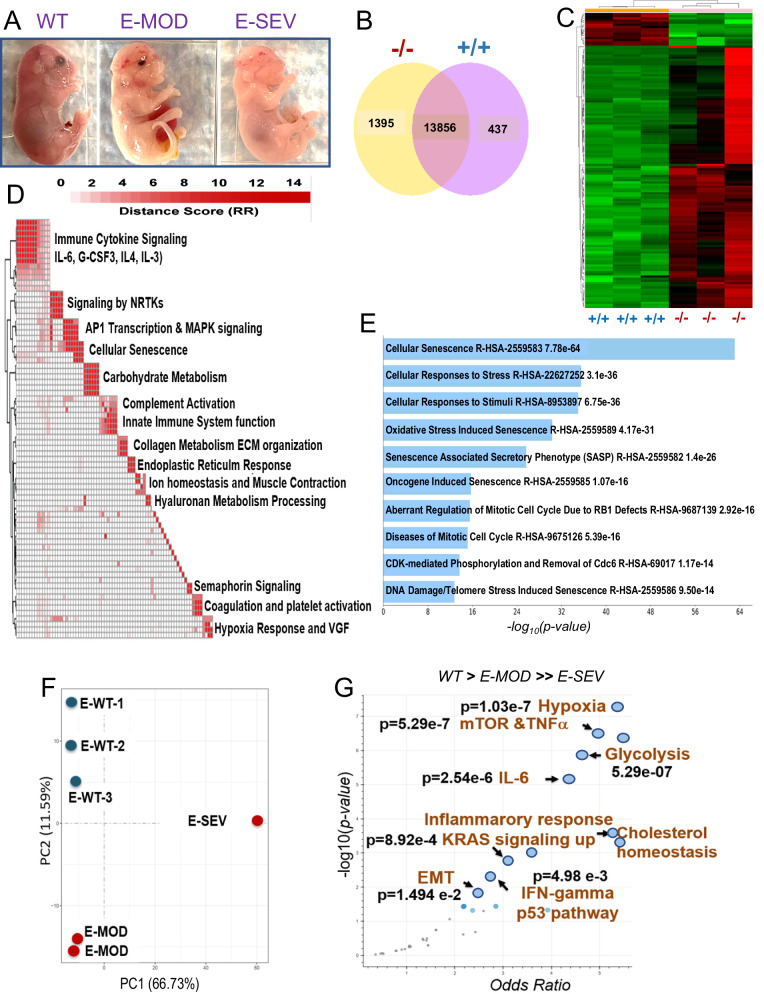
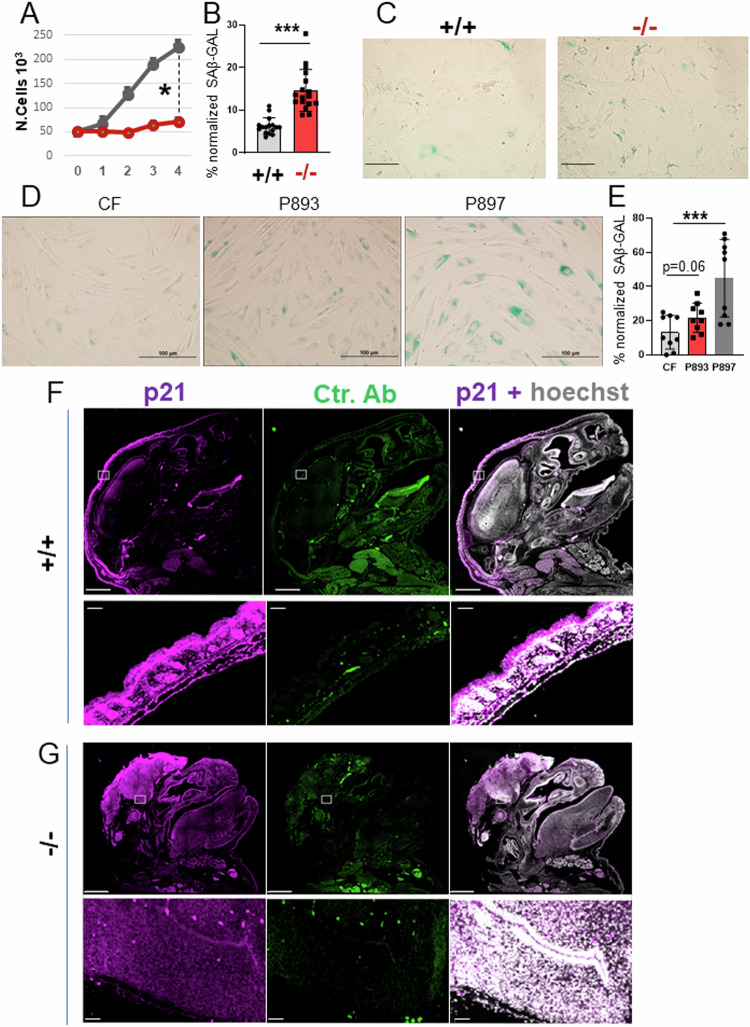
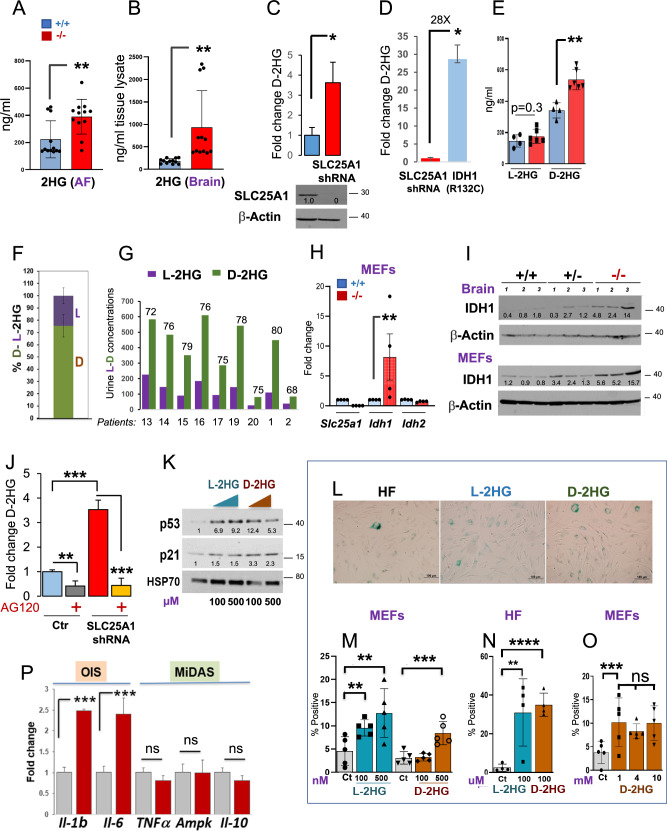
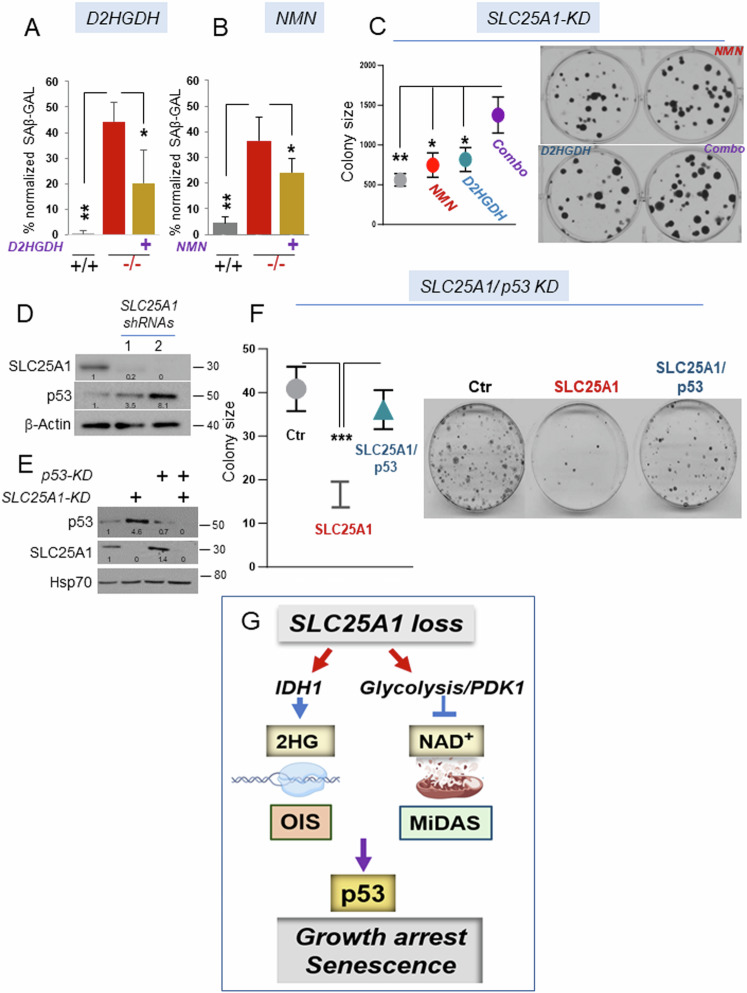
Germline inactivating mutations of the SLC25A1 gene contribute to various human disorders, including Velocardiofacial (VCFS), DiGeorge (DGS) syndromes and combined D/L-2-hydroxyglutaric aciduria (D/L-2HGA), a severe systemic disease characterized by the accumulation of 2-hydroxyglutaric acid (2HG). The mechanisms by which SLC25A1 loss leads to these syndromes remain largely unclear. Here, we describe a mouse model of SLC25A1 deficiency that mimics human VCFS/DGS and D/L-2HGA. Surprisingly, inactivation of both Slc25a1 alleles results in alterations in the development of multiple organs, and in a severe proliferation defect by activating two senescence programs, oncogene-induced senescence (OIS) and mitochondrial dysfunction-induced senescence (MiDAS), which converge upon the induction of the p53 tumor suppressor. Mechanistically, cells and tissues with dysfunctional SLC25A1 protein undergo metabolic and transcriptional rewiring leading to the accumulation of 2HG via a non-canonical pathway and to the depletion of nicotinamide adenine dinucleotide, NAD+, which trigger senescence. Replenishing the pool of NAD+ or promoting the clearance of 2HG rescues the proliferation defect of cells with dysfunctional SLC25A1 in a cooperative fashion. Further, removal of p53 activity via RNA interference restores proliferation, indicating that p53 acts as a critical barrier to the expansion of cells lacking functional SLC25A1. These findings reveal unexpected pathogenic roles of senescence and of p53 in D/L-2HGA and identify potential therapeutic strategies to correct salient molecular alterations driving this disease.


Conflict of interest statement

Competing interests: The authors declare no competing interests. Ethical approval and consent to participate: All animal studies were conducted in compliance with ethical regulations according to protocol #2017-1192 approved by the Institutional Animal Care and Use Committee (IACUC) at Georgetown University. All the mice were housed at Georgetown University Division of Comparative Medicine, in a SPF vivarium which is maintained at a 12:12 h light:dark cycle, at 68–74 °F and 30–70% humidity range, according to IACUC regulations. Mice were euthanized according to the IACUC guidelines. This study does not directly involve human subjects or human data that requires ethical approval. The collection and use of atient-derived samples utilized herein was approved by the Institutional Review Board at the University of Pittsburgh, protocol #19090211 [34].

Figures

Fig. 1
Fig. 1. Analysis of SLC25A1 protein expression.
A Schematic representation of 2-Hydroxyglutaric acidurias (2HGA). Upper panel: genetic alterations in individual and combined 2-HGA. Lowe panel: some of the main pathways to the synthesis and elimination of D- and L-2HG in 2HGA. B Expression levels of SLC25A1 protein in the indicated organs derived from two Slc25a1 wild-type embryos at E19.5 dpf. C, D Representative IHC images with the anti-SLC25A1 antibody staining in embryos at E19 dpf. Cb= Cerebellum, Cx = Cerebral cortex, F=follicle, P=palate, T = tongue, M = mandible, NB= nasal bone, NC = nasal cavity, OL=olfactory lobe, ON=olfactory nerve. E Immunoblot with the anti-SLC25A1 antibody in the indicated organs derived from wild-type or SLC25A1 deficient embryos at day 19.5 pdf.
Fig. 2
Fig. 2. The knock-out of the Slc25a1 gene leads to perinatal lethality.
A Representation of the genotypes observed across 85 litters (495 mice) obtained by breeding Slc25a1 heterozygous mice. B Number and percentage of births observed across a population of newborn +/+, +/- and -/- mice. C Prevalence of the phenotypic alterations observed in Slc25a1-/- embryos. D Representative images of Slc25a1+/+, Slc25a1+/- and Slc25a1-/- embryos under stereoscopic microscope at E18.5 dpf. Red arrows point to cleft palate, underdeveloped ears, and brain abnormalities. Bar = 5 mm. E Measurements of crows to rump length showing smaller body size in Slc25a1 homozygous mice compared with wild-type and heterozygous littermates (n = 16 mice per genotype, respectively). p-values were calculated with two-tailed non-parametric t-test. F Heterogeneity of the phenotypes of Slc25a1-/- embryos at 19pdf or at P0, showing variations in body size, lack of skull and eyes in the last two born embryos on left (indicated by arrows). G Computed Tomography (CT) scan of wild-type or Slc25a1-/- embryos at E18.5 dpf. Yellow numbers indicate: 1: Exencephaly; 2: Protruding tongue; 3: Gastroschisis; 4: Pectus excavatum; 5: Abnormal heart. 6: Abnormal eye; 7: Abnormal facial area morphology. Bar = 1 mm. H Representative images of H&E staining in the embryos of the indicated genotype. Top panels show the anatomy of the whole head; lower panels show magnification of the cortical region and nuclear abnormalities in Slc25a1-/- mice. Bar = 20 µm. Red arrow points to hypertrophic tongue. Scanning electron microscopy (SEM) overviews of the neocortex (I), nasal cartilage (J) and tongue (K) in wild-type and Slc25a1-/- embryos at E18.5 dpf. Arrows in J point to vacuolization in the nasal cartilage.
Fig. 3
Fig. 3. Loss of SLC25A1 induces metabolic remodeling.
A-B Expression of the indicated proteins in brain (A) and MEFs (B) isolated from Slc25a1+/+, Slc25a1+/- and Slc25a1-/- embryos (n = 3 per genotype). C mRNA levels detected with q-RT-PCR of the indicated genes in MEFs Slc25a1+/+ (blue) and Slc25a1-/- (red). Each dot represents MEFs isolated from a different mouse (n = 4). D Principal component analysis (PCA) scores plot and the partial least squares (PLS) of 5 wild-type and Slc25a1 nullyzygous embryos used for metabolic studies. E-F Heatmap of top 25 enriched lipids in brain and AF samples obtained from Slc25a1+/+ (green) and Slc25a1-/- (red) (n = 5, from different litters, each in triplicate). Normalization was performed by dividing the area under the curve for each metabolite by the internal standard area. Clustering was performed by using the Metaboanalyst software. G Pathway enrichment analysis in the amniotic fluids obtained from Slc25a1-/- embryos relative to wild-type (n = 3 per genotype, each in 3 technical replicates). H Concentrations of the indicated TCA intermediates in the amniotic fluid obtained from Slc25a1+/+ and Slc25a1-/- embryos (n = 3-5, each in technical replicates). All data are presented as mean value ± SD. Unpaired non-parametric t-test was used throughout. In all blots, quantification was performed using ImageJ normalized to housekeeping protein (β-Actin or Hsp70), and results are presented as a fold change relative to control wild type.
Fig. 4
Fig. 4. Transcriptional analysis of Slc25a1 deficient embryos.
A Representative phenotypes of Slc25a1-/- .mice classified based on the severity of the phenotype (E18-19 dpf). B Venn diagram representing genes differentially regulated in the brains isolated from Slc25a1+/+ and Slc25a1-/- embryos at 18.5 dpc (n = 3). C Hierarchical clustering map of differentially expressed genes as in B. D Pathway enrichment analysis of genes significantly elevated in Slc25a1-/- mice relative to wild-type. Enriched pathways (FDR < 0.05), assessed from the Reactome Database, were clustered via a distance metric derived from shared significant genes common amongst enriched gene sets. Clustered gene sets were summarized by biological function. E Main pathways related to senescence induced in Slc25a1-/- embryos detected with Enrichr (Reactome 2022). p-values are generated by the software and are indicated. F PCA plot of the transcriptomic profiles of indicated embryos. G Transcriptomic data derived from each of the embryos were used for a Hue-Saturation-Value (HSV) analysis. The Enrichr gene set tool was employed to identify gene sets that are significantly more active in E-SEV and moderately elevated in E-MOD versus wild-type (WT. > E-MD. > > E-SV); p < 0.05.
Fig. 5
Fig. 5. SLC25A1 dysfunction induces premature senescence.
A Growth curves of MEF cells isolated from Slc25a1+/+ and Slc25a1-/- embryos. Cells were plated at the same density (5000 cells per well) and counted over the course of several days using trypan blue exclusion. Quantification of the SA-β-GAL positive MEF cells (%) normalized to the total number of cells identified with DAPI counter-staining pooled from two independent experiments (mean value ± SD) (B) and representative images of (SA-β-GAL) activity (C). Representative images of SA-β-GAL staining in human fibroblasts (D) and quantification of the SA-β-GAL positive cells normalized to the total number of cells identified with DAPI counter-staining (E). All IF data are presented as % positive cells ± SD pooled from two independent experiments. Bar = 100 μm. p21 immunofluorescence staining of the head of Slc25a1+/+ (F) and Slc25a1-/- (G) embryos at E19 dpf. Hoechst was used to counterstain the nuclei. Secondary antibody alone was used as a control. Bar = 1000 µM. Squares indicate areas of interests enlarged in each of the lower panels.
Fig. 6
Fig. 6. The OIS-lp and MiDAS pathways of senescence are induced when SLC25A1 is lost.
A Scheme of the OIS and MiDAS pathways of senescence and of the associated SASPs, depicting DNA replication stress or mitochondrial dysfunction, respectively (see also text for explanation) (created with Biorender). B mRNA levels of the OIS (brown) and MiDAS (green) SASPs in Slc25a1+/+ (grey) and Slc25a1-/- (red) MEFs, respectively (n = 3–4). Expression level of the indicated proteins involved in OIS (brown) and MiDAS (green) in the brain samples (C, F), MEFs (C, D) and in the patient’s fibroblasts (E) (n = 1–6). In all blots, quantification was performed using ImageJ normalized to housekeeping protein (β-Actin or Hsp70), and results are presented as a fold change relative to control (either +/+ mice or control fibroblasts).
Fig. 7
Fig. 7. NAD+ and ETC impairment in cells with dysfunctional SLC25A1.
A Oxygen consumption rate (OCR) was assessed using Seahorse Extracellular Flux Analyzer in MEFs isolated from Slc25a1+/+ (black) and Slc25a1-/- (pink) embryos. Injection of Oligomycin, FCCP and Rotenone/Antimycin allowed calculation of the BR= Basal respiration; ATP= mitochondrial ATP Production, MR= Maximal Respiration, SRC= Spare Respiratory Capacity. B Activities of the indicated ETC complexes measured in +/+ or -/- MEFs. % = residual activity. C Glycolysis in the indicated MEFs measured as Extracellular acidification (ECAR). D NAD+/NADH ratio in MEFs isolated from Slc25a1+/+ and Slc25a1-/- embryos. E Relative expression of the indicated HIF1α genes/transcripts in brains isolated from Slc25a1+/+ and Slc25a1-/- embryos (n = 3). OCR measured in +/+ or -/- MEFs untreated or treated with the indicated concentration of DCA (F) or NMN (G). Bars represent SEM and p-values were calculated using two tailed non parametric t-test. Experiments shown in this Figure were performed multiple times (2-3).
Fig. 8
Fig. 8. 2HG induces an OIS-like pathway of senescence.
2HG enrichment in the amniotic fluid (A) and brain samples (B) obtained from Slc25a1+/+ (blue) and Slc25a1-/- (red) embryos at E18.5 dpf (n = 4). C D-2HG enrichment in A549 cells harboring the shRNA mediated SLC25A1 knock-down relative to control. D D-2HG enrichment in cells harboring the SLC25A1-KD or expressing the mutant IDH1R132C. E D or L-2HG enrichment in the amniotic fluids of Slc25a1+/+ (blue) and Slc25a1-/- (red) embryos (n = 4-5). F Relative abundance of D- and L- 2HG (%) in the amniotic fluid samples of Slc25a1-/- embryos compared to wild-type littermates (n = 2–3). G Urine concentration of D- and L- 2HG in patient samples. Data were extrapolated based on enrichment detected in two different studies. Patients 13-20 were from Ref. [11]; Patients 1 and 2 from Ref. [13]. mRNA (H) and protein (I) levels of SLC25A1, IDH1 and IDH2 in the indicated MEFs or brain samples (n = 3-4). J D-2HG enrichment in A549 cells harboring the SLC25A1-shRNA treated with AG120. Results were obtained from 3 experiments combined. K Expression levels of p53 and p21 in human fibroblast treated with the indicated concentrations of L- or D-2HG. Results are representative of two separate experiments. L Representative images of SA-β-GAL staining of control human fibroblast cells treated with L-or D- 2HG for 72 hours (Bar = 100 µM). Quantification of SA-β-GAL staining of MEFs cells (M, O) or control human fibroblasts (HF, N) treated with indicated concentrations of L-or D-2HG for 3 to 5 days (Bar = 100 µM). Bars represent SD from 2 separate experiments. P mRNA levels of the OIS (brown) and MiDAS (green) SASPs in cells treated with D-2HG. Data are from two experiments and are presented as mean value ± SD. In all blots, quantification was performed using ImageJ normalized to housekeeping protein (β-Actin or Hsp70), and results are presented as a fold change relative to control.
Fig. 9
Fig. 9. 2HG perturbs embryonic development in zebrafish embryos.
A Phenotypes of zebrafish embryos treated with 25 µM or 50 µM D-2HG at 2 dpf. Embryos were injected at blastula-stage. Prominent alterations are indicated by arrows, as small eyes, bulging brains, enlarged yolk sack, pericardial edema, altered body curvature, reduced body length, lymphatic cysts, and disorganized cellular structure of tissues, most prominently seen in the brain. B Phenotypes of 25 µM or 80 µM D-2HG treated embryos at 36 hpf. Top embryo is control. Higher magnification images of the head show the dose-dependent tissue disorganization of the brain. C Percent of zebrafish with or without defects untreated or treated with 2HG (control n = 4-15, 2HG treated n = 18-57). Data represent the results of 3 repetition experiments of embryos treated with different doses of 2HG. D Phenotype of embryos treated with the indicated doses of L-2HG at the indicated concentrations. Red arrows point to alterations in brain size, pericardial edema, enhanced body curvature and enlarged yolk. E Five days dpf Casper larvae. The top fish was treated with 30 µM D-2HG plus 20 µM L-2HG at 1 dpf. The lower fish is control. The treated larva has an enlarged heart (outlined with dashed line) and large diameter blood vessels (indicated with arrows). The treated larva additionally has a dysmorphic jaw and slightly bulging brain. F Treatment of embryos at 36 hpf, with the indicated mixtures using different ratios of D-2HG and L-2HG.
Fig. 10
Fig. 10. The growth defect imposed by SLC25A1 deficiency is p53-dependent.
Quantification of the SAβ-GAL positive (%) MEF cells in the presence or absence of D2HGDH (A) or treated with NMN (B) and normalized to the total number of cells identified with DAPI counter-staining. C Quantification (with ImageJ) and representative images of colony formation assay of cells transduced with the lentivirus harboring the SLC25A1-shRNA (SLC25A1-KD) and treated with NMN, or over-expressing D2HGDH, alone or in combination (indicated as combo). D SLC25A1 and p53 expression levels in A549 cells transduced with the control lentivirus (pLKO, ctr) or with lentivirus vectors harboring two different SLC25A1 shRNAs (1 and 2). E Levels of expression of SLC25A1 and p53 in the double knock-down experiments performed in A549 cells. F Colony formation assay in A549 cells in the presence and absence of the SLC25A1-KD and p53-KD alone, or in combination. Quantification of colonies size was performed with ImageJ using multiple plates and bars represent SD. Unpaired non-parametric t test was used. G Model representing the effects of SLC25A1 loss (see also the discussion), and depicting the main pathways identified in this study leading to the induction of the OIS-lp and MiDAS programs. In all blots, quantification was performed using ImageJ normalized to housekeeping protein (β-Actin or Hsp70), and results are presented as a fold change relative to control.

Update of

References

    1. Ruprecht JJ, Kunji ERS. The SLC25 mitochondrial carrier family: Structure and mechanism. Trends Biochem Sci. 2020;45:244–58. - PMC - PubMed
    1. Palmieri F, Scarcia P, Monné M. Diseases caused by mutations in mitochondrial carrier genes SLC25: A review. Biomolecules. 2020;10:655. - PMC - PubMed
    1. Mosaoa R, Kasprzyk-Pawelec A, Fernandez HR, Avantaggiati ML. The mitochondrial citrate carrier SLC25A1/CIC and the fundamental role of citrate in cancer, inflammation and beyond. Biomolecules. 2020;11:141. - PMC - PubMed
    1. Maynard TM, Meechan DW, Dudevoir ML, Gopalakrishna D, Peters AZ, Heindel CC, et al. Mitochondrial localization and function of a subset of 22q11 deletion syndrome candidate genes. Mol Cell Neurosci. 2008;39:439–51. - PMC - PubMed
    1. Funato N. Craniofacial phenotypes and genetics of DiGeorge syndrome. J Dev Biol. 2022;10:18. - PMC - PubMed

LinkOut - more resources