. 2025 Feb;12(7):e2408233.
doi: 10.1002/advs.202408233. Epub 2024 Dec 29.

Targeting Deltex E3 Ubiquitin Ligase 2 Inhibits Tumor-associated Neutrophils and Sensitizes Hepatocellular Carcinoma Cells to Immunotherapy

Affiliations

Targeting Deltex E3 Ubiquitin Ligase 2 Inhibits Tumor-associated Neutrophils and Sensitizes Hepatocellular Carcinoma Cells to Immunotherapy

Xiaoling Wu et al. Adv Sci (Weinh). 2025 Feb.

Abstract

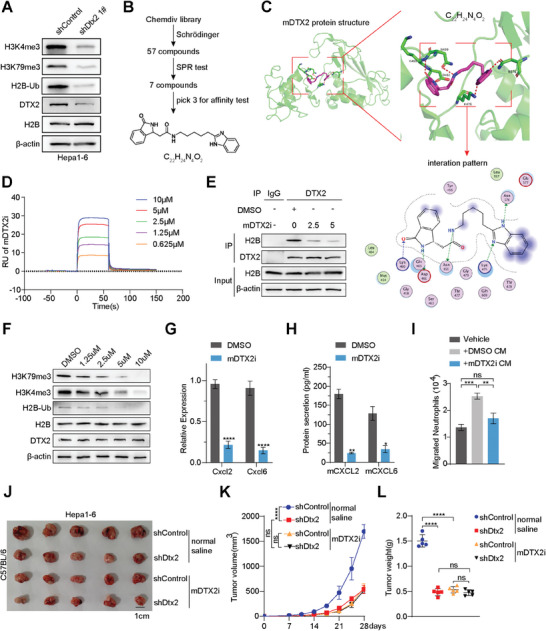
Several E3 ligases have been found to affect the immune microenvironment of hepatocellular carcinoma (HCC) and lead to the resistance of immunotherapy. In this study, genes of E3 ligases are screened based on The Cancer Genome Atlas (TCGA) dataset. Through cytometry by time of flight (CyTOF), flow cytometry, and further experiments, Deltex E3 ubiquitin ligase 2 (DTX2) in HCC cells is identified to promote the infiltration and polarization of tumor-associated neutrophils (TANs) with a protumor phenotype, thus attenuating the infiltration and cytotoxicity of CD8+ T cells partially through C-X-C motif chemokine 2 (CXCL2) and C-X-C motif chemokine 6 (CXCL6). Mechanistically, DTX2 can interact with histone H2B and promote its monoubiquitination at lysine120 (H2BK120ub1), thereby increasing CXCL2 and CXCL6 transcription through histone epigenetic regulation. Different tumor models in vivo demonstrated that DTX2 inhibitor treatment inhibited tumor growth and sensitized HCC cells to the therapeutic effects of programmed cell death protein 1 (PD-1) antibody. In summary, this study identifies DTX2 as a potential target for HCC immunotherapy.

Keywords: DTX2 inhibitor; deltex E3 ubiquitin ligase 2; hepatocellular carcinoma; tumor‐associated neutrophils.


Conflict of interest statement

The authors declare no conflict of interest.

Figures

Figure 1
Figure 1
DTX2 in HCC cells promotes tumor progression by affecting TANs and CD8+ T cells. (A) Diagram of the screening process for DTX2. (B) Schematic diagram of mouse subcutaneous tumor analysis. (C) t‐SNE plot of infiltrating immune cell clusters. (D) Distribution of immune cells infiltrating subcutaneous tumors (n = 5 per group). (E) Distribution of immune cells by flow cytometry (n = 4 per group). (F) Proportions of GZMB+ CD8+ T cells and IFN+ CD8+ T cells among total CD8+ T cells. (G) Proportions of ARG1+ cells and TNFα+ cells among total neutrophils. (H‐J) Images (H), growth curves (I) and burdens (J) of subcutaneous tumors (n = 5 per group). The data are presented as the means ± SDs. * p < 0.05, ** p < 0.01, *** p < 0.001, **** p < 0.0001. DNT, double‐negative T cell.
Figure 2
Figure 2
DTX2 attenuates CD8+ T cells by increasing neutrophil chemotaxis and protumoral polarization. (A) Schematic diagram of the in vitro biological functional assays. (B) Neutrophil migration assays using indicated groups of medium. (C) ARG1 expression level in neutrophils measured by flow cytometry. The dotted line indicates the boundary between ARG1‐ and ARG1+ cells. (D) IFNγ expression in CD8+ T cells measured by flow cytometry. (E) CFSE staining of CD8+ T cells. The dotted line indicates the CFSE staining peak in nonproliferating cells. (F) The cell counting number of CD8+ T cells. (G) Volcano plot of RNA‐seq data from neutrophils cultured with Huh‐7 siControl cell CM or Huh‐7 siDTX2 cell CM. (H) GSEA of neutrophil chemotaxis‐related gene sets in RNA‐seq data. (I) Biological process analysis of differentially expressed genes in RNA‐seq. (J) Phenotypic markers of neutrophils cultured with Huh‐7 siControl cell CM or Huh‐7 siDTX2 cell CM were analyzed by qPCR. The data are presented as the means ± SDs. * p < 0.05, ** p < 0.01, *** p < 0.001, **** p < 0.0001. NE, neutrophil; GOBP, Gene Ontology biological process; ns, nonsignificant difference.
Figure 3
Figure 3
Targeting CXCL2/CXCL6‐CXCR1/CXCR2 axis reduces the effects of DTX2 on neutrophils and CD8+ T cells. (A) Volcano plot of RNA‐seq data from the Huh‐7 siControl and Huh‐7 siDTX2 groups. (B) GSEA of the cytokine‐cytokine receptor interaction gene set in RNA‐seq data. (C) Peak signal distribution diagram and peak distribution heatmap based on ATAC‐seq of the Huh‐7 siControl group and the Huh‐7 siDTX2 group. (D) KEGG pathway analysis of the 116 downregulated genes. (E) Heatmaps of neutrophil‐related cytokines and chemokines in RNA‐seq data. (F) The expression levels of neutrophil‐related cytokines and chemokines measured by qPCR. (G) The concentrations of secreted CXCL2 and CXCL6 measured by ELISA. (H) Neutrophil migration assays using indicated groups of medium. (I) ARG1 expression level in neutrophils measured by flow cytometry. The dotted line indicates the boundary between ARG1‐ and ARG1+ cells. (J) IFNγ expression in CD8+ T cells measured by flow cytometry. (K) Neutrophil migration assays using indicated groups of medium. (L) ARG1 expression in neutrophils measured by flow cytometry. The dotted line indicates the boundary between ARG1‐ and ARG1+ cells. (M) IFNγ expression level in CD8+ T cells in each group measured by flow cytometry. The data are presented as the means ± SDs. * p < 0.05, ** p < 0.01, *** p < 0.001, **** p < 0.0001. Rep, Reparixin; ns, nonsignificant difference.
Figure 4
Figure 4
DTX2 affects H2B‐Ub, H3K4me3, and H3K79me3 and regulates the transcription of CXCL2 and CXCL6. (A) Protein profile obtained via mass spectrometry of different groups of co‐IP. (B) Co‐IP followed by western blot with anti‐FLAG or anti‐H2B. (C) Schematic diagram of the construction of the human DTX2 truncation mutant plasmids. (D) Exogenous expression of the truncated DTX2 proteins in Huh‐7 cells followed by co‐IP with anti‐FLAG. (E) Western blot analysis of H2B‐Ub. (F) Western blot analysis of H2B‐Ub in different groups of Huh‐7 cells expressing the truncated DTX2 proteins. (G) Western blot analysis of H2B‐Ub, H3K4me3 and H3K79me3. (H) Peak signal distribution diagram and peak distribution heatmap based on the CUT&Tag results obtained using anti‐H2B‐Ub, anti‐H3K4me3 and anti‐H3K79me3 in the Huh‐7 shControl group and the Huh‐7 shDTX2 group. (I) IGV diagram based on the CUT&Tag results obtained using anti‐H2B‐Ub, anti‐H3K4me3 and anti‐H3K79me3 at the CXCL2 and CXCL6 genomic loci. Chr, chromosome.
Figure 5
Figure 5
DTX2 is overexpressed in HCC and indicates poor prognosis. (A) The mRNA level of DTX2 from Zhongshan cohort, the expression level (FPKM) of DTX2 from TCGA LIHC dataset and GSE124535 dataset. (B) The DTX2 protein levels from Zhongshan cohort. (C) Overall survival curves of HCC patients in TCGA. (D) Representative diagram and statistical graph of the DTX2 staining intensity in the tissue microarray from Zhongshan cohort (n = 224 samples). (E) Overall survival curves of HCC patients from Zhongshan cohort (corresponding to DTX2 staining in the tissue microarray). (F) Images of IHC staining for DTX2, CD66B, CD8, CXCL2 and CXCL6 in the HCC tissue microarray samples from patient No. 31 and patient No. 33. (G) Statistical analysis of the intensity and proportion of CXCL2 and CXCL6 staining in Zhongshan cohort (corresponding to DTX2 staining in the tissue microarray, n = 224 samples). (H) Correlation analysis between IHC score of DTX2 and the number of ARG1+ CD66B+ cells on HCC tissue microarray after multiplex immunofluorescence staining. (I) Statistical graph of the number of CD8‐ and CD66B‐positive cells in different groups (corresponding to DTX2 staining in the tissue microarray, n = 224 samples). (J) Overall survival curves of HCC patients at Zhongshan Hospital divided into the indicated groups (corresponding to IHC staining in the tissue microarray). (K) Representative images of the DTX2 nuclear staining intensity in the tissue microarray. Overall survival curves of HCC patients at Zhongshan Hospital divided into the indicated groups (corresponding to IHC staining in the tissue microarray). The data are presented as the means ± SDs. * p < 0.05, *** p < 0.001, **** p < 0.0001.
Figure 6
Figure 6
Small molecule compound targeting mouse DTX2 (mDTX2) inhibits Cxcl2 and Cxcl6 transcription and tumor growth. (A) Western blot analysis of H2B‐Ub, H3K4me3, and H3K79me3. (B) Flow chart of the screen for small molecule compounds targeting mDTX2. (C) Schematic diagram of the predicted docking structure of C22H24N4O2 and mDTX2. (D) SPR analysis of the mDTX2i. (E) Co‐IP of Hepa1‐6 cells with anti‐DTX2. (F) Western blot analysis of H2B‐Ub, H3K4me3, and H3K79me3 in Hepa1‐6 cells. (G) The transcript levels of Cxcl2 and Cxcl6 in Hepa1‐6 cells treated with DMSO or the mDTX2i (5 µm) measured by qPCR. (H) The secretion of mouse CXCL2 and mouse CXCL6 from Hepa1‐6 cells treated with DMSO or the mDTX2i (5 µm) measured by ELISA. (I) Neutrophil chemotaxis in the Hepa1‐6 DMSO CM and Hepa1‐6 mDTX2i CM groups. (J–L) Images (J), growth curve (K) and burden (L) of subcutaneous tumors formed from Hepa1‐6 shControl and Hepa1‐6 shDtx2 cells treated with normal saline or the mDTX2i (n = 5 per group). The data are presented as the means ± SDs. * p < 0.05, ** p < 0.01, *** p < 0.001, **** p < 0.0001. C22H24N4O2, N‐[5‐(1H‐benzimidazol‐2‐YL) pentyl]‐2‐(3‐oxo‐2,3‐dihydro‐1H‐isoindol‐1‐yl) acetamide; mDTX2i, mouse DTX2 inhibitor; ns, nonsignificant difference.
Figure 7
Figure 7
mDTX2i treatment sensitizes HCC cells to PD1 antibody treatment. (A) Schematic diagram of establishing the spontaneous HCC model with CTNNB1‐N90‐luc/sgTP53 plasmids via HDTVi. (B) Representative in vivo bioluminescence images of mice. (C) Luminescence intensity of the ROIs (n = 5 per group). (D) Liver weight/body weight ratio in the indicated groups (n = 5 per group). (E) Survival curves of the mice in the indicated groups (n = 5 per group). (F,G) Images (F) and burden (G) of orthotopic liver tumors formed from Hepa1‐6 shControl and Hepa1‐6 shDtx2 cells treated with IgG2a or an anti‐PD1 (n = 3 per group). (H,I) Images (H) and burden (I) of orthotopic liver tumors formed from Hepa1‐6 cells treated with IgG2a, the anti‐PD1, saline, or the mDTX2i (n = 3 per group). (J) Multiplex immunofluorescence staining of Ly6G, CD8, IFNγ and DAPI in indicated groups of orthotopic liver tumors. The data are presented as the means ± SDs. * p < 0.05, ** p < 0.01, *** p < 0.001, **** p < 0.0001. HDTVi, hydrodynamic tail vein injection; mAb, mouse antibody; mDTX2i, mouse DTX2 inhibitor; ns, nonsignificant difference.
Figure 8
Figure 8
Mechanistic schematic diagram. DTX2 in HCC cells promotes H2BK120ub1, which in turn alters chromatin accessibility and promotes the transcription and secretion of CXCL2 and CXCL6. DTX2 promotes the recruitment of TANs and the polarization of neutrophils toward a protumor phenotype in tumor tissues, thereby inhibiting the tumoricidal effect of CD8+ T cells. Targeting DTX2 can attenuate the immunosuppressive characteristics of the tumor microenvironment and sensitize HCC cells to immunotherapy.

Similar articles

Cited by

References

    1. Fridlender Z. G., Sun J., Kim S., Kapoor V., Cheng G., Ling L., Worthen G. S., Albelda S. M., Cancer Cell 2009, 16, 183. - PMC - PubMed
    1. Gabrilovich D. I., Nagaraj S., Nat. Rev. Immunol. 2009, 9, 162. - PMC - PubMed
    1. Bedford L., Lowe J., Dick L. R., Mayer R. J., Brownell J. E., Nat. Rev. Drug. Discovery. 2011, 10, 29. - PMC - PubMed
    1. Mattiroli F., Penengo L., Trends Genet. 2021, 37, 566. - PubMed
    1. Lee J.‐S., Shukla A., Schneider J., Swanson S. K., Washburn M. P., Florens L., Bhaumik S. R., Shilatifard A., Cell 2007, 131, 1084. - PubMed

MeSH terms

Substances

LinkOut - more resources