. 2025 Feb:79:103484.
doi: 10.1016/j.redox.2024.103484. Epub 2024 Dec 27.

ASB1 engages with ELOB to facilitate SQOR ubiquitination and H2S homeostasis during spermiogenesis

Affiliations

ASB1 engages with ELOB to facilitate SQOR ubiquitination and H2S homeostasis during spermiogenesis

Jinxing Lv et al. Redox Biol. 2025 Feb.

Abstract

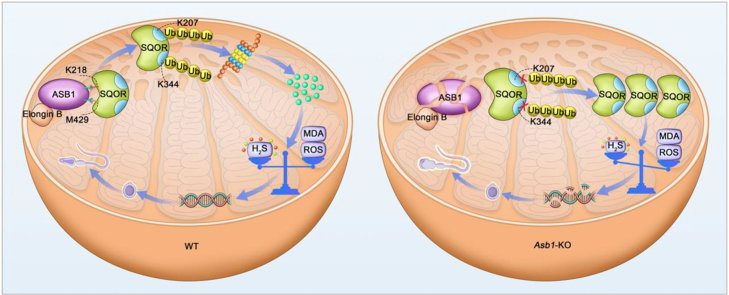
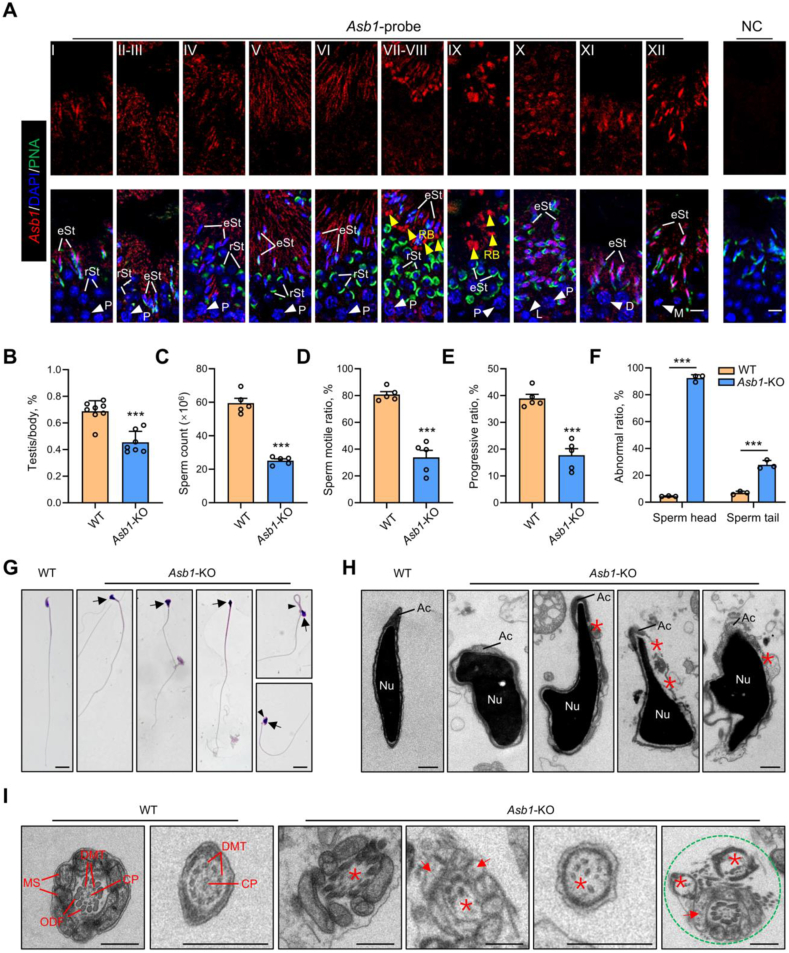
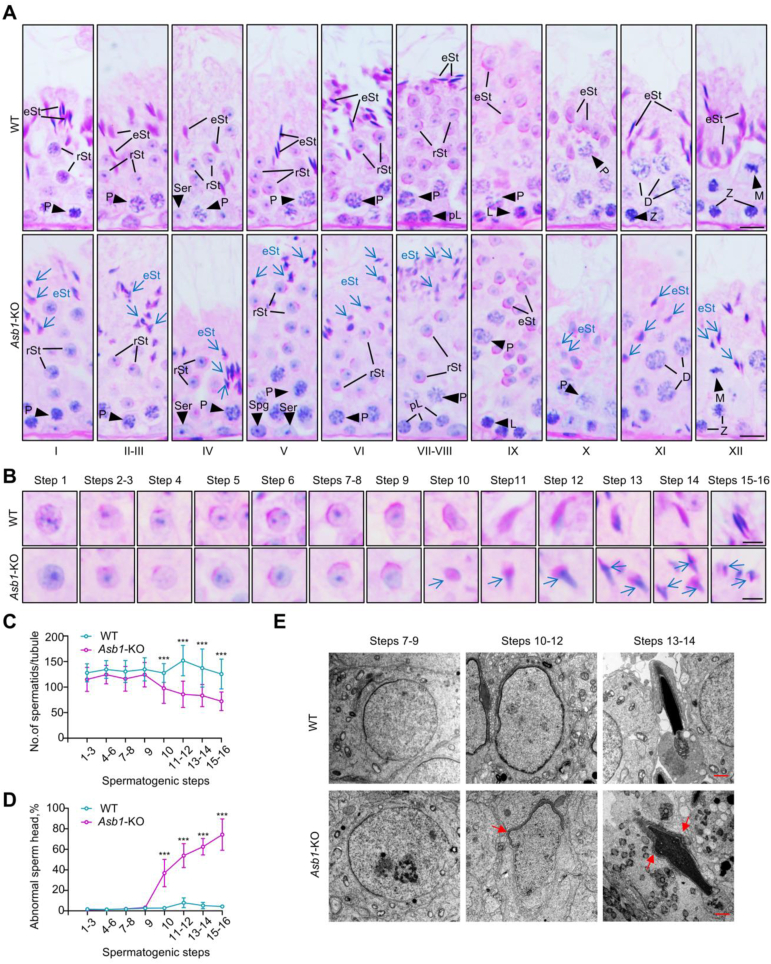
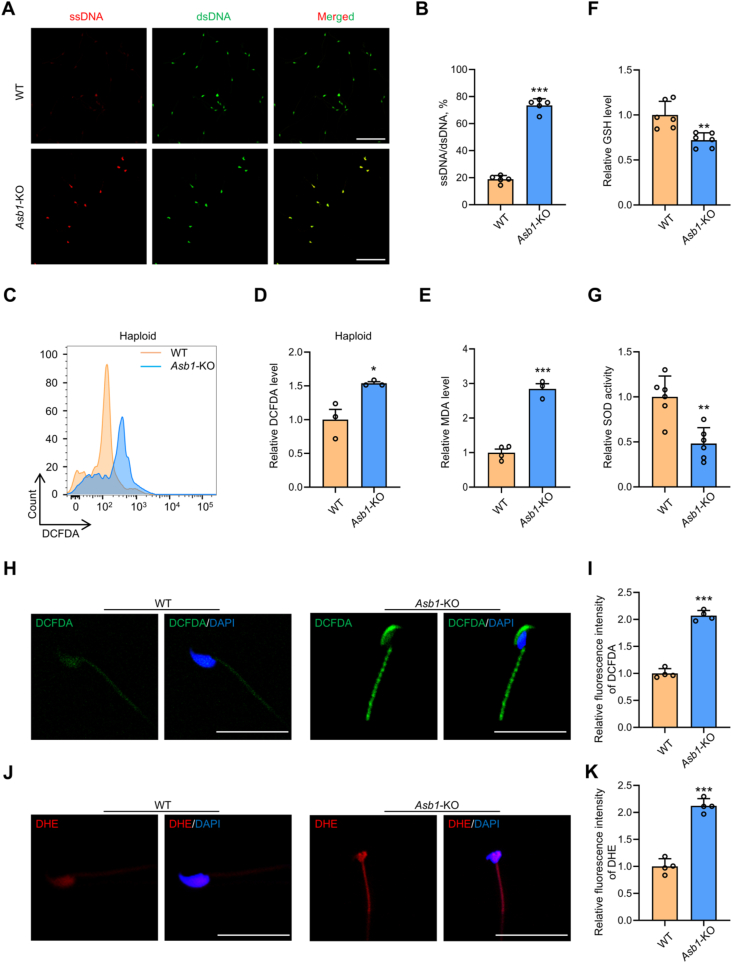
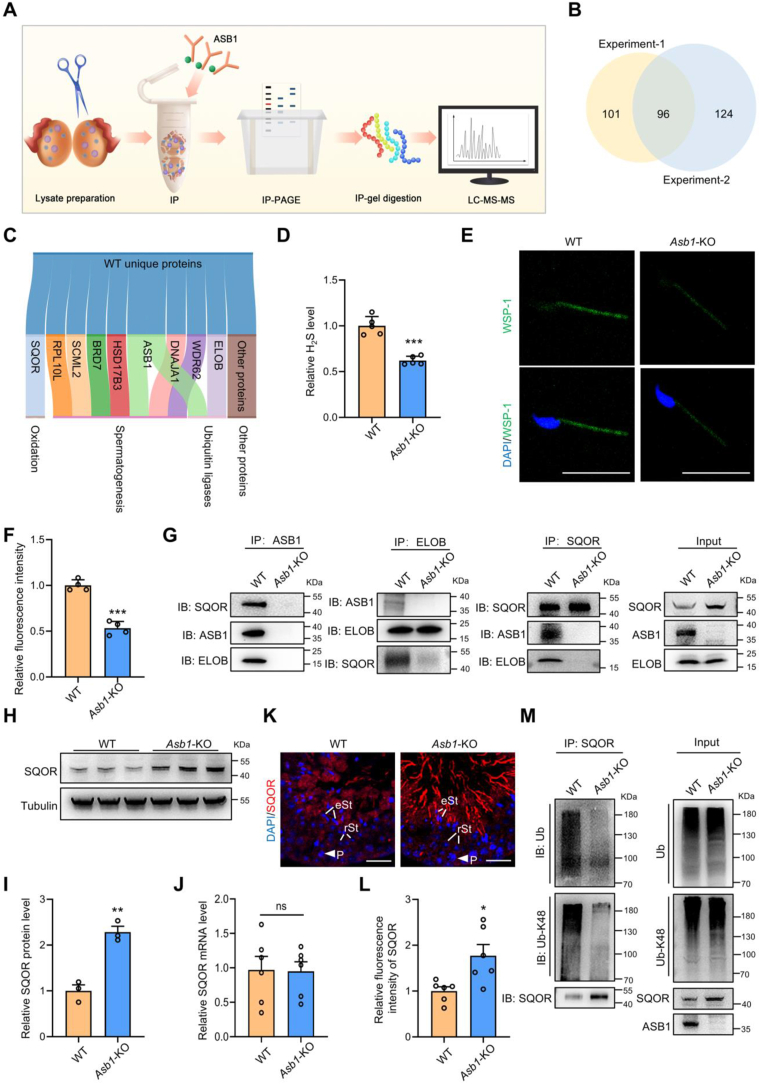
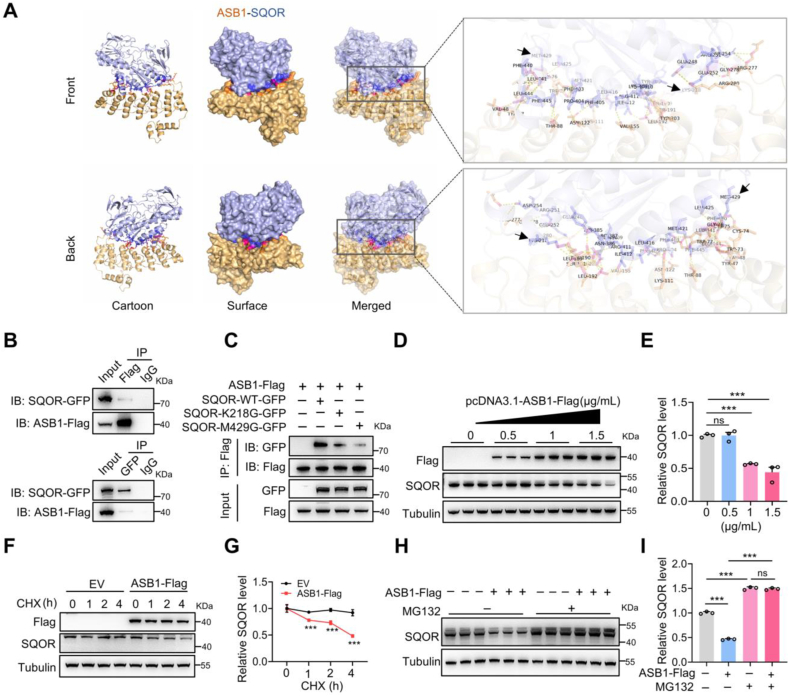
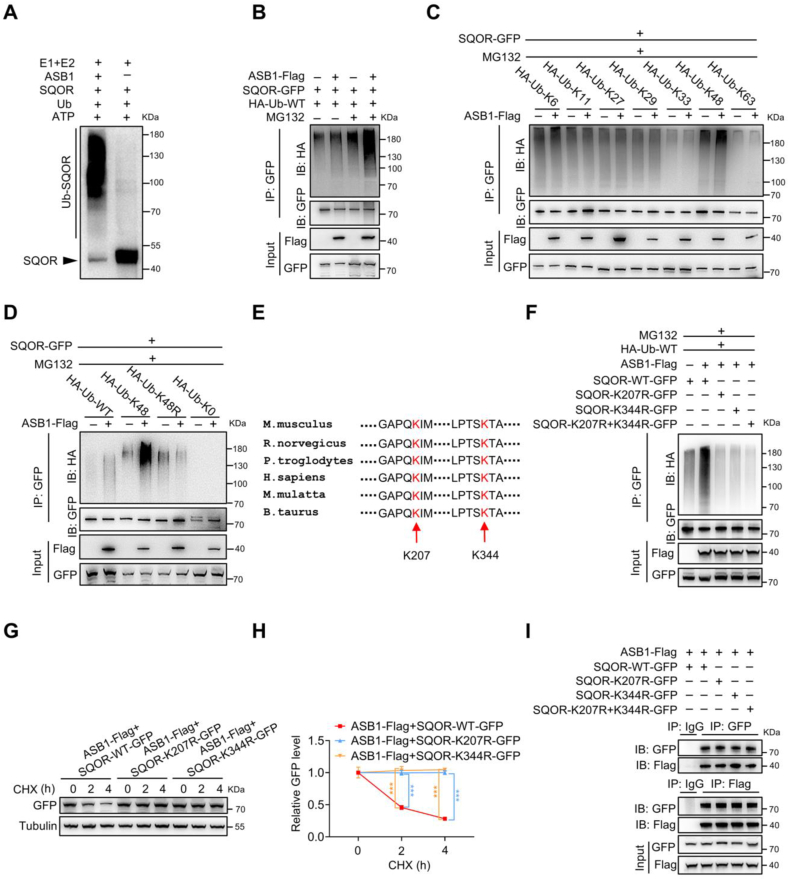
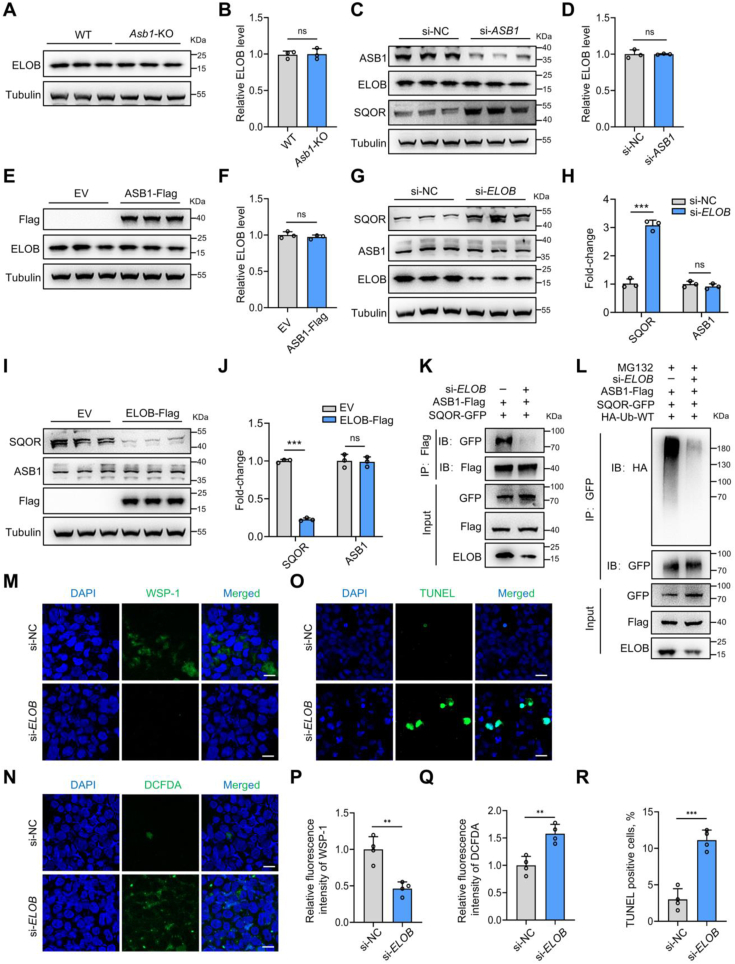
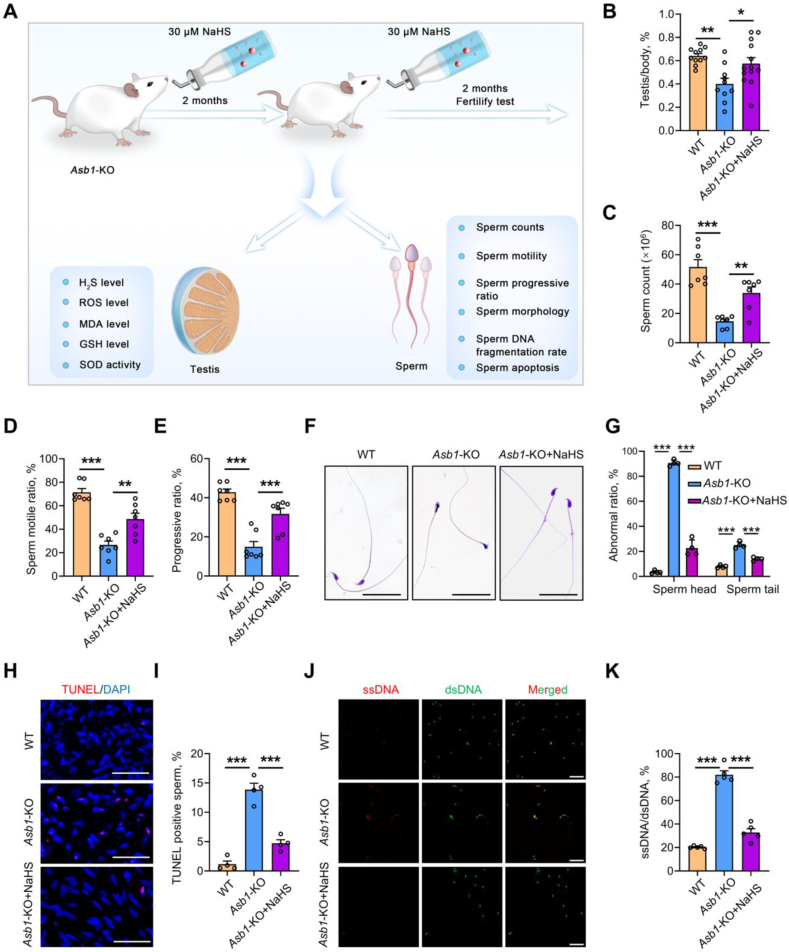
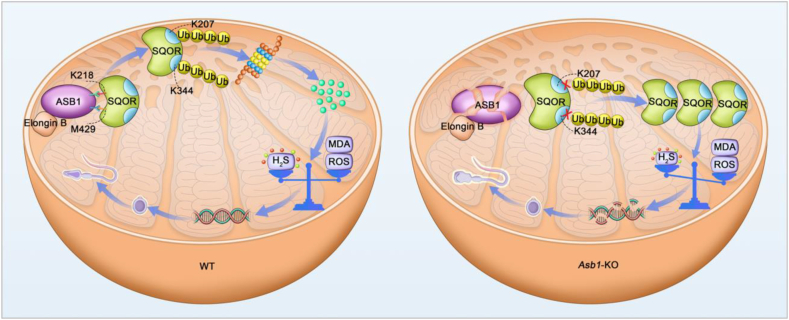
Male infertility, frequently driven by oxidative stress, impacts half of infertile couples globally. Despite its significance, the precise mechanisms governing this process remain elusive. In this study, we demonstrate that ASB1, the substrate recognition subunit of a ubiquitin ligase, is highly expressed in the mouse testis. Mice lacking the Asb1 gene exhibit severe fertility impairment, characterized by oligoasthenoteratozoospermia. Subsequent investigations unveiled that Asb1 knockout (Asb1-KO) mice encountered excessive oxidative stress and decreased hydrogen sulfide (H2S) levels in their testes, and severe sperm DNA damage. Notably, the compromised fertility and sperm quality in Asb1-KO mice was significantly ameliorated by administering NaHS, a H2S donor. Mechanistically, ASB1 interacts with ELOB to induce the instability of sulfide-quinone oxidoreductase (SQOR) by enhancing its K48-linked ubiquitination on residues K207 and K344, consequently triggering proteasomal degradation. This process is crucial for preserving H2S homeostasis and redox balance. Overall, our findings offer valuable insights into the role of ASB1 during spermiogenesis and propose H2S supplementation as a promising therapeutic approach for oxidative stress-related male infertility.

Keywords: ASB1; Hydrogen sulfide; Oxidative stress; Polyubiquitination; Spermiogenesis.


Conflict of interest statement

Declaration of competing interest The authors declare that they have no competing interests.

Figures

Image 1
Graphical abstract
Fig. 1
Fig. 1
Asb1-KO males are oligoasthenoteratozoospermia. (A) FISH assay of Asb1 distribution in the testes of 8-week-old mice at spermatogenic stages I–XII. During spermiogenesis, Asb1 was predominantly distributed in step10 spermatids (corresponding to stage X) to step15 spermatids (corresponding to stage VI). In stage VII–IX tubules, Asb1 likely accumulated in the residual bodies (yellow arrowheads). PNA was used to label acrosomes. L, leptotene spermatocytes; P, pachytene spermatocytes; D, diplotene spermatocytes; M, meiotic divisions; rSt, round spermatids; eSt, elongating/elongated spermatids; RB, residual bodies; NC, negative control. Scale bar: 10 μm. Similar results were observed from three independent experiments. (B) Testis/body weight ratio of 8-12-week-old WT and Asb1-KO mice. n = 8 WT mice and n = 7 Asb1-KO mice. (C) Sperm count from the cauda epididymis of 8-week-old WT and Asb1-KO mice. (D) Total motile sperm percentage measured by CASA for WT and Asb1-KO sperm. CASA, computer-assisted sperm analysis. (E) Progressive motility rate measured by CASA for WT and Asb1-KO sperm. For (C to E), n = 5 mice per group. (F) H&E staining of sperm in the cauda epididymis of 8-week-old WT and Asb1-KO mice. Sperm from Asb1-KO mice presented with amorphous, small or tapered heads (arrows) and coiled or bent tails (arrowheads). Scale bar: 10 μm. (G) Quantification of (f). For each group, at least 600 sperm from three mice were counted. (H and I) Ultrastructural analysis of sperm heads (H) and flagella (I) from cauda epididymis in 8-week-old WT and Asb1-KO mice. In addition to the certain abnormalities described in (f), TEM analysis of sperm heads also showed irregularly shaped or broken acrosomes with indiscernible acrosome membranes (asterisk in H) from Asb1-KO mice. TEM analysis of cross sections in WT sperm flagella showed complete “9 + 2” microtubule structure with nine DMTs, nine ODFs, and the CP (I). However, Asb1-KO sperm flagella exhibited disorganized MS with vacuoles (arrows in I) and lacking ODFs and axonemal components (asterisk in I). It also should be noted that three axonemes were co-existed in one cross section, which were probably to be a coiled or bent flagellum (circle with dashed line in I). TEM, Transmission electron microscopy; Ac, acrosome; Nu, nucleus; MS, mitochondrial sheath; CP, central pair of microtubules; DMT, peripheral microtubules doublet; ODF, outer dense fiber. Scale bar: 0.5 μm. Data are shown as means ± SD; Student’s t-test; ∗∗∗P < 0.001.
Fig. 2
Fig. 2
Impaired spermiogenesis in Asb1-KO mice. (A) PAS staining of spermatogenic stages I–XII in the testes of WT and Asb1-KO mice aged 8 weeks. The blue arrows indicate deformed spermatids. Spg, spermatogonia; pL, preleptotene spermatocytes; L, leptotene spermatocytes, Z, zygotene spermatocytes; P, pachytene spermatocytes; D, diplotene spermatocytes; M, meiotic divisions; rSt, round spermatids; eSt, elongating/elongated spermatids; Ser, Sertoli cells. Scale bar: 10 μm. (B) PAS staining showing the morphology of step 1 to 16 spermatids in the testes of 8-week-old WT and Asb1-KO mice. The blue arrows indicate deformed spermatids. Scale bar: 5 μm. (C and D) Quantification of (A and B). For each group, at least 20 tubules per stage from three mice were counted. Data are shown as means ± SD; Student’s t-test; ∗∗∗P < 0.001. (E) Ultrastructural analysis of spermatids in the testes of 8-week-old WT and Asb1-KO mice. Compared with WT mice, step 10 to 14 spermatids showed misshapen heads with swollen anterior and tapered posterior. Red arrows indicate nuclear protrusions in Asb1-KO spermatids. Scale bar: 1 μm.
Fig. 3
Fig. 3
Deficiency of ASB1 causes testicular oxidative stress and sperm DNA damage. (A) Acridine orange staining of sperm in the cauda epididymis of WT and Asb1-KO mice aged 8–12 weeks. ssDNA, single-stranded DNA; dsDNA, double-stranded DNA. Scale bar: 50 μm. (B) Quantification of (A). For each group, at least 500 sperm from five mice were counted. (C) Flow cytometry analysis of ROS levels in haploid spermatids of 8- to 12-week-old WT and Asb1-KO mice. DCFDA, 2′,7′–dichlorofluorescein diacetate. (D) Quantification of (C). n = 3 mice per group. (E) Detection of MDA levels in the testes of WT and Asb1-KO mice aged 8–12 weeks. n = 4 WT mice and n = 3 Asb1-KO mice. (F) Detection of GSH levels in the testes of WT and Asb1-KO mice aged 8–12 weeks. n = 6 mice per group. (G) SOD activity assays in the testes of WT and Asb1-KO mice aged 8–12 weeks. n = 6 mice per group. (H) DCFDA staining of sperm in the cauda epididymis of WT and Asb1-KO mice aged 8–12 weeks. Scale bar: 20 μm. (I) Quantification of the fluorescence intensity in WT and Asb1-KO mice (H). For each group, at least 400 sperm from four mice were counted. (J) DHE staining of sperm in the cauda epididymis of WT and Asb1-KO mice aged 8–12 weeks. Scale bar: 20 μm. (K) Quantification of the fluorescence intensity in WT and Asb1-KO mice (J). For each group, at least 400 sperm from four mice were counted. Data are shown as means ± SD; Student’s t-test; ∗P < 0.05, ∗∗P < 0.01, ∗∗∗P < 0.001.
Fig. 4
Fig. 4
ASB1 interacts with SQOR and promotes K48-linked polyubiquitination in mouse testes. (A) Schematic diagram illustrating the procedure for identifying ASB1-interacting proteins in testes of 8-week-old mice using immunoprecipitation (IP) combined with liquid chromatography-tandem mass spectrometry (LC‒MS/MS). (B) Venn diagram displaying the copurified proteins from two independent experiments in (A). (C) Gene Ontology (GO) annotation in (B). (D) Measurement of H2S levels in testes of 8-week-old Asb1-WT and KO mice. n = 5 mice per group. (E) H2S levels were measured using WSP-1 staining of sperm from the cauda epididymis of 8-12-week-old WT and Asb1-KO mice. Scale bar: 20 μm. (F) Quantification of the fluorescence intensity in WT and Asb1-KO mice (E). For each group, at least 400 sperm from four mice were counted. (G) Reciprocal coimmunoprecipitation (co-IP) assay showing the interactions between ASB1 and SQOR, the interactions between Elongin B and SQOR, as well as the interactions between ASB1 and Elongin B in testes of 8-12-week-old mice. Similar results were observed from three independent experiments. (H) Western blot analysis of SQOR expression in the testes of 8-12-week-old WT and Asb1-KO mice. (I) Quantification of the data in (H). n = 3 mice per group. (J) Real-time q-PCR analysis of Sqor transcripts in testes of 8-12-week-old WT and Asb1-KO mice. n = 6 mice per group. (K) Immunostaining of SQOR in testes of 8-12-week-old WT and Asb1-KO mice. SQOR was predominantly distributed in the cytoplasm of elongating/elongated spermatids. P, pachytene spermatocytes; rSt, round spermatids; eSt, elongating/elongated spermatids. Scale bar: 50 μm. (L) Quantification of the fluorescence intensity of SQOR in elongating/elongated spermatids in WT and Asb1-KO mice (K). n = 6 mice per group. (M) Ubiquitination assay for determining the pan- and K48-linked polyubiquitination of SQOR in testes of 8-12-week-old WT and Asb1-KO mice. Similar results were observed from three independent experiments. Ub: ubiquitin. Data are shown as means ± SD; Student’s t-test; ∗P < 0.05, ∗∗P < 0.01, ∗∗∗P < 0.001, ns: P > 0.05.
Fig. 5
Fig. 5
ASB1 interacts with SQOR and destabilizes it in HEK-293T cells. (A) Molecular docking of ASB1 and SQOR. Front and back views (left panel) of the docked protein complex of ASB1 (orange) and SQOR (blue). The interacting residues are colored red and purple for ASB1 and SQOR, respectively. The cartoon mode shows the backbone as well as the secondary structures of the relevant proteins, whereas the surface mode shows the solvent accessible surface area. The merged mode combines the cartoon and transparent surface views. The interface view (right panel) is magnified, and the binding residues (in stick representation) between ASB1 and SQOR are labeled. Hydrogen bonding between interacting residues is indicated with dashed yellow lines. The diagram only shows molecular connections within a distance of 3.5 Å. (B) Reciprocal co-IP assay showing the interactions between Flag-tagged ASB1 and GFP-tagged SQOR in HEK-293T cells transfected with the indicated plasmids. Similar results were observed from three independent experiments. (C) Co-IP assay showing the interactions between Flag-tagged ASB1 and GFP-tagged WT or mutated SQOR in HEK-293T cells transfected with the indicated plasmids. Similar results were observed from three independent experiments. (D) Western blot analysis of endogenous SQOR in HEK-293T cells transfected with the indicated doses of the Flag-tagged ASB1 plasmid. (E) Quantification of (D). The experiments were performed with three biological replicates. (F) A cycloheximide (CHX) chase assay was used to determine the stability of endogenous SQOR in HEK-293T cells transfected with Flag-tagged ASB1 or an empty vector (EV). (G) Quantification of (F). Similar results were observed from three independent experiments. (H) Western blot analysis of endogenous SQOR in HEK-293T cells transfected with Flag-tagged ASB1 and EV (−) with or without MG132 (20 μM) treatment. (I) Quantification of (H). The experiments were performed with three biological replicates. Data are shown as means ± SD; Student’s t-test (G); one-way ANOVA with Tukey’s (I) or Dunnett’s (E) post hoc test; ∗∗∗P < 0.001, ns: P > 0.05.
Fig. 6
Fig. 6
ASB1 catalyzes the formation of Ub chains on SQOR K207 and K344. (A) In vitro ubiquitination of SQOR by ASB1 immune complexes. (B) Ubiquitination assay for determining the polyubiquitination of GFP-tagged SQOR in HEK-293T cells transfected with the indicated plasmids with or without MG132 (20 μM) treatment. (C and D) Screening for potential Ub chain types. The polyubiquitination of GFP-tagged SQOR in response to ASB1 overexpression was examined in HEK-293T cells transfected with WT or mutated HA-tagged Ub plasmids and treated with MG132 (20 μM). HA-Ub-K0 (Ub with all lysine residues mutated to Arg) was used as a negative control. (E) Sequence alignments showing the predicted ubiquitination sites of SQOR among species. (F) The polyubiquitination of GFP-tagged WT or mutated SQOR in response to ASB1 overexpression was examined in HEK-293T cells transfected with an HA-tagged Ub plasmid and treated with MG132 (20 μM). (G) CHX assay to assess the stability of GFP-tagged WT and mutated SQOR in HEK-293T cells transfected with Flag-tagged ASB1 or empty vector (EV). (H) Quantification of (G). (I) Co-IP assay showing the interactions between Flag-tagged ASB1 and GFP-tagged WT or mutated SQOR in HEK-293T cells transfected with the indicated plasmids. For (B to D and F), cells were treated with MG132 to inhibit proteasomes for 6 h prior to harvest. For (A to D and F to I), similar results were observed from three independent experiments. The experiments were performed with three biological replicates. Data are shown as means ± SD; one-way ANOVA with Dunnett’s post hoc test; ∗∗∗P < 0.001.
Fig. 7
Fig. 7
ELOB is required for ASB1-SQOR interactions. (A) Western blot analysis of endogenous ELOB expression in the testes of 8-12-week-old WT and Asb1-KO mice. (B) Quantification of (A). n = 3 mice per group. (C) Western blot analysis of endogenous ELOB and SQOR in HEK-293T cells transfected with si-NC or si-ASB1. (D) Quantification of ELOB in (C). The experiments were performed with three biological replicates. (E) Western blot analysis of endogenous ELOB in HEK-293T cells transfected with Flag-tagged ASB1 or EV. (F) Quantification of (E). The experiments were performed with three biological replicates. (G) Western blot analysis of endogenous ASB1 and SQOR in HEK-293T cells transfected with si-NC or si-ELOB. (H) Quantification of (G). The experiments were performed with three biological replicates. (I) Western blot analysis of endogenous ASB1 and SQOR in HEK-293T cells transfected with Flag-tagged ELOB or EV. (J) Quantification of (I). The experiments were performed with three biological replicates. (K) Co-IP assay showing the interactions between Flag-tagged ASB1 and GFP-tagged SQOR in HEK-293T cells transfected with the indicated plasmids and siRNAs. Similar results were observed in three independent experiments. (L) The polyubiquitination of GFP-tagged SQOR in response to ELOB knockdown was examined in HEK-293T cells transfected with the indicated plasmids and treated with MG132 (20 μM). Similar results were observed from three independent experiments. (M) H2S levels were measured using WSP-1 staining in HEK-293T cells transfected with si-NC or si-ELOB. Scale bar: 20 μm. (N) ROS levels were measured using DCFDA staining in HEK-293T cells transfected with si-NC or si-ELOB. Scale bar: 20 μm. (O) TUNEL assay of HEK-293T cells transfected with si-NC or si-ELOB. Scale bar: 20 μm. (P) Quantification of (M). The experiments were performed with four biological replicates. (Q) Quantification of (N). The experiments were performed with four biological replicates. (R) Quantification of (O). The experiments were performed with four biological replicates. Data are shown as means ± SD; Student’s t-test; ∗∗P < 0.01, ∗∗∗P < 0.001, ns: P > 0.05.
Fig. 8
Fig. 8
Effects of NaHS supplementation on spermatogenesis in Asb1-KO mice. (A) Experimental design for NaHS supplementation in Asb1-KO mice. Two-month-old Asb1-KO mice were administered 30 μM NaHS in their drinking water for 2 months. Subsequently, the level of oxidative stress in the testes and the quality of the semen were assessed. Alternatively, Asb1-KO males were mated with WT females at a ratio of 1:2 for an additional 2 months while receiving NaHS treatment to assess the impact of NaHS supplementation on fertility in Asb1-KO mice. (B) Testis/body weight ratio. n = 11 WT mice; n = 10 Asb1-KO mice; n = 13 Asb1-KO + NaHS mice. (C) Cauda epididymal sperm count from 4-month-old WT, Asb1-KO, and Asb1-KO + NaHS mice. (D) Total motile sperm percentage measured by CASA for sperm obtained from WT, Asb1-KO, and Asb1-KO + NaHS mice. (E) Progressive motility rate measured by CASA for sperm from WT, Asb1-KO, and Asb1-KO + NaHS mice. For (C to E), n = 7 mice per group. (F) H&E staining of sperm in the cauda epididymis of 4-month-old WT, Asb1-KO, and Asb1-KO + NaHS mice. Scale bar: 25 μm. (G) Quantification of (F). For each group, at least 800 sperm from four mice were counted. (H) TUNEL assay of cauda epididymis sections from 4-month-old WT, Asb1-KO, and Asb1-KO + NaHS mice. Scale bar: 20 μm. (I) Quantification of (H). For each group, at least 400 sperm from four mice were counted. (J) Acridine orange staining of sperm in the cauda epididymis of WT, Asb1-KO, and Asb1-KO + NaHS mice aged 4 months. Scale bar: 50 μm. (K) Quantification of (J). For each group, at least 500 sperm from five mice were counted. Data are shown as means ± SD; one-way ANOVA with Dunnett’s post hoc test; ∗P < 0.05, ∗∗P < 0.01, ∗∗∗P < 0.001.
Fig. 9
Fig. 9
A proposed model for ASB1-regulated spermiogenesis in mouse testes. In WT mouse testes, ASB1 participates in the formation of the ECS ubiquitin ligase complex alongside Elongin B (ELOB). ASB1 primarily interacts with SQOR through its K218 and M429 residues, leading to the stimulation of K48-linked polyubiquitination of SQOR on lysine residues 207 and 344. This interaction facilitates the subsequent proteasomal degradation of SQOR, thereby maintaining redox homeostasis during spermiogenesis. In Asb1-KO testes, excessive SQOR accumulation occurs, resulting in an imbalance between oxidation and antioxidation. This imbalance eventually leads to sperm DNA damage and impaired spermatogenesis.

Similar articles

Cited by

References

    1. Agarwal A., Baskaran S., Parekh N., Cho C.L., Henkel R., Vij S., Arafa M., Panner Selvam M.K., Shah R. Male infertility. Lancet. 2021;397:319–333. - PubMed
    1. Dai C., Zhang Z., Shan G., Chu L.T., Huang Z., Moskovtsev S., Librach C., Jarvi K., Sun Y. Advances in sperm analysis: techniques, discoveries and applications. Nat. Rev. Urol. 2021;18:447–467. - PubMed
    1. Li L., Yuan Y., Sha J. Potential clinical value of in vitro spermatogenesisdagger. Biol. Reprod. 2022;107:95–100. - PubMed
    1. Gill K., Machalowski T., Harasny P., Kups M., Grabowska M., Duchnik E., Sipak O., Fraczek M., Kurpisz M., Kurzawa R., Piasecka M. Male infertility coexists with decreased sperm genomic integrity and oxidative stress in semen irrespective of leukocytospermia. Antioxidants. 2022;11 - PMC - PubMed
    1. Bisht S., Faiq M., Tolahunase M., Dada R. Oxidative stress and male infertility. Nat. Rev. Urol. 2017;14:470–485. - PubMed

Substances

LinkOut - more resources