. 2024 Dec 30;22(1):803.
doi: 10.1186/s12951-024-03070-7.

Targeting AURKA with multifunctional nanoparticles in CRPC therapy

Affiliations

Targeting AURKA with multifunctional nanoparticles in CRPC therapy

Bin Deng et al. J Nanobiotechnology. .

Abstract

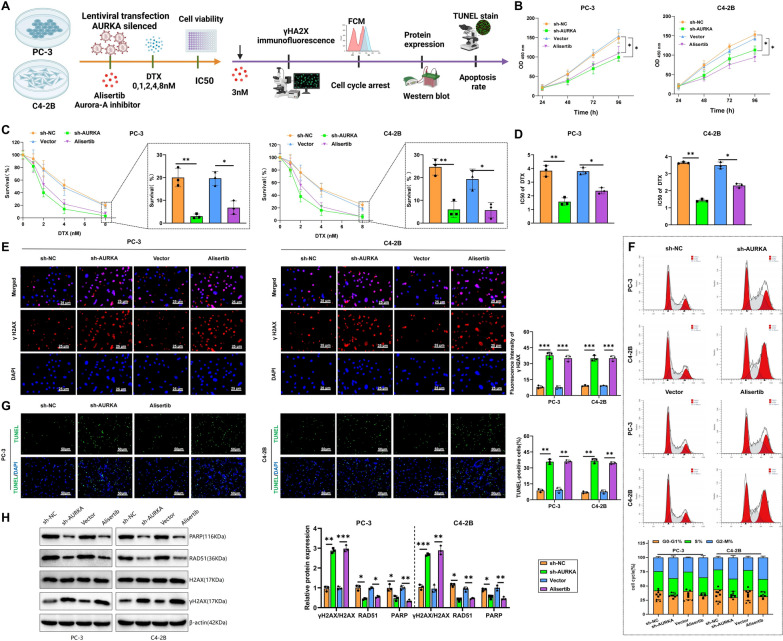
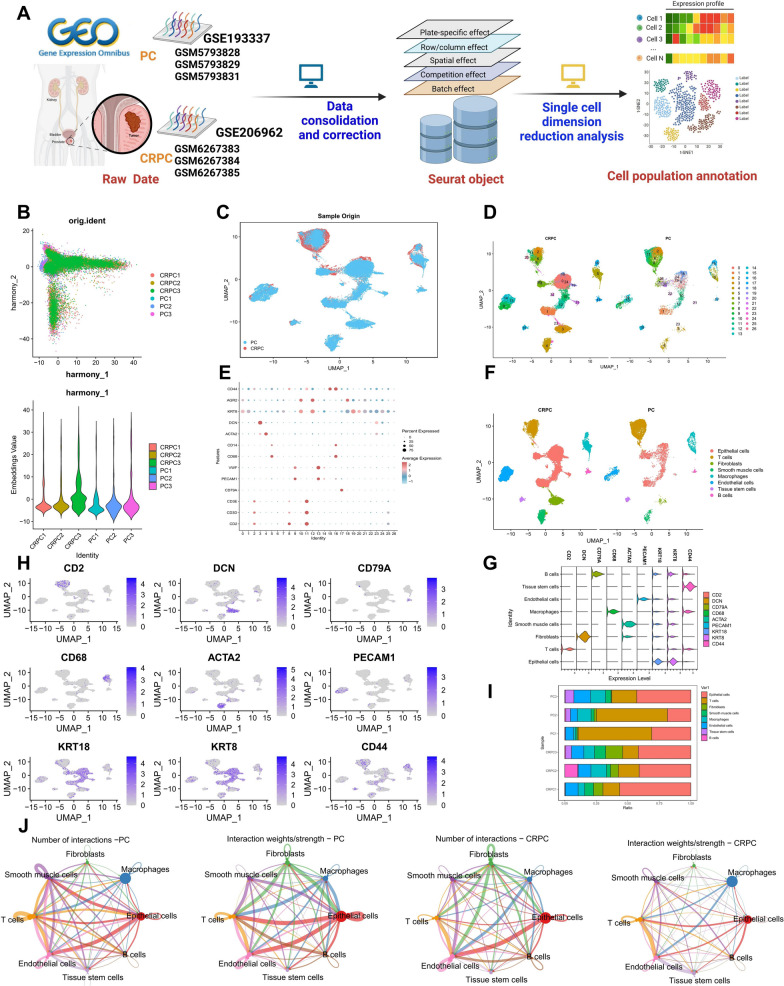
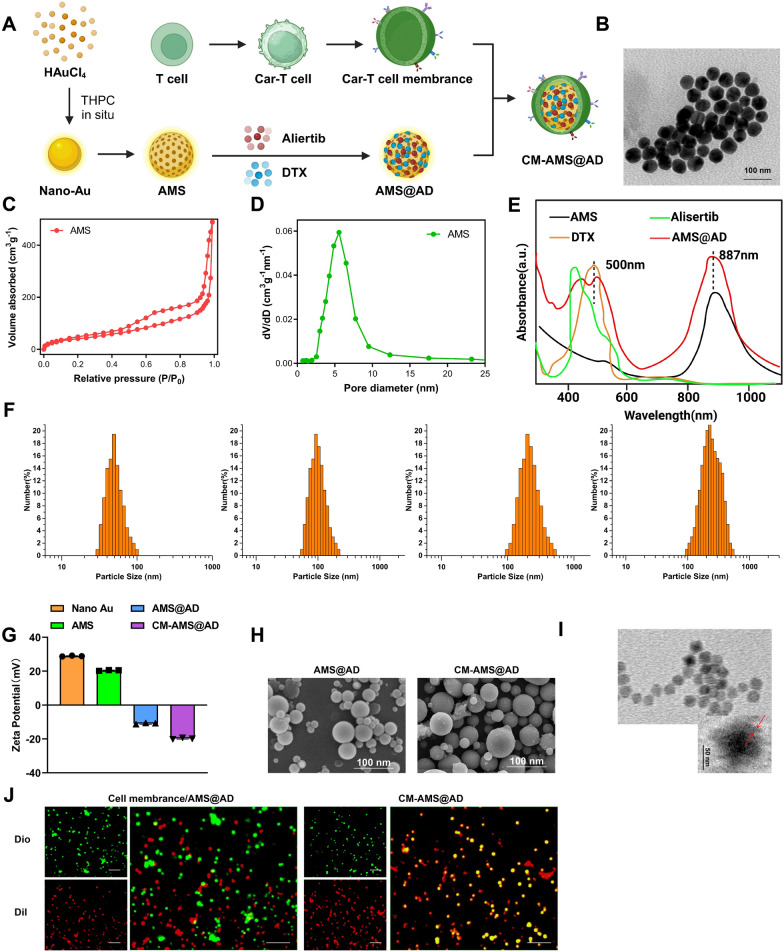
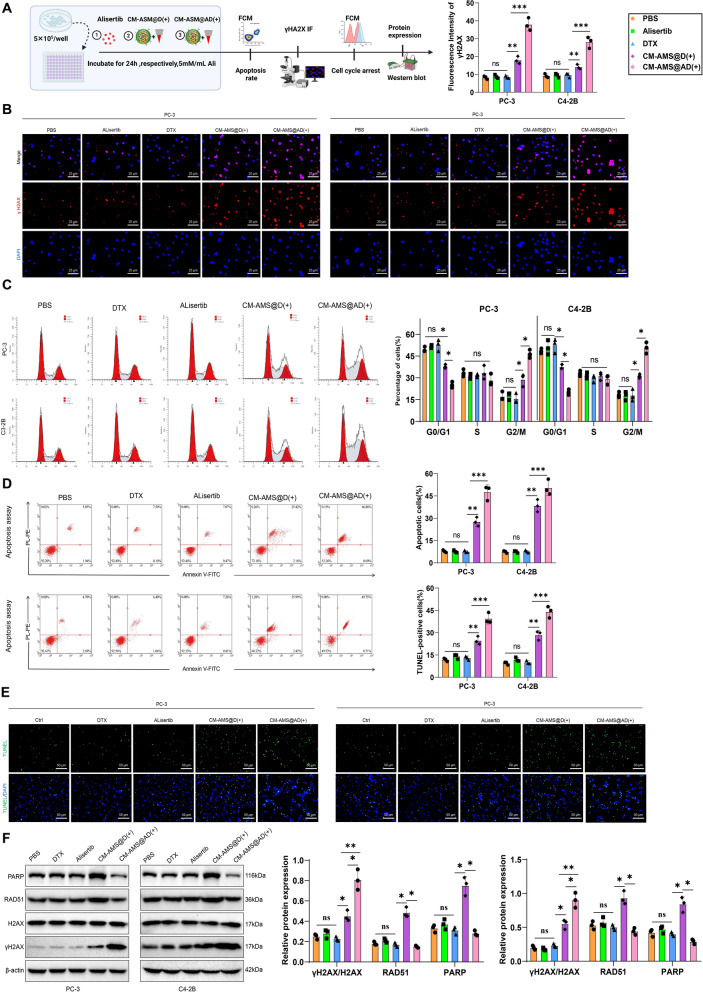
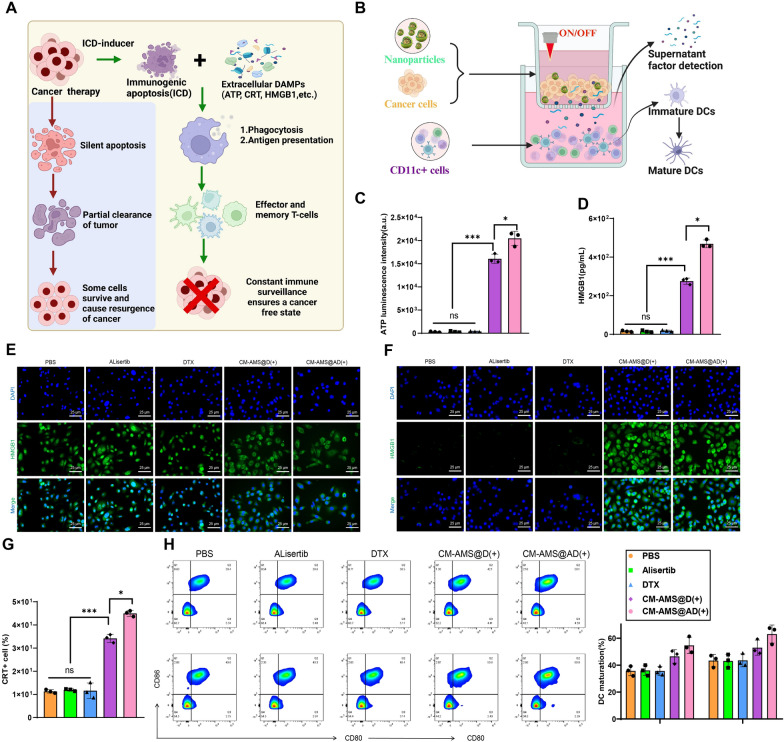
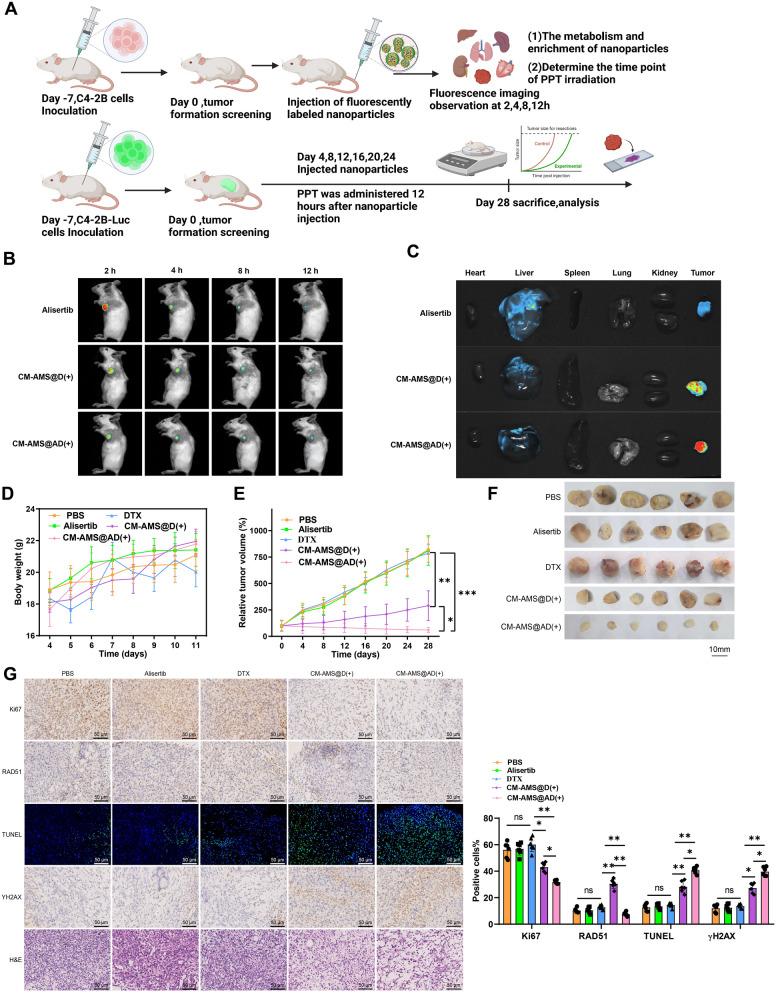
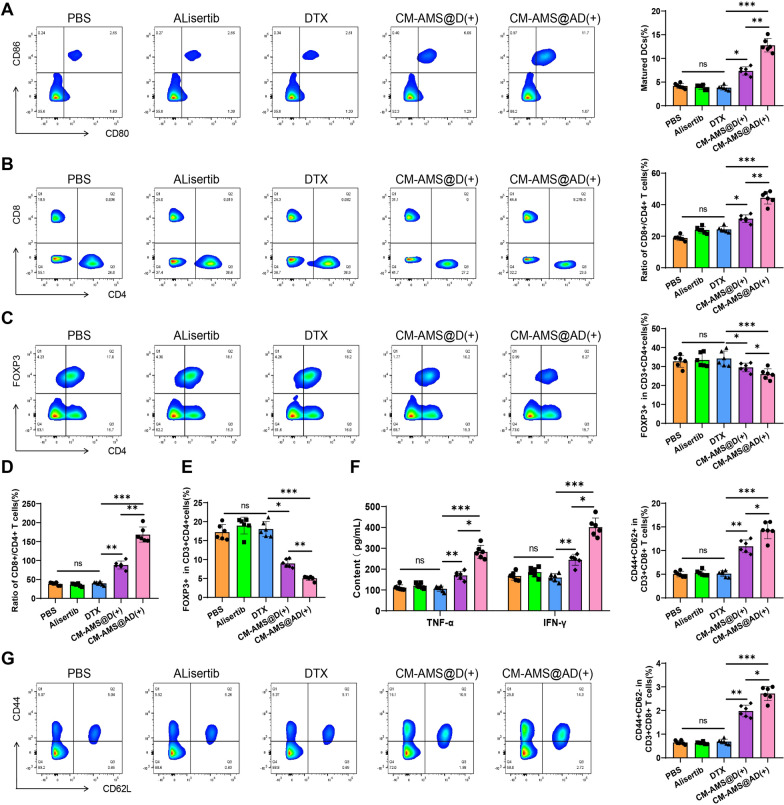
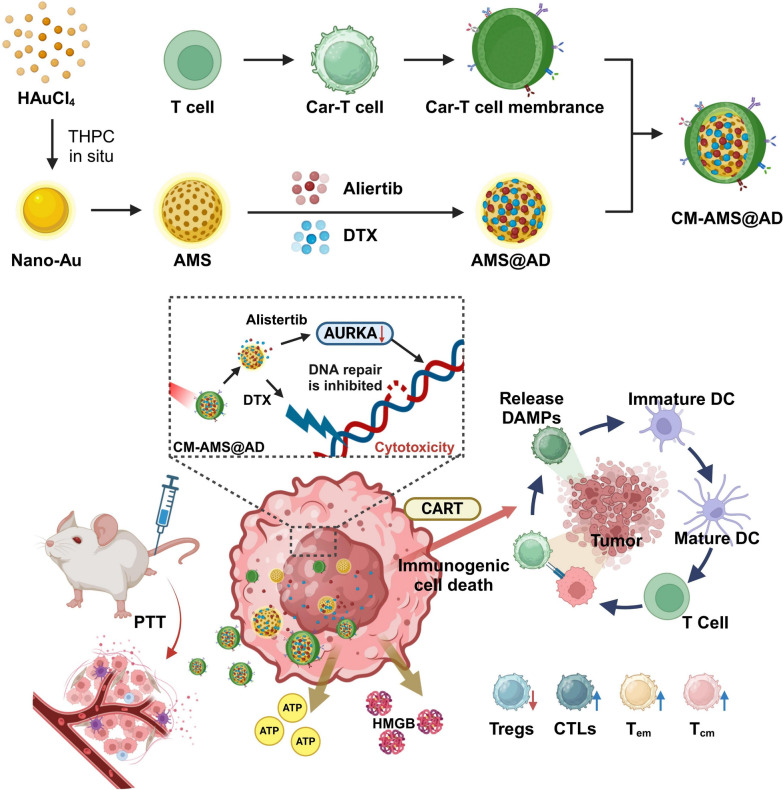
Castration-resistant prostate cancer (CRPC) presents significant therapeutic challenges due to its aggressive nature and poor prognosis. Targeting Aurora-A kinase (AURKA) has shown promise in cancer treatment. This study investigates the efficacy of ART-T cell membrane-encapsulated AMS@AD (CM-AMS@AD) nanoparticles (NPs) in a photothermal-chemotherapy-immunotherapy combination for CRPC. Bioinformatics analysis of the Cancer Genome Atlas-prostate adenocarcinoma (TCGA-PRAD) dataset revealed overexpression of AURKA in PCa, correlating with poor clinical outcomes. Single-cell RNA sequencing data from the GEO database showed a significant reduction in immune cells in CRPC. Experimentally, T cell membrane-biomimetic NPs loaded with the AURKA inhibitor Alisertib and chemotherapy drug DTX were synthesized and characterized by dynamic light scattering and transmission electron microscopy, showing good stability and uniformity (average diameter: 158 nm). In vitro studies demonstrated that these NPs inhibited CRPC cell proliferation, increased the G2/M cell population, and elevated apoptosis, confirmed by γH2AX expression. In vivo, CM-AMS@AD NPs accumulated in tumor tissues, significantly slowed tumor growth, decreased proliferation, increased apoptosis, and improved the immune environment, enhancing dendritic cell (DC) maturation and increasing CD8 + /CD4 + ratios. These findings suggest that CM-AMS@AD NPs offer a promising triple-combination therapy for CRPC, integrating photothermal, chemotherapy, and immunotherapy, with significant potential for future clinical applications.

Keywords: Aurora-A kinase (AURKA); Castration-resistant prostate cancer (CRPC); Chemotherapy; Immunotherapy; Nanoparticles; Photothermal therapy.


Conflict of interest statement

Declarations. Ethics approval and consent to participate: Study protocols were approved by the Ethics Committee of Ganzhou Hospital-Nanfang Hospital (Grant No.ZKY2023-107) and based on the ethical principles of the Declaration of Helsinki. The animal experiments were performed strictly per the guidelines in the Guide for the Care and Use of Laboratory Animals. The protocol of animal experiments was ratified by the Institutional Animal Care and Use Committee of Ganzhou Hospital-Nanfang Hospital (Grant No.DKY2023-019). Competing interests: The authors declare no competing interests.

Figures

Fig. 1
Fig. 1
Experimental Validation of Aurora-A Inhibiting DNA Damage Repair Process to Enhance DTX Chemotherapy Sensitivity in CRPC. A Schematic representation of the experimental procedure; B Impact of different treatments on the proliferation rate of PC-3 and C4-2B cells as detected by CCK-8 assay; C Cell viability after DTX treatment at different concentrations; D IC50 values of DTX in PC-3 and C4-2B cell lines after different treatments; E Immunofluorescence staining and quantitative analysis of γH2AX showing the level of DNA damage, bar = 25 μm; F Flow cytometry analysis of cell cycle distribution in different treatment groups; G TUNEL staining and quantitative analysis of apoptosis rate in different treatment groups, bar = 50 μm; H Western blot analysis of changes in protein expression levels in different treatment groups. Cell experiments were repeated three times, and values are presented as mean ± standard deviation, *P < 0.05, **P < 0.01, ***P < 0.001
Fig. 2
Fig. 2
Cell cluster analysis of scRNA-seq data. A Schematic representation of scRNA-seq analysis workflow; B Distribution of cells in PC_1 and PC_2 after Harmony batch correction, where each point represents a cell; C UMAP visualization of clustering results showing the aggregation and distribution of cells from PC samples in blue and CRPC samples in red; D UMAP visualization of clustering results displaying the aggregation and distribution of cells from different source samples, with each color representing a cluster; E Bubble plot showing the expression levels of different marker genes in each cluster, with larger bubbles indicating higher expression levels in red color; F Group visualization of cell annotations based on UMAP clustering; G Violin plot depicting the expression of 8 cell marker genes in different cell subgroups; H Expression profiles of 8 cell marker genes in various cell subgroups, where darker blue indicates higher average expression levels; I Proportional representation of different cell subgroups in each sample, with different colors representing various cell subgroup types; J Sankey plot illustrating cell communication networks in PC and CRPC samples, with line thickness indicating interaction strength
Fig. 3
Fig. 3
Construction and characterization of multifunctional NPs. A Schematic illustration of the preparation of multifunctional NPs; B Observation of AMS NPs morphology and size by transmission electron microscopy, scale bar = 100 nm; C, D Determination of surface area (C) and pore size (D) of AMS core–shell structure by isothermal adsorption; E Verification of successful preparation of AMS@AD by UV–visible spectroscopy; F Measurement of the hydrodynamic diameter of NPs by DLS; G Variation of NPs zeta potential; H Changes in surface morphology of NPs before and after cell membrane encapsulation observed by scanning electron microscopy, scale bar = 100 nm; I Observation of outer cell membrane encapsulation of CM-AMS@AD by transmission electron microscopy, scale bar = 50 nm; J Co-localization of cell membrane and NPs in CM-AMS@AD observed by CLSM, scale bar = 100 μm. Cell experiments were repeated three times
Fig. 4
Fig. 4
Experimental validation of CM-AMS@AD inhibiting DNA damage repair process and promoting apoptosis in CRPC cells. A Schematic illustration of the experimental procedure; B Immunofluorescence staining and quantitative analysis of γH2AX showing the level of DNA damage, scale bar = 25 μm; C Flow cytometry analysis of cell cycle distribution in different treatment groups; D Flow cytometry analysis of apoptosis changes in different groups of cells; E TUNEL staining and quantitative analysis to evaluate the apoptosis rate of cells in different treatment groups, scale bar = 50 μm; F Western blot analysis of changes in protein expression levels in different treatment groups. Cell experiments were repeated three times, and values are presented as mean ± standard deviation. “ns” indicates no significant difference, *P < 0.05, **P < 0.01, ***P < 0.001
Fig. 5
Fig. 5
Experimental validation of inducing immunogenic cell death and increasing immune response by combined therapy with CM-AMS@AD. A Schematic illustration of the mechanism of ICD initiation in the tumor treatment process; B Illustration of the experimental treatments; C Measurement of ATP levels in different treatment groups; D Measurement of HMGB1 levels in different treatment groups; E Co-localization microscopy observation of HMGB1 release in the nucleus and cytoplasm in different groups, scale bar = 25 μm; F, G Immunofluorescence detection of CRT expression in different treatment groups and statistical analysis, scale bar = 25 μm; H Flow cytometry analysis of mature DC content under different treatment conditions. Cell experiments were repeated three times, and values are presented as mean ± standard deviation. “ns” indicates no significant difference, *P < 0.05, **P < 0.01, ***P < 0.001
Fig. 6
Fig. 6
In vivo Antitumor Observation of Combined Therapy with CM-AMS@AD. A Schematic illustration of the in vivo experimental procedure; B In vivo fluorescence imaging of mice after injection of fluorescently labeled NPs; C Ex vivo fluorescence images of major organs (heart, liver, spleen, lung, kidney, and tumor) isolated from mice 12 h after intravenous injection of NPs; D Body weight curve of mice after different treatments; E Tumor growth curve of mice after different treatments; F Image of tumors removed on day 28; G Representative images of H&E staining and immunohistochemistry showing the effects of different therapeutic methods on tumor tissue immune fluorescence, Ki67 for cell proliferation, RAD51 staining for DNA damage repair, γH2AX staining for DNA damage, and TUNEL staining for cell apoptosis, scale bar = 50 μm. Each group consisted of 6 mice, and values are presented as mean ± standard deviation. “ns” indicates no significant difference, *P < 0.05, **P < 0.01, ***P < 0.001
Fig. 7
Fig. 7
In vivo Immunoreactivity Analysis of Co-treatment with CM-AMS@AD(+). A Analysis of the proportion of mature DCs in lymph nodes with flow cytometry under different treatments; B Analysis of the proportion of CD4+ and CD8+ cell subpopulations in the spleens of mice under different treatments using flow cytometry; C Analysis of the proportion of Treg cell subpopulations in the spleens of mice under different treatments using flow cytometry; D Analysis of CD4+ and CD8+ cell subpopulations in tumors under different treatments; E Quantitative analysis of Treg cell subpopulation proportions in tumors under different treatments using flow cytometry; F Determination of systemic cytokine levels in mice under different treatments; G Quantitative analysis of memory T cell populations in lymphoid tissues of different treatment groups using flow cytometry. Each group consisted of 6 mice, and values are presented as mean ± standard deviation. No significant difference (ns), *P < 0.05, **P < 0.01, ***P < 0.001
Fig. 8
Fig. 8
Application of CM-AMS@AD in the treatment of CRPC
None

Similar articles

References

    1. Li W, Huang T, Xu S, et al. Molecular mechanism of tanshinone against prostate cancer. Molecules. 2022;27(17):5594. 10.3390/molecules27175594. - PMC - PubMed
    1. Liu Z, Zhu X, Xu C, Min F, Yu G, Chen C. Ulinastatin ameliorates the malignant progression of prostate cancer cells by blocking the RhoA/ROCK/NLRP3 pathway. Drug Dev Res. 2023;84(1):36–44. 10.1002/ddr.22010. - PubMed
    1. Bourlon MT, Valdez P, Castro E. Development of PARP inhibitors in advanced prostate cancer. Ther Adv Med Oncol. 2024;16:17588359231221336. 10.1177/17588359231221337. - PMC - PubMed
    1. Oprea-Lager DE, MacLennan S, Bjartell A, et al. European Association of Nuclear Medicine Focus 5: consensus on molecular imaging and theranostics in prostate cancer. Eur Urol. 2024;85(1):49–60. 10.1016/j.eururo.2023.09.003. - PubMed
    1. Desai K, McManus JM, Sharifi N. Hormonal therapy for prostate cancer. Endocr Rev. 2021;42(3):354–73. 10.1210/endrev/bnab002. - PMC - PubMed

MeSH terms

LinkOut - more resources