. 2024 Dec 13:15:1497977.
doi: 10.3389/fphar.2024.1497977. eCollection 2024.

The combination of decitabine with multi-omics confirms the regulatory pattern of the correlation between DNA methylation of the CACNA1C gene and atrial fibrillation

Affiliations

The combination of decitabine with multi-omics confirms the regulatory pattern of the correlation between DNA methylation of the CACNA1C gene and atrial fibrillation

Yuling Yang et al. Front Pharmacol. .

Abstract

Background: Studies have shown that DNA methylation of the CACNA1C gene is involved in the pathogenesis of various diseases and the mechanism of drug action. However, its relationship with atrial fibrillation (AF) remains largely unexplored.

Objective: To investigate the association between DNA methylation of the CACNA1C gene and AF by combining decitabine (5-Aza-2'-deoxycytidine, AZA) treatment with multi-omics analysis.

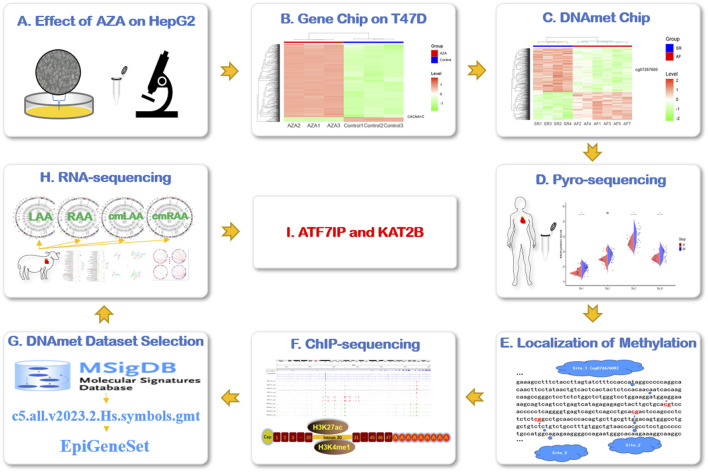
Methods: HepG2 cells were treated with AZA to observe the expression of the CACNA1C gene, which was further validated using gene expression microarrays. Pyrosequencing was employed to validate differentially methylated sites of the CACNA1C gene observed in DNA methylation microarrays. A custom DNA methylation dataset based on the MSigDB database was combined with ChIP-sequencing and RNA-sequencing data to explore the regulatory patterns of DNA methylation of the CACNA1C gene.

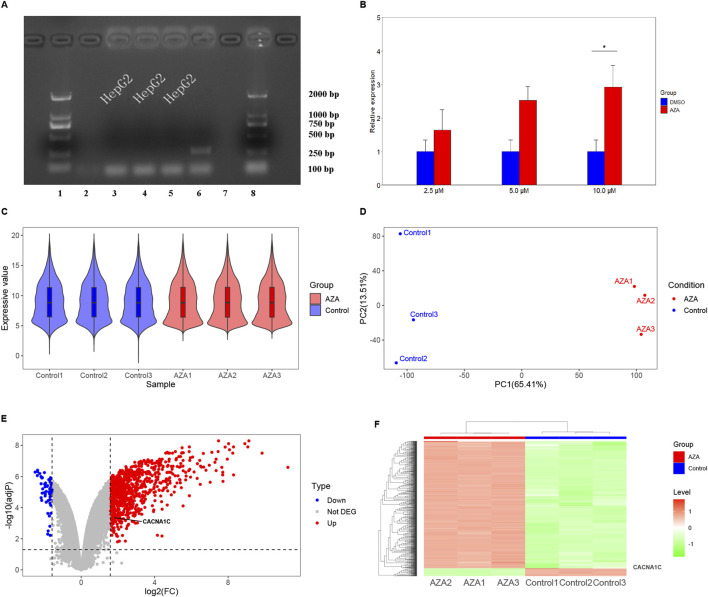
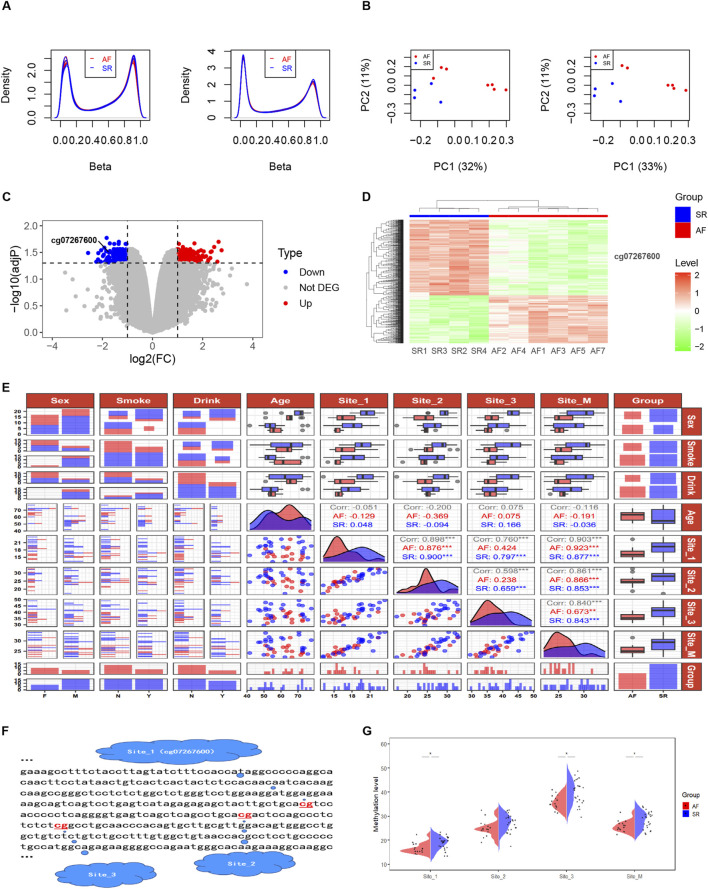
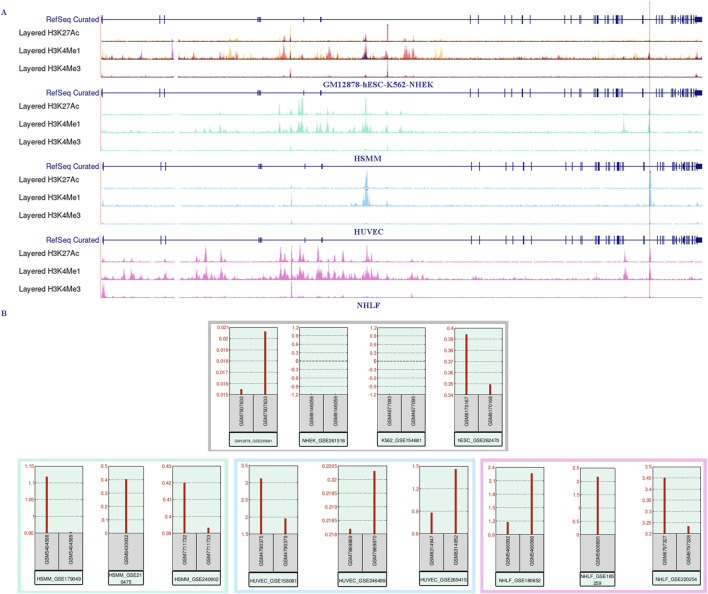
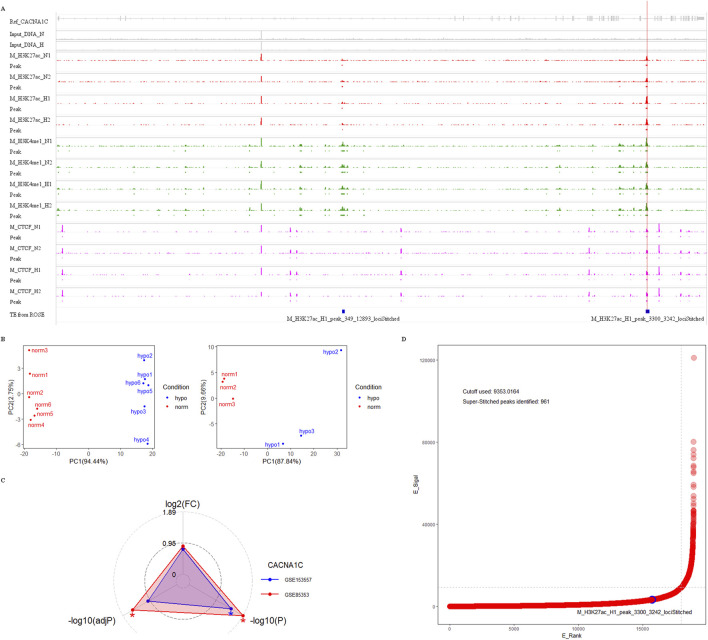
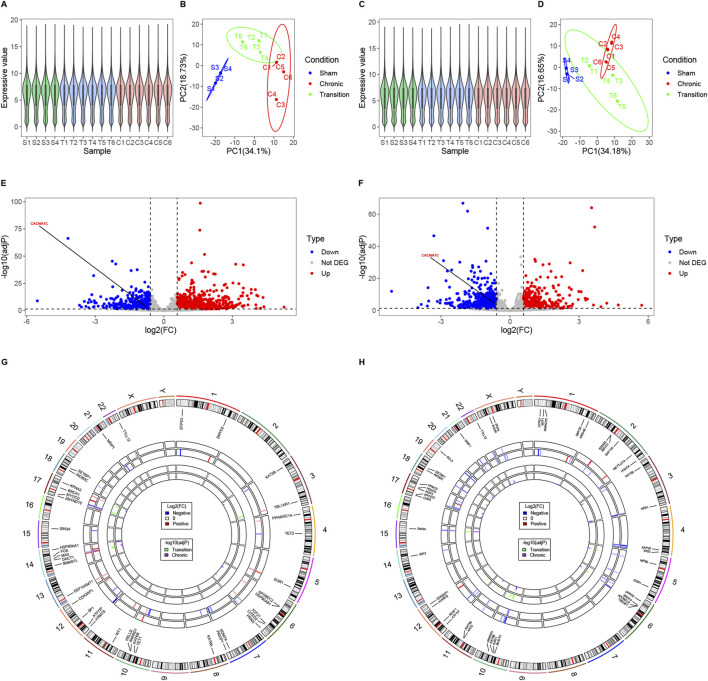
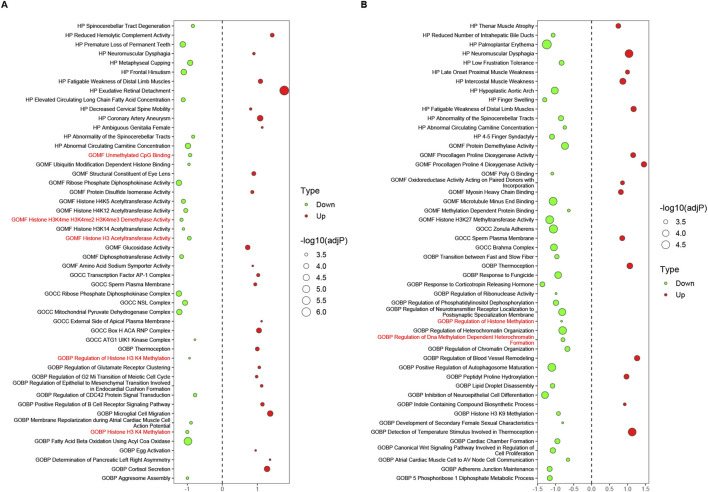
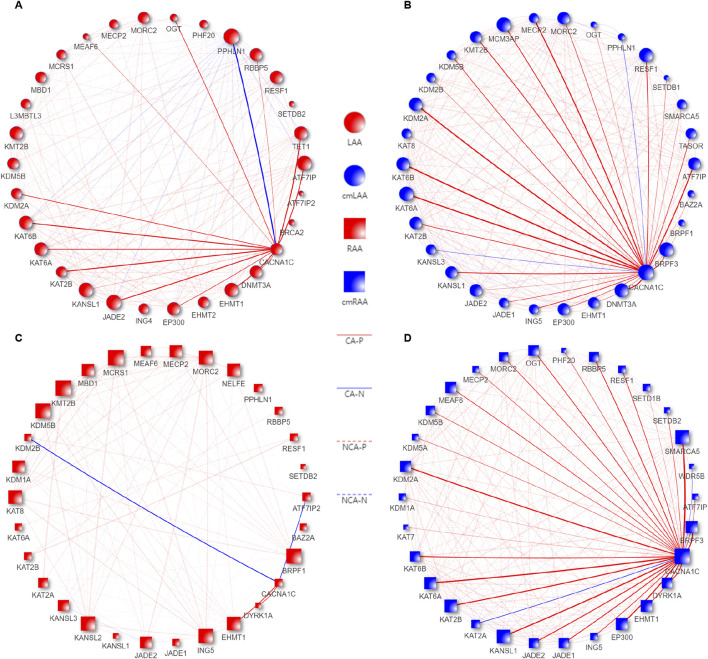
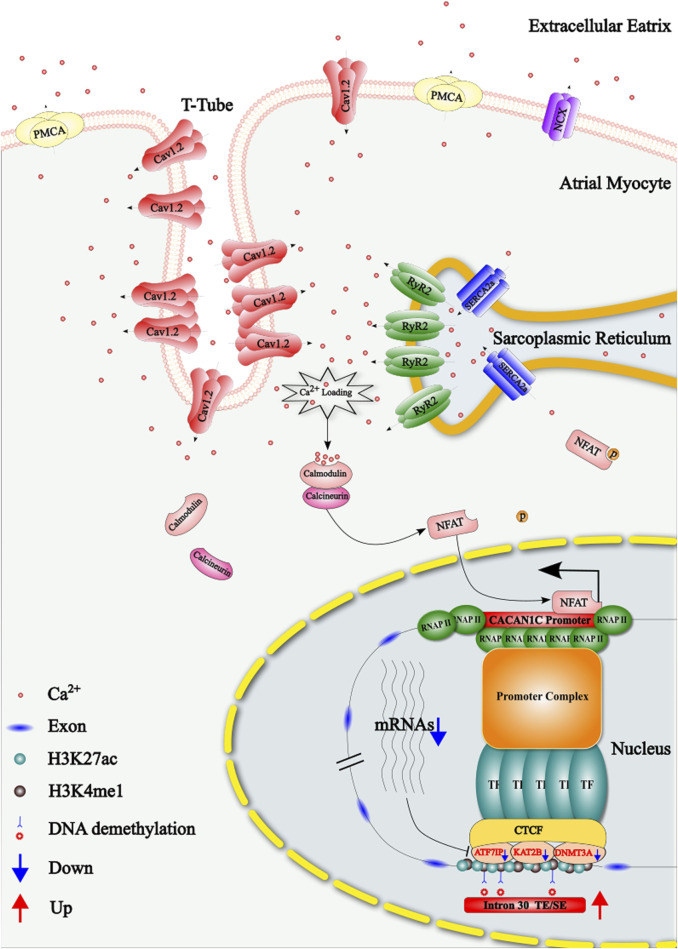
Results: Treatment of HepG2 cells with three different concentrations of AZA (2.5 µM, 5.0 µM, and 10.0 µM) resulted in 1.6, 2.5, and 2.9-fold increases in the mRNA expression of the CACNA1C gene, respectively, compared to the DMSO group, with statistical significance at the highest concentration group (p < 0.05). Similarly, AZA treatment of T47D cells showed upregulated mRNA expression of the CACNA1C gene in the gene expression microarray results (adj P < 0.05). DNA methylation microarray analysis revealed that methylation of a CpG site in intron 30 of the CACNA1C gene may be associated with AF (adj P < 0.05). Pyrosequencing of this site and its adjacent two CpG sites demonstrated significant differences in DNA methylation levels between AF and sinus rhythm groups (p < 0.05). Subsequent multivariate logistic regression models confirmed that the DNA methylation degree of these three sites and their average was associated with AF (p < 0.05). Additionally, the UCSC browser combined with ChIP-sequencing revealed that the aforementioned region was enriched in enhancer markers H3K27ac and H3K4me1. Differential expression and pathway analysis of RNA-sequencing data ultimately identified ATF7IP and KAT2B genes as potential regulators of the CACNA1C gene.

Conclusion: The DNA methylation levels at three CpG sites in intron 30 of the CACNA1C gene are associated with AF status, and potentially regulated by ATF7IP and KAT2B.

Keywords: DNA methylation; Pyro-sequencing; atrial fibrillation; calcium voltage-gated channel subunit alpha1 C; decitabine.


Conflict of interest statement

The authors declare that the research was conducted in the absence of any commercial or financial relationships that could be construed as a potential conflict of interest.

Figures

FIGURE 1
FIGURE 1
Research flowchart. (A) AZA interfered in HepG2 cells to observe the expression of CACNA1C gene. (B) The expression of CACNA1C gene was verified by gene expression profiling chip data (AZA-treated human breast ductal carcinoma cell line T47D). (C) To explore the possible AF-related DNA methylation sites of CACNA1C gene in DNA methylation chip dataset. (D) The degree of DNA methylation sites for CACNA1C gene was verified in the LAA of AF patients by pyrosequencing. (E) The locations of the three DNA methylation sites of interest. (F) The above three CpG locus regions were found to be strong concentrations of enhancer indicator signals H3K4me1 and H3K27ac in the ChIP-sequencing data set. (G) The C5 dataset of MSigDB database was used to customize the DNA methylation-related gene set EpiGeneSet for subsequent analysis. (H) The EpiGeneSet dataset combine RNA-sequencing data to explore network co-expression patterns with CACNA1C genes. (I) ATF7IP and KAT2B may be involved in the regulation of DNA methylation of CACNA1C gene. AZA: Decitabine, cmLAA: left atrial appendage for cardiac muscle cell; cmRAA: right atrial appendage for cardiac muscle cell; DNAmet: DNA methylation, LAA: left atrial appendage for cardiac muscle tissue; RAA: right atrial appendage for cardiac muscle tissue.
FIGURE 2
FIGURE 2
Observation of CACNA1C gene expression alteration in HepG2 and T47D cells induced by AZA using RT-qPCR methods and reanalysis of chip data from the GEO Database. (A) Mycoplasma detection was performed in HepG2 cells. On the x-axis, lanes 1 and eight represent the LD2000 DNA marker, lanes two and 7 represent the negative controls, lane 6 represents the positive control, and the remaining lanes three to five represent the HepG2 cells used for subsequent experiments. The y-axis indicates the specific positions of the DNA marker bands. (B) RT-qPCR results comparing three concentrations of AZA (2.5 µM, 5.0 µM, and 10.0 µM) treated HepG2 cells for 96 h with the control group (DMSO). (C) Violin plot showing the distribution of normalized data from all samples after hybridization of a genome expression profiling chip following AZA intervention in T47D cells. (D) Principal component analysis plot of the samples. (E) Volcano plot depicting the expression of the CACNA1C gene in T47D cells. (F) Heatmap showing the expression of the CACNA1C gene in T47D cells.
FIGURE 3
FIGURE 3
DNA methylation levels at three CpG sites in intron 30 of the CACNA1C gene correlate with AF. (A) Comparison of Beta values from DNA methylation chip data before and after normalization. (B) MDS analysis comparison before and after removal of sample AF6. (C) Volcano plot displaying differential enrichment of the CACNA1C gene DNA methylation probe cg07267600 between groups. (D) Heatmap showing differential enrichment of the CACNA1C gene DNA methylation probe cg07267600 between groups. (E) Data distribution and correlation diagram for clinical factors, Site_1, Site_2, Site_3, and Site_M. Categorical variables such as sex, smoke, and drink are presented using bar charts or stacked bar charts. Continuous variables including age and methylation levels at sequencing sites are represented by box plots and density plots, while correlations between groups are depicted by scatter plots. (F) Specific locations of the three CpG sites in intron 30 of the CACNA1C gene. (G) Violin plots illustrating the differences of DNA methylation levels at the three CpG sites in intron 30 of the CACNA1C gene between the AF and SR groups. * indicates statistically significant difference; Site_M represents the mean percentage of methylation levels at the three sites.
FIGURE 4
FIGURE 4
RNA-sequencing expression data shows a positive correlation with the enrichment of the enhancer marker H3K27ac near the three CpG sites in intron 30 of the CACNA1C gene. (A) The UCSC Genome Browser shows the enrichment of histone markers H3K27ac, H3K4me1, and H3K4me3 across seven different cell lines. The upper panel represents the lack of enrichment of the three histone markers in the GM12878, hESC, K562, and NHEK cell lines. The bottom three panels, in contrast, demonstrate strong enrichment of H3K27ac in the HSMM, HUVEC, and NHLF cell lines. The red vertical line marks the span of the three CpG sites. The ChIP-sequencing data was obtained from the UCSC Genome Browser. (B) CACNA1C gene expression levels observed from RNA-sequencing data in the same seven cell lines. The upper panel shows CACNA1C expression in GM12878, hESC, K562, and NHEK cell lines, while the lower panel presents expression data from HSMM, HUVEC, and NHLF cell lines. The RNA-sequencing data is sourced from the GEO database.
FIGURE 5
FIGURE 5
Genomic analysis of enhancer markers H3K27ac, H3K4me1, H3K4me3, and CTCF protein near three CpG sites in intron 30 of the CACNA1C gene. (A) Analysis of ChIP dataset GSE78113 using Integrative Genomics Viewer to observe the enrichment signals of the four markers near the three CpG sites. The dataset comes from MCF-7 cell lines under normal conditions (track names ending with N) and hypoxic conditions (track names ending with H). Four red tracks show H3K27ac enrichment signals, four green tracks show H3K4me1 enrichment signals, and four pink tracks show CTCF protein enrichment signals. Their corresponding enrichment peaks are shown in Peak tracks below each signal track, represented by rectangles filled with corresponding colors. Additionally, the top gray track shows the structure of the reference gene CACNA1C. The second and third tracks show enrichment signals from two Input DNAs, while the bottom blue track shows enhancer elements predicted using ROSE software. The letter M in track names represents the MCF-7 cell line. The red vertical line in the plot indicates the span of the three CpG sites. (B) Quality control of two RNA-sequencing datasets from MCF-7 cell lines. In the PCA analysis plots, red dots represent six normal samples, while blue dots represent hypoxic samples. The left dataset is from GEO GSE85358, and the right dataset is from GEO GSE153557. (C) Radar plot showing CACNA1C gene expression differences between normal and hypoxic groups in the above two RNA-sequencing datasets. The red triangle’s apex represents the fold change value of CACNA1C gene expression in GSE85358, the left base point represents the adjP value, and the right base point represents the P-value, while the blue triangle’s vertices represent the corresponding three values for GSE153557. (D) Distribution plot of TE/SE elements predicted by ROSE software in ChIP dataset sample M_H3K27ac_N1. The x-axis E_Rank represents the ranking of all enhancer signals, the y-axis E_Signal represents the difference between H3K27ac enrichment signal and Input DNA enrichment signal. The blue circle indicates the predicted TE in intron 30 of the CACNA1C gene, the horizontal dashed line represents the SE enrichment signal threshold: 9353.0164, and the vertical dashed line represents the SE rank threshold: 18014. TE: typical enhancer, SE: super-enhancer.
FIGURE 6
FIGURE 6
Examining potential epigenetic regulatory genes associated with the CACNA1C gene in LAA and cmLAA. (A) Violin plots of normalized samples from the three groups in LAA. S, T, and C on the x-axis represent the Sham group, Transition group, and Chronic group, respectively. (B) Principal component analysis plot of the three groups in LAA. (C) Violin plots of normalized samples from the three groups in cmLAA. (D) Principal component analysis plot of the three groups in cmLAA. (E) Volcano plot showing differentially expressed genes in the Chronic group of LAA. Red dots represent upregulated genes, while blue dots represent downregulated genes. (F) Volcano plot showing differentially expressed genes in the Chronic group of cmLAA. (G) Log2(FC) changes and -log10 (adjP) values of differentially expressed EpiGeneSet genes in the Transition and Chronic groups of LAA. The circle plot has seven tracks from the outer to the inner. Track 1: Chromosome scale; Track 2: Chromosome band staining; Track 3: Labels of EpiGeneSet genes with intergroup differences; Track 4: Log2(FC) changes between Sham and Transition groups, with red gradients indicating upregulation and blue gradients indicating downregulation; Track 5: Log2(FC) changes between Sham and Chronic groups; Tracks 6 and 7: log10 (adjP) values for the Sham-Transition and Sham-Chronic comparisons, respectively. (H) Log2(FC) changes and -log10 (adjP) values of differentially expressed EpiGeneSet genes in the Transition and Chronic groups of cmLAA. Data were derived from RNA-sequencing of sheep AF model using left atrial appendage rapid pacing. cmLAA: left atrial appendage for cardiac muscle cell; LAA: left atrial appendage for cardiac muscle tissue.
FIGURE 7
FIGURE 7
Epigenetic regulatory pathways potentially related to the CACNA1C gene during the chronic phase, observed in LAA and cmLAA. (A) Bubble plot of all pathways in EpiPathway50 for LAA. The bubble size represents -log10 (adjP), where red bubbles indicate upregulated pathways, and green bubbles indicate downregulated pathways. The size of the bubbles reflects the intensity of differences between groups, with red-labeled pathways on the Y-axis signifying potential epigenetic regulatory pathways associated with the CACNA1C gene. (B) Bubble plot of all pathways in EpiPathway50 for cmLAA. cmLAA: left atrial appendage for cardiac muscle cell; LAA: left atrial appendage for cardiac muscle tissue.
FIGURE 8
FIGURE 8
Co-expression pattern diagrams of EpiPathwaySet genes and the CACNA1C gene in the Chronic groups of LAA, RAA, cmLAA, and cmRAA. (A) Co-expression pattern diagram of EpiPathwaySet genes and the CACNA1C gene in LAA. (B) Co-expression pattern diagram of EpiPathwaySet genes and the CACNA1C gene in cmLAA. (C) Co-expression pattern diagram of EpiPathwaySet genes and the CACNA1C gene in RAA. (D) Co-expression pattern diagram of EpiPathwaySet genes and the CACNA1C gene in cmRAA. The size of the nodes represents the number of edges connected to them, with red nodes representing myocardial tissue, blue nodes representing cardiomyocytes, circular nodes representing the left atrial appendage, and square nodes representing the right atrial appendage. CA-N: Solid blue lines represent the degree of negative correlation between EpiPathwaySet genes and the CACNA1C gene; CA-P: Solid red lines represent the degree of positive correlation between EpiPathwaySet genes and the CACNA1C gene; cmLAA: left atrial appendage for cardiac muscle cell; cmRAA: right atrial appendage for cardiac muscle cell; NCA-N: Dashed blue progressive lines represent the degree of negative correlation between EpiPathwaySet genes; NCA-P: Dashed red progressive lines represent the degree of positive correlation between EpiPathwaySet genes; LAA: left atrial appendage for cardiac muscle tissue; RAA: right atrial appendage for cardiac muscle tissue.
FIGURE 9
FIGURE 9
Schematic representation of the regulatory mechanism by which the DNA methylation of three CpG sites in intron 30 of the CACNA1C gene influences the reduction of Cav1.2 protein during atrial fibrillation (AF). TE: Typical Enhancer; SE: Super Enhancer.

Similar articles

References

    1. Alvarez-Franco A., Rouco R., Ramirez R. J., Guerrero-Serna G., Tiana M., Cogliati S., et al. (2021). Transcriptome and proteome mapping in the sheep atria reveal molecular featurets of atrial fibrillation progression. Cardiovasc Res. 117 (7), 1760–1775. 10.1093/cvr/cvaa307 - DOI - PMC - PubMed
    1. Andersen J. H., Andreasen L., Olesen M. S. (2021). Atrial fibrillation-a complex polygenetic disease. Eur. J. Hum. Genet. 29 (7), 1051–1060. 10.1038/s41431-020-00784-8 - DOI - PMC - PubMed
    1. Ariazi E. A., Taylor J. C., Black M. A., Nicolas E., Slifker M. J., Azzam D. J., et al. (2017). A new role for ERα: silencing via DNA methylation of basal, stem cell, and EMT genes. Mol. Cancer Res. 15 (2), 152–164. 10.1158/1541-7786.MCR-16-0283 - DOI - PMC - PubMed
    1. Assum I., Krause J., Scheinhardt M. O., Muller C., Hammer E., Borschel C. S., et al. (2022). Tissue-specific multi-omics analysis of atrial fibrillation. Nat. Commun. 13 (1), 441. 10.1038/s41467-022-27953-1 - DOI - PMC - PubMed
    1. Binas S., Knyrim M., Hupfeld J., Kloeckner U., Rabe S., Mildenberger S., et al. (2020). miR-221 and -222 target CACNA1C and KCNJ5 leading to altered cardiac ion channel expression and current density. Cell Mol. Life Sci. 77 (5), 903–918. 10.1007/s00018-019-03217-y - DOI - PMC - PubMed

LinkOut - more resources