An Abrupt Decline in Global Terrestrial Water Storage and Its Relationship with Sea Level Change
- PMID: 39734429
- PMCID: PMC11671563
- DOI: 10.1007/s10712-024-09860-w
An Abrupt Decline in Global Terrestrial Water Storage and Its Relationship with Sea Level Change
Abstract
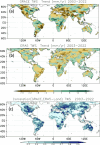
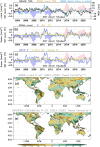
As observed by the Gravity Recovery and Climate Experiment (GRACE) and GRACE Follow On (GRACE-FO) missions, global terrestrial water storage (TWS), excluding ice sheets and glaciers, declined rapidly between May 2014 and March 2016. By 2023, it had not yet recovered, with the upper end of its range remaining 1 cm equivalent height of water below the upper end of the earlier range. Beginning with a record-setting drought in northeastern South America, a series of droughts on five continents helped to prevent global TWS from rebounding. While back-to-back El Niño events are largely responsible for the South American drought and others in the 2014-2016 timeframe, the possibility exists that global warming has contributed to a net drying of the land since then, through enhanced evapotranspiration and increasing frequency and intensity of drought. Corollary to the decline in global TWS since 2015 has been a rise in barystatic sea level (i.e., global mean ocean mass). However, we find no evidence that it is anything other than a coincidence that, also in 2015, two estimates of barystatic sea level change, one from GRACE/FO and the other from a combination of satellite altimetry and Argo float ocean temperature measurements, began to diverge. Herein, we discuss both the mechanisms that account for the abrupt decline in terrestrial water storage and the possible explanations for the divergence of the barystatic sea level change estimates.
Supplementary information: The online version contains supplementary material available at 10.1007/s10712-024-09860-w.
Keywords: Climate change; GRACE; Sea level; Terrestrial water storage.
© The Author(s) 2024.
Conflict of interest statement
Conflict of interestThe authors declare no competing interests.
Figures


Similar articles
-
Barystatic sea level change observed by satellite gravimetry: 1993-2022.Proc Natl Acad Sci U S A. 2025 Jul 8;122(27):e2425248122. doi: 10.1073/pnas.2425248122. Epub 2025 Jun 30. Proc Natl Acad Sci U S A. 2025. PMID: 40587797 Free PMC article.
-
Revisiting sea-level budget by considering all potential impact factors for global mean sea-level change estimation.Sci Rep. 2022 Jun 17;12(1):10251. doi: 10.1038/s41598-022-14173-2. Sci Rep. 2022. PMID: 35715517 Free PMC article.
-
Origin of interannual variability in global mean sea level.Proc Natl Acad Sci U S A. 2020 Jun 23;117(25):13983-13990. doi: 10.1073/pnas.1922190117. Epub 2020 Jun 8. Proc Natl Acad Sci U S A. 2020. PMID: 32513709 Free PMC article.
-
Applications and Challenges of GRACE and GRACE Follow-On Satellite Gravimetry.Surv Geophys. 2022;43(1):305-345. doi: 10.1007/s10712-021-09685-x. Epub 2022 Jan 9. Surv Geophys. 2022. PMID: 35535258 Free PMC article. Review.
-
Using Satellite-Based Terrestrial Water Storage Data: A Review.Surv Geophys. 2023;44(5):1489-1517. doi: 10.1007/s10712-022-09754-9. Epub 2023 Jan 13. Surv Geophys. 2023. PMID: 37771629 Free PMC article. Review.
Cited by
-
Barystatic sea level change observed by satellite gravimetry: 1993-2022.Proc Natl Acad Sci U S A. 2025 Jul 8;122(27):e2425248122. doi: 10.1073/pnas.2425248122. Epub 2025 Jun 30. Proc Natl Acad Sci U S A. 2025. PMID: 40587797 Free PMC article.
-
Unprecedented continental drying, shrinking freshwater availability, and increasing land contributions to sea level rise.Sci Adv. 2025 Jul 25;11(30):eadx0298. doi: 10.1126/sciadv.adx0298. Epub 2025 Jul 25. Sci Adv. 2025. PMID: 40712030 Free PMC article.
-
Limited evidence that tropical inundation and precipitation powered the 2020-2022 methane surge.Commun Earth Environ. 2025;6(1):450. doi: 10.1038/s43247-025-02438-3. Epub 2025 Jun 10. Commun Earth Environ. 2025. PMID: 40510550 Free PMC article.
References
-
- Allan RP, Barlow M, Byrne MP et al (2020) Advances in understanding large-scale responses of the water cycle to climate change. Ann N Y Acad Sci 1472:49–75. 10.1111/nyas.14337 - PubMed
-
- Allan RP, Willett KM, John VO, Trent T (2022) Global changes in water vapor 1979–2020. JGR Atmos 127:e2022JD036728. 10.1029/2022JD036728
-
- Andrews T, Bodas-Salcedo A, Gregory JM et al (2022) On the effect of historical SST patterns on radiative feedback. JGR Atmos 127:e2022JD036675. 10.1029/2022JD036675
-
- Argo (2023) Argo float data and metadata from Global Data Assembly Centre (Argo GDAC)
-
- Barnoud A, Pfeffer J, Guérou A et al (2021) Contributions of altimetry and argo to non-closure of the global mean sea level budget since 2016. Geophys Res Lett 48:e2021GL092824. 10.1029/2021GL092824
Publication types
LinkOut - more resources
Full Text Sources
Research Materials
