. 2022 Oct 25;4(6):1557-1567.
doi: 10.1016/j.fmre.2022.10.006. eCollection 2024 Nov.

Autophagy mediated tubulobulbar complex components degradation is required for spermiation

Affiliations

Autophagy mediated tubulobulbar complex components degradation is required for spermiation

Liying Wang et al. Fundam Res. .

Abstract

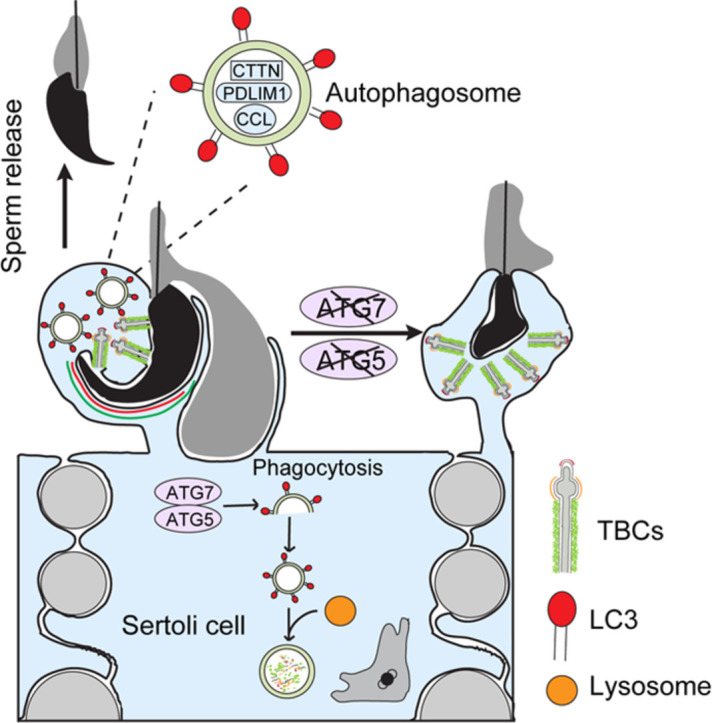
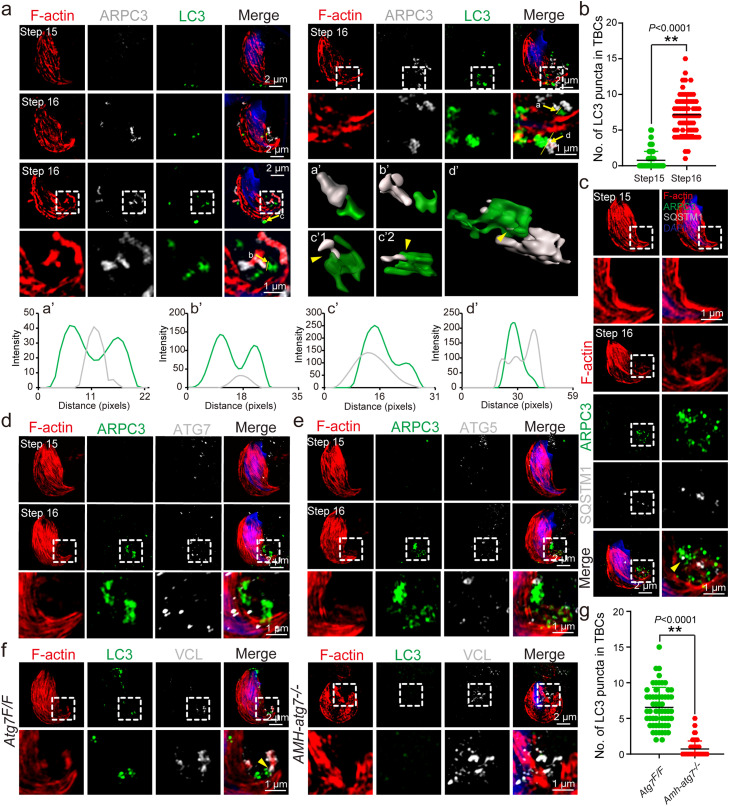
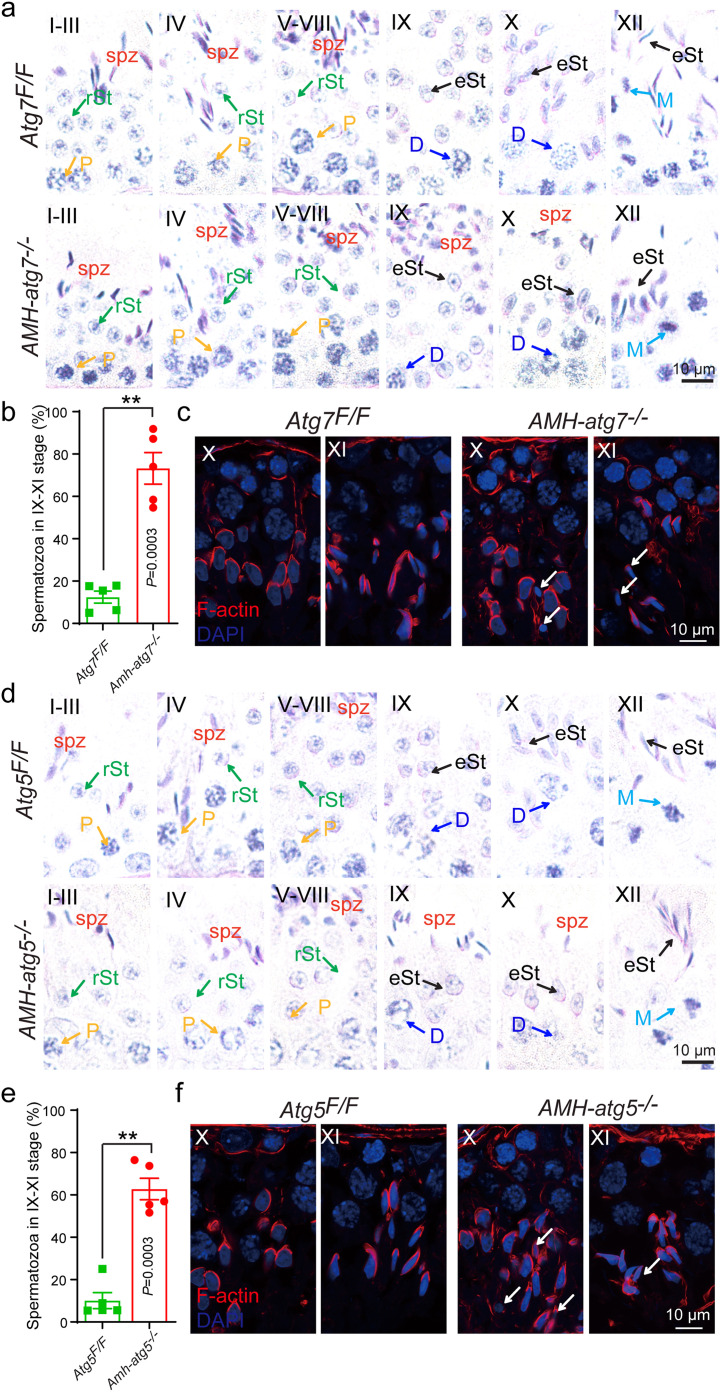
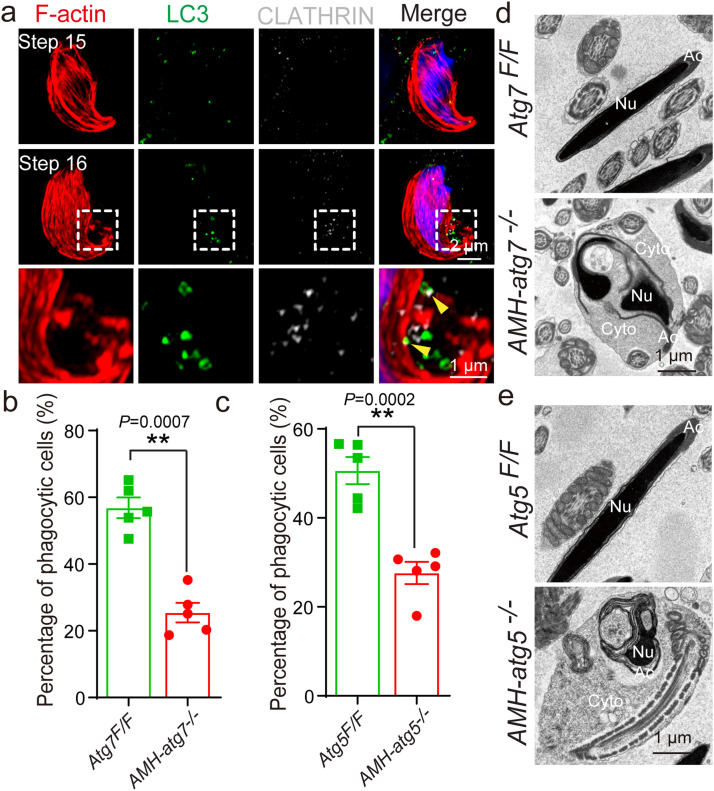
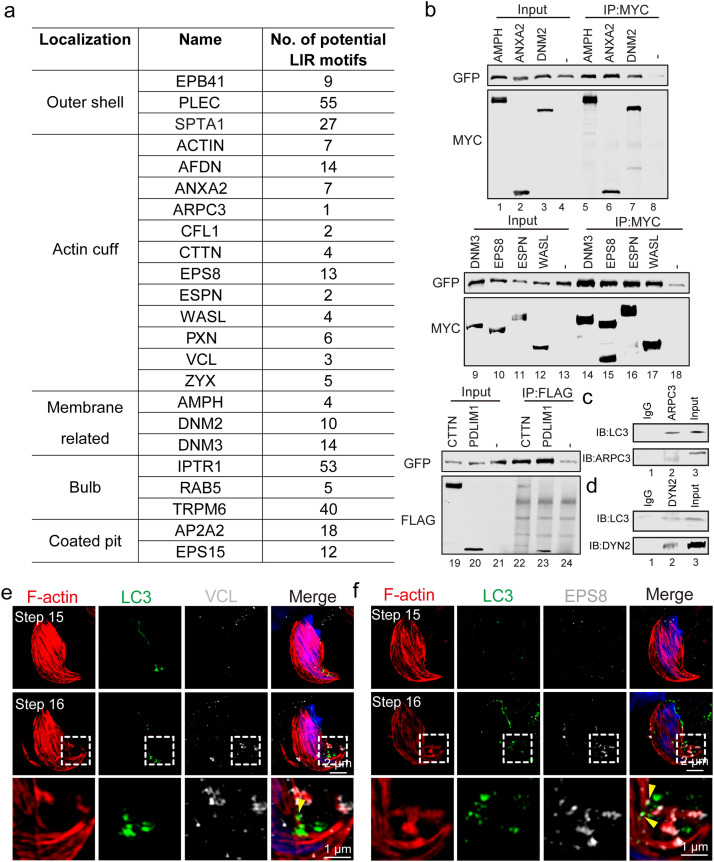
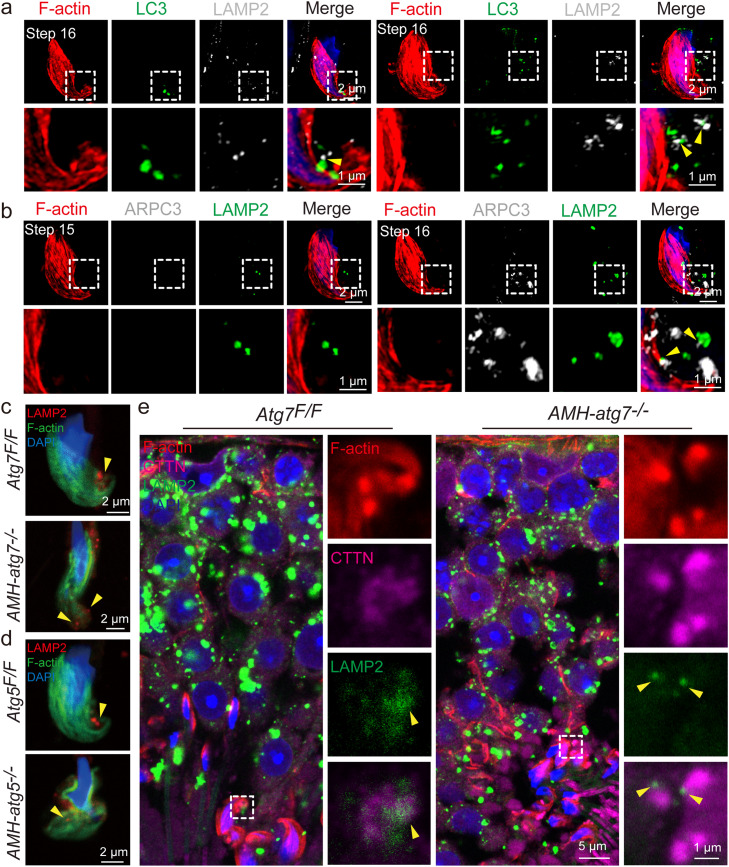
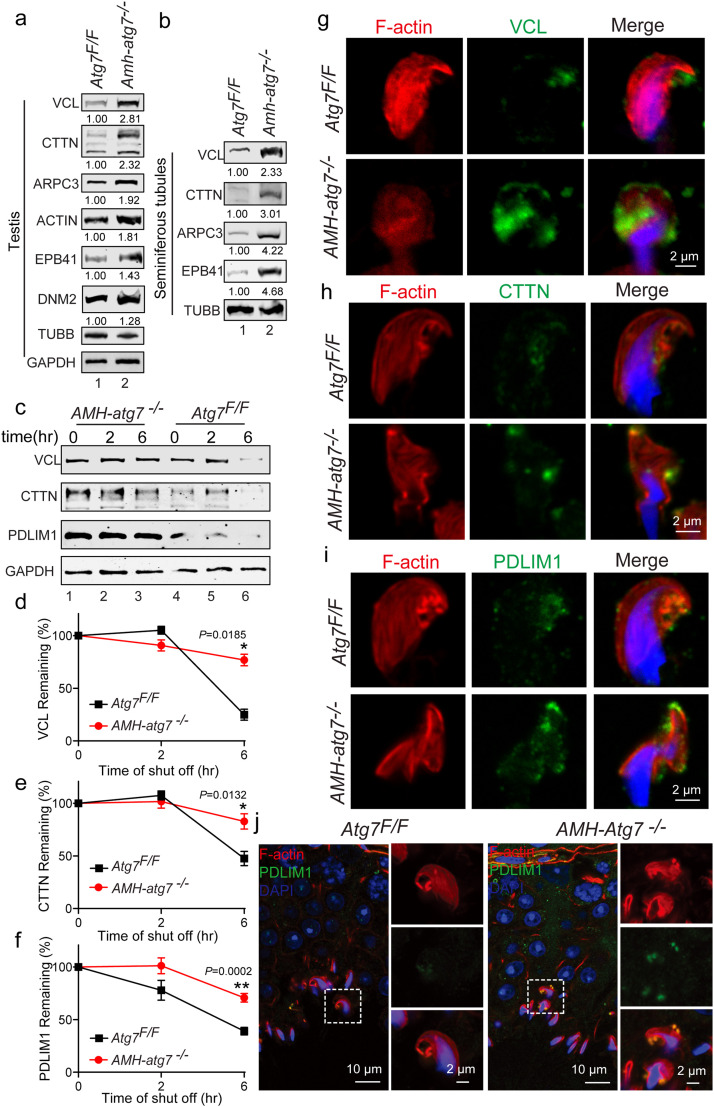
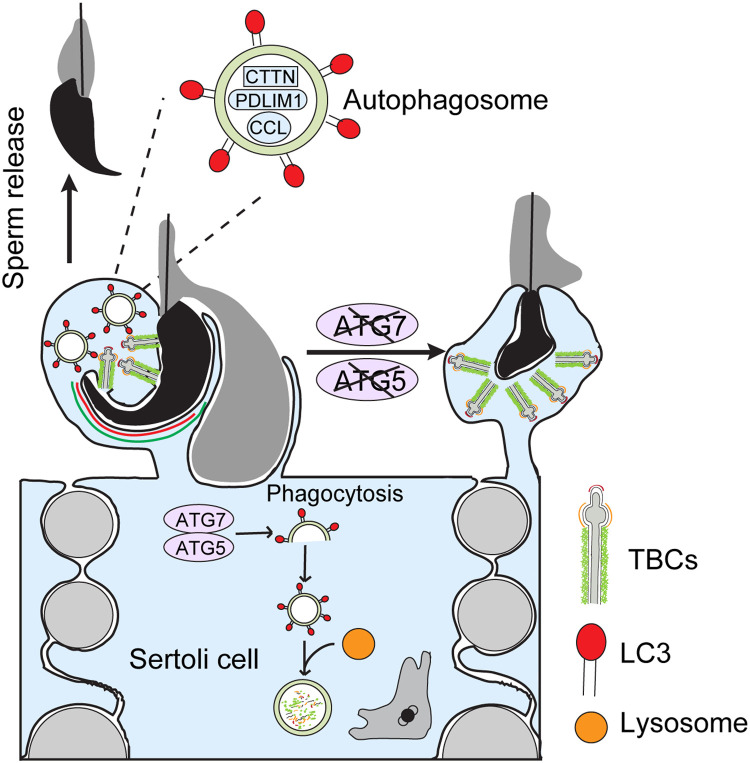
Spermiation is the process that releases mature spermatids from Sertoli cells into the lumen of the seminiferous tubule. Tubulobulbar complexes (TBCs) are elaborate cytoskeleton-related structures that are indispensable for spermiation. Despite well-defined ultrastructural events, the molecular regulation of TBCs during spermiation remains largely unknown. Here, we show that autophagy is active in TBC regions, and impaired autophagy in Sertoli cells affects spermiation. Further studies demonstrated that many TBC components bound to LC3 and could be selectively degraded through the autophagy-lysosome pathway. Perturbed autophagy impaired the degradation of some TBC components in Sertoli cells, such as VCL and CTTN, and led to the accumulation of TBC components surrounding the spermatid head, which may be associated with the sperm-releasing defect. Together, our results reveal that autophagy is essential for the TBC components degradation in mouse Sertoli cells and define a functional role of autophagy during spermiation.

Keywords: Autophagy; Cytoskeleton degradation; Lysosome; Sertoli cells; Spermiation; Tubulobulbar complexes.


Conflict of interest statement

The authors declare that they have no conflicts of interest in this work.

Figures

Image, graphical abstract
Graphical abstract
Fig 1
Fig. 1
Autophagy is active near tubulobulbar complexes. (a) The punctate LC3 signal could be observed in areas containing TBCs. Super-Resolution microscopy images of phalloidin (red), LC3 (green), ARPC3 (white), and nuclei (blue) in spermatids attached with parts of Sertoli cells. Arrowheads indicate the co-localization regions between ARPC3 and LC3. Arrows indicate the regions of the 3D model reconstituted using IMARIS software. Line-scan analysis (yellow lines) using ImageJ software (bottom). (b) Quantification of the number of LC3 puncta in step-15 spermatids (green dots, n = 65 independent experiments from 4 wild-type mice) and step-16 spermatids (red dots, n = 65 independent experiments from 4 wild-type mice) TBCs. Data are presented as the mean ± SEM. two-tailed Student's t-test; **P < 0.01. (c) The SQSTM1 signal could be observed in TBCs. Super-Resolution microscopy images of phalloidin (red), ARPC3 (green), SQSTM1 (white), and nuclei (blue) in spermatids attached with part of Sertoli cells. Arrowheads indicate the co-localization regions between ARPC3 and SQSTM1. (d) and (e) The ATG7 and ATG5 signal could be observed in the TBCs. Super-Resolution microscopy images of phalloidin (red), ARPC3 (green), nuclei (blue), and ATG7 (white) (d) or ATG5 (white) (e) in spermatids attached with part of Sertoli cells. (f) The punctate LC3 signal in TBCs is associated with the autophagy pathway in Sertoli cells. Super-Resolution microscopy images of phalloidin (red), LC3 (green), VCL (white), and nuclei (blue) in spermatids attached with part of Sertoli cells obtained from Atg7Flox/Flox and AMH-atg7−/−mice. Nuclei (blue) were stained by using DAPI. (g) Quantification of the number of LC3 puncta in Atg7Flox/Flox TBCs (green dots, n = 57 independent experiments from 4 mice) and AMH-atg7−/− (red dots, n = 57 independent experiments from 4 mice) TBCs. Data are presented as the mean ± SEM. two-tailed Student's t test; **P < 0.01.
Fig 2
Fig. 2
Impaired autophagy affects spermiation. (a,d) Suppressed autophagy in mouse Sertoli cell influences spermiation. PAS-hematoxylin staining was conducted by using Atg7Flox/Flox and AMH-atg7−/−testes (a), and Atg5Flox/Flox and AMH-atg5−/−testes (d). P indicates the pachytene spermatocyte, D indicates the diplotene spermatocyte, rST indicates the round spermatid, eST indicates the elongating spermatid, M indicates the meiotic spermatocyte, and spz indicates the spermatozoon. (b,e) The proportion of condensed spermatozoa that were retained at stages IX through XI in seminiferous tubules collected from Atg7Flox/Flox (n = 5 mice) and AMH-atg7−/−(n = 5 mice) male mice (b), and Atg5Flox/Flox (n = 5 mice) and AMH-atg5−/− (n = 5 mice) male mice (e). Data are presented as the mean ± SEM. two-tailed Student's t-test; **P < 0.01. (c,f) Impaired autophagy in Sertoli cells affects removal of specialized adhesion junctions surrounding the sperm head. Immunofluorescence staining for apical ES using phalloidin (red), and nuclei (blue) was conducted in seminiferous tubules collected from Atg7Flox/Flox and AMH-atg7−/− male mice (c) and Atg5Flox/Flox and AMH-atg5−/− male mice (f). Arrows indicated spermatozoa.
Fig 3
Fig. 3
Impaired autophagy affects phagocytosis in Sertoli cells. (a) The punctate LC3 signal could partially colocalize with CLATHRIN in TBCs. Super-Resolution microscopy images of phalloidin (red), LC3 (green), CLATHRIN (white), and nuclei (blue) in spermatids attached with part of Sertoli cell regions. Arrowheads indicate the co-localization regions between ARPC3 and LC3. (b) and (c) Suppressed autophagy perturbed the phagocytosis in mouse Sertoli cells. Quantitative proportion of latex-bead positive Sertoli cells isolated from Atg7Flox/Flox (n = 5 mice) and AMH-atg7−/− (n = 5 mice) male mice (b), Atg5Flox/Flox (n = 5 mice) and AMH-atg5−/− (n = 5 mice) male mice (c). Data are presented as the mean ± SEM. two-tailed Student's t-test; **P < 0.01. (d) and (e) Ultrastructure of autophagy-deficient caudal epididymis showing spermatid cytoplasm removing defect in AMH-atg7−/− (d) and AMH-atg5−/− (e) spermatozoa. Nu: nuclear, Ac: acrosome, Cyto: cytoplasm.
Fig 4
Fig. 4
TBC components interact with LC3. (a) Reported TBC components contained multiple LIR motifs. (b) TBC components bind to LC3. pEGFP-LC3 and pCMV6-Myc-Amph, pCMV6-Myc-Anxa2, pCMV6-Myc-Dnm2, pCMV6-Myc-Dnm3, pCMV6-Myc-Eps8, pCMV6-Myc-Espn, pCMV6-Myc-Wasl, or pRK-Flag-Cttn were co-transfected to HEK293T cells for co-immunoprecipitation (co-IP) with anti-FLAG or anti-MYC antibodies. Co-immunoprecipitation experiment between PDLIM1 and LC3 worked as a positive control. (c) ARPC3 binds to LC3. Endogenous co-IP of ARPC3 and LC3 was conducted with mouse seminiferous tubule lysate by using ARPC3 antibody, and LC3 was observed using rabbit anti-LC3 antibody. (d) DYN2 interacts with LC3. Endogenous co-IP of DYN2 and LC3 was conducted with mouse seminiferous tubule lysate by using DYN2 antibody, and LC3 was observed using rabbit anti-LC3 antibody. (e) and (f) LC3 partially colocalizes with TBC components. Super-Resolution microscopy images of phalloidin (red), LC3 (green), nuclei (blue), VCL (white) (e) or EPS8 (white) (f) in spermatids attached with part of Sertoli cells. The arrowheads indicate the co-localization regions between VCL/EPS8 and LC3.
Fig 5
Fig. 5
Autophagy-lysosome pathway in TBCs. (a) Autophagy-lysosome pathway-related proteins could be observed in TBC regions. Super-Resolution microscopy images of phalloidin (red), LC3 (green), LAMP2 (white), and nuclei (blue) in spermatids attached with part of Sertoli cell regions. Arrowheads indicate the co-localization regions between LC3 and LAMP2. (b) TBC component partially colocalizes with lysosomes in TBCs. Super-Resolution microscopy images of phalloidin (red), LAMP2 (green) and ARPC3 (white), and nuclei (blue) in spermatids attached with part of Sertoli cell regions. Arrowheads indicate the co-localization regions between ARPC3 and LAMP2. (c) and (d) Impairment of autolysosome formation in autophagy-deficient TBCs. Immunofluorescence staining for phalloidin (green), nuclei (blue) and LAMP2 (red) was conducted in spermatids attached with part of Sertoli cells from Atg7Flox/Flox and AMH-atg7−/− male mice (c), Atg5Flox/Flox and AMH-atg5−/− male mice (d). Arrowheads indicate the LAMP2 signals in TBCs. (e) Immunofluorescence staining for phalloidin (red), LAMP2 (green), CTTN (magenta) and nuclei (blue) was conducted in Atg7Flox/Flox and AMH-atg7−/− testes. Arrowheads indicate the LAMP2 signals in TBCs.
Fig 6
Fig. 6
VCL and CTTN could be selectively degraded via the autophagy-lysosome pathway. (a) Protein levels of some TBC components accumulated in AMH-atg7−/− mouse testes. Immunoblotting of VCL, CTTN, ARPC3, ACTIN, EPB41 and DNM2 were performed in Atg7Flox/Flox and AMH-atg7−/− testes. TUBB, GAPDH, H2A served as loading controls. (b) Protein levels of some TBC components accumulated in AMH-atg7−/− mouse seminiferous tubules. Immunoblotting of VCL, CTTN, ARPC3, and EPB41 were performed in Atg7Flox/Flox and AMH-atg7−/− seminiferous tubules. TUBB worked as a loading control. (c) VCL and CTTN could be degraded via the autophagy-lysosome pathway. Cycloheximide chase (CHX) assay of VCL and CTTN was conducted in isolated Sertoli cells from Atg7Flox/Flox and AMH-atg7−/−male mice. CHX assay of PDLIM1 in mouse Sertoli cells worked as a positive control. (d)-(f) Quantification of the relative VCL (d), CTTN (e) and PDLIM1 (f) protein levels in (c). The protein level of VCL (n = 4 biologically independent samples), CTTN (n = 4 biologically independent samples) and PDLIM1 (n = 4 biologically independent samples) were quantified by using an LI-COR® Image Studio software. Data are presented as the mean ± SEM. two-tailed Student's t-test; *P < 0.05; **P < 0.01. (g)-(i) VCL, CTTN and PDLIM1 signals accumulated in AMH-atg7−/− TBCs. Immunofluorescence staining for phalloidin (red), nuclei (blue) and VCL (green) (g), CTTN (green) (h) or PDLIM1 (green) (i) was conducted in spermatids attached with part of Sertoli cells from Atg7Flox/Flox and AMH-atg7−/− male mice. (j) The accumulation of PDLIM1 in the AMH-atg7−/− mouse TBC region. Immunofluorescence staining for phalloidin (red), PDLIM1 (green), and nuclei (blue) was conducted in Atg7Flox/Flox and AMH-atg7−/− testes.
Fig 7
Fig. 7
A proposed model for the functional role of autophagy during spermiation. In the seminiferous epithelium (left), autophagy is activated in TBCs and facilitates TBC components degradation through autophagy-lysosome pathways. In addition, autophagy also participates in phagocytosis in Sertoli cells. With a lack of Atg7 or Atg5 (right part), autophagy in mouse Sertoli cells could not be initiated, and TBC components were accumulated in TBC regions, which may result in spermiation failure.

Similar articles

References

    1. O'Donnell L., Nicholls P.K., O'Bryan M.K., et al. Spermiation: The process of sperm release. Spermatogenesis. 2011;1:14–35. - PMC - PubMed
    1. Beardsley A., O'Donnell L. Characterization of normal spermiation and spermiation failure induced by hormone suppression in adult rats. Biol. Reprod. 2003;68:1299–1307. - PubMed
    1. Russell L.D. The perils of sperm release - let my children go. Int. J. Androl. 1991;14:307–311. - PubMed
    1. Denison F.C., Smith L.B., Muckett P.J., et al. LKB1 is an essential regulator of spermatozoa release during spermiation in the mammalian testis. PLoS One. 2011;6:1–14. - PMC - PubMed
    1. O'Donnell L., Narula A., Balourdos G., et al. Impairment of spermatogonial development and spermiation after testosterone-induced gonadotropin suppression in adult monkeys (Macaca fascicularis) J. Clin. Endocrinol. Metab. 2001;86:1814–1822. - PubMed

LinkOut - more resources