. 2024 Dec 21:2024:6410484.
doi: 10.1155/cjgh/6410484. eCollection 2024.

Kupffer-Cell-Targeted Carboxylesterase 1f Knockdown Deteriorates Lipopolysaccharide/D-Galactosamine-Induced Acute Liver Failure Through Regulating Cellular Polarization in Mice

Affiliations

Kupffer-Cell-Targeted Carboxylesterase 1f Knockdown Deteriorates Lipopolysaccharide/D-Galactosamine-Induced Acute Liver Failure Through Regulating Cellular Polarization in Mice

Sai Zhao et al. Can J Gastroenterol Hepatol. .

Abstract

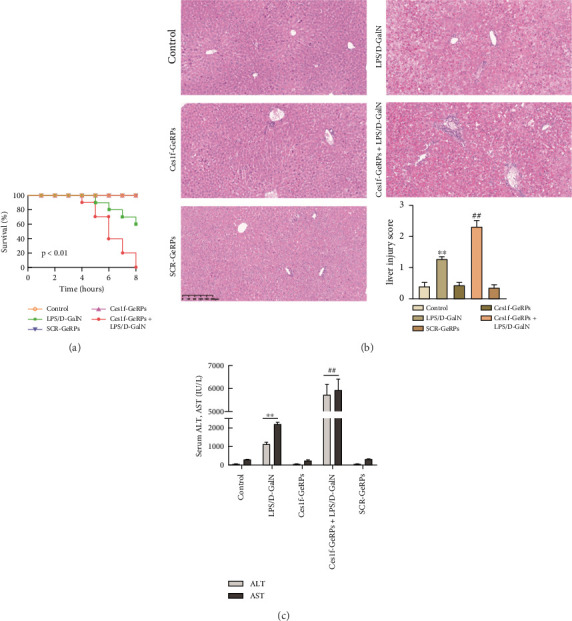
Background: Aims: Carboxylesterase (Ces)1f is implicated in protection against hepatic inflammation, but it is unclear whether the enzyme has an influence in polarization of Kupffer cells (KCs), the innate immune cells mediating hepatic inflammatory injury including acute liver failure (ALF). In the present study, we aim to explore KC polarization induced by Ces1f in mice with lipopolysaccharide/D-galactosamine (LPS/D-GalN)-induced ALF. Methods: We adopted a novel delivery system, β-1,3-D-glucan-encapsulated Endoporter-siRNA particles, to specifically target KC Ces1f knockdown via tail vein injection in mice. Results: Ces1f knockdown increased LPS/D-GalN-induced lethality as well as serum levels of alanine and aspartate transaminases, deteriorated hepatic inflammatory injury, and imbalanced hepatic oxidative stress molecules including myeloperoxidase, malondialdehyde, and superoxide dismutase in ALF. Ces1f knockdown also increased the levels of proinflammatory cytokines (tumor necrosis factor-α and interleukin-6) and decreased the levels of anti-inflammatory cytokine (interleukin-10) in LPS/D-Gal-induced ALF. Ces1f knockdown promoted KC M1 phenotype and marker expression (including CD86 and interleukin-1β), but inhibited M2 phenotype and marker expression (including CD163, CD206, and Arginase 1). Conclusions: Our results suggest that Ces1f plays a hepatoprotective role through regulating KC polarization, which might contribute to anti-inflammatory and antioxidative effects in LPS/D-Gal-induced ALF mice.

Keywords: Kupffer cells; acute liver failure; carboxylesterase 1f; gene knockdown; polarization phenotype.


Conflict of interest statement

The authors declare no conflicts of interest.

Figures

Figure 1
Figure 1
Injection times.
Figure 2
Figure 2
Hepatic Ces1f expression in LPS/D-GalN-challenged mice with KC-targeted gene knockdown. Mice were challenged by LPS/D-GalN injection intraperitoneally after KC-targeted Ces1f knockdown using tail vein administration of GeRPs. (a) Ces1f mRNA expression in liver tissues with FISH assay. Left panel shows a representative picture of hepatocellular Ces1f mRNA expression under fluorescence microscopy, and right panel shows a relative fluorescence intensity of Ces1f mRNA in liver after normalization to cell numbers. Data represent means ± SD (n = 6 each group). Nuclei were stained blue with DAPI, and cytoplasmic Ces1f was stained green (×630, scale bar 20 μm). (b) Ces1f mRNA expression in liver tissues using RT-qPCR. Relative expression levels of Ces1f mRNA were detected in liver after normalization to control through RT-qPCR. Data represent means ± SD (n = 6 each group). ⁣p < 0.05 and ⁣∗∗p < 0.01 versus control mice [Ces1f-siRNA(−)LPS/D-GalN(−)]; #p < 0.05 and ##p < 0.01 versus LPS/D-GalN-challenged mice [Ces1f-siRNA(−)LPS/D-GalN(+)].
Figure 3
Figure 3
KC Ces1f expression in LPS/D-GalN-challenged mice with KC-targeted gene knockdown. Mice were challenged by LPS/D-GalN injection intraperitoneally after KC-targeted Ces1f knockdown using tail vein administration of GeRPs. Double immunofluorescence staining was conducted to assess Ces1f expression in KCs. Left panel shows representative pictures of KC Ces1f expression (F4/80+Ces1f+) under fluorescence microscopy, and right panel shows the percentages of F4/80+Ces1f+ cells. Data represent means ± SD (n = 6 each group). Nuclei were stained blue with DAPI, KC marker F4/80 was stained green, and cytoplasmic Ces1f was stained red. ⁣p < 0.05 and ⁣∗∗p < 0.01 versus control mice [Ces1f-siRNA(−)LPS/D-GalN(−)]; #p < 0.05 and ##p < 0.01 versus LPS/D-GalN-challenged mice [Ces1f-siRNA(−)LPS/D-GalN(+)].
Figure 4
Figure 4
Effects of KC Ces1f knockdown on animal survival, hepatic injury, and blood ALT/AST levels in ALF mice. Mice were challenged by LPS/D-GalN injection intraperitoneally after KC-targeted Ces1f knockdown using tail vein administration of GeRPs. (a) Survival. Mouse survival rates in five groups at different times within 8 h after challenge with LPS/D-GalN (n = 10 each group). (b) Morphological appearance. A representative hepatic staining using hematoxylin–eosin (H&E) is shown, and liver injury scores are shown in the bottom right corner. Data represent means ± SD (n = 6 each group). (c) Serum ALT and AST levels. Data represent means ± SD (n = 6 each group). ⁣p < 0.05 and ⁣∗∗p < 0.01 versus control mice [Ces1f-siRNA(−)LPS/D-GalN(−)]; #p < 0.05 and ##p < 0.01 versus LPS/D-GalN-challenged mice [Ces1f-siRNA(−)LPS/D-GalN(+)].
Figure 5
Figure 5
Activities of hepatic MPO, MDA, and SOD in LPS/D-GalN-challenged mice with KC-targeted gene knockdown. Mice were challenged by LPS/D-GalN injection intraperitoneally after KC-targeted Ces1f knockdown using tail vein administration of GeRPs. The levels of MPO, MDA, and SOD were evaluated by specific commercial assay kits. (a) MPO. (b) MDA. (c) SOD. Data represent means ± SD (n = 6 each group). ⁣p < 0.05 and ⁣∗∗p < 0.01 versus control mice [Ces1f-siRNA(−)LPS/D-GalN(−)]; #p < 0.05 and ##p < 0.01 versus LPS/D-GalN-challenged mice [Ces1f-siRNA(−)LPS/D-GalN(+)].
Figure 6
Figure 6
Effects of KC Ces1f knockdown on hepatic apoptosis in ALF mice. Mice were challenged by LPS/D-GalN injection intraperitoneally after KC-targeted Ces1f knockdown using tail vein administration of GeRPs. Hepatic apoptosis was analyzed by TUNEL staining. The TUNEL‐positive cells were examined through fluorescence microscopy. DAPI staining made all hepatocyte nuclei show blue fluorescence, and TUNEL staining made apoptotic cells show green fluorescence. Representative figures of hepatic TUNEL staining are shown, and the proportion of TUNEL-positive cells is shown on the right. Data represent means ± SD (n = 6 each group). ⁣p < 0.05 and ⁣∗∗p < 0.01 versus control mice [Ces1f-siRNA(−)LPS/D-GalN(−)]; #p < 0.05 and ##p < 0.01 versus LPS/D-GalN-challenged mice [Ces1f-siRNA(−)LPS/D-GalN(+)].
Figure 7
Figure 7
Effects of KC Ces1f knockdown on secretion of TNF-α, IL-6, and IL-10 in ALF mice. Mice were challenged by LPS/D-GalN injection intraperitoneally after KC-targeted Ces1f knockdown using tail vein administration of GeRPs. (a) Serum cytokines were analyzed by ELISA. (b) mRNA expression of TNF-α in liver tissues using RT-qPCR. Data represent means ± SD (n = 6 each group). ⁣p < 0.05 and ⁣∗∗p < 0.01 versus control mice [Ces1f-siRNA(−)LPS/D-GalN(−)]; #p < 0.05 and ##p < 0.01 versus LPS/D-GalN-challenged mice [Ces1f-siRNA(−)LPS/D-GalN(+)].
Figure 8
Figure 8
Effects of Ces1f knockdown on KC-polarized activities in LPS/D-GalN-induced ALF. Mice were challenged by LPS/D-GalN injection intraperitoneally after KC-targeted Ces1f knockdown using tail vein administration of GeRPs. mRNA expression was assayed by RT-qPCR, and polarized KCs were evaluated through double immunofluorescence staining. Nuclei were stained blue with DAPI, KCs stained green with F4/80, and polarized cells stained red with biomarkers CD86/CD163. M1 KCs were F4/80+CD86+ cells, and M2 KCs were F4/80+CD163+ cells. (a) mRNA expression of M1 biomarkers (CD86 and iNOS) in liver tissues. (b) mRNA expression of M2 biomarkers (CD163 and Arg-1) in liver tissues. (c) Representative pictures of M1 phenotype KCs are shown, and right panel shows the percentages of M1-polarized cells to total KCs [(CD86+F4/80+/F4/80+)%]. (d) Representative pictures of M2 phenotype KCs are shown, and right panel shows the percentages of M2-polarized cells to total KCs [(CD163+F4/80+/F4/80+)%]. Data represent means ± SD (n = 6 each group). ⁣p < 0.05 and ⁣∗∗p < 0.01 versus control mice [Ces1f-siRNA(−)LPS/D-GalN(−)]; #p < 0.05 and ##p < 0.01 versus LPS/D-GalN-challenged mice [Ces1f-siRNA(−)LPS/D-GalN(+)].

Similar articles

Cited by

References

    1. Stravitz R. T., Lee W. M. Acute Liver Failure. The Lancet . 2019;394(10201):869–881. doi: 10.1016/s0140-6736(19)31894-x. - DOI - PMC - PubMed
    1. Li Z., Feng H., Han L., et al. Chicoric Acid Ameliorate Inflammation and Oxidative Stress in Lipopolysaccharide and D-Galactosamine Induced Acute Liver Injury. Journal of Cellular and Molecular Medicine . 2020;24(5):3022–3033. doi: 10.1111/jcmm.14935. - DOI - PMC - PubMed
    1. Stuart W. D., Kulkarni R. M., Gray J. K., Vasiliauskas J., Leonis M. A., Waltz S. E. Ron Receptor Regulates Kupffer Cell-dependent Cytokine Production and Hepatocyte Survival Following Endotoxin Exposure in Mice. Hepatology . 2011;53(5):1618–1628. doi: 10.1002/hep.24239. - DOI - PMC - PubMed
    1. Rahman N., Pervin M., Kuramochi M., et al. M1/M2-macrophage Polarization-Based Hepatotoxicity in D-Galactosamine-Induced Acute Liver Injury in Rats. Toxicologic Pathology . 2018;46(7):764–776. doi: 10.1177/0192623318801574. - DOI - PubMed
    1. Tian L., Li W., Yang L., et al. Cannabinoid Receptor 1 Participates in Liver Inflammation by Promoting M1 Macrophage Polarization via RhoA/NF-Κb P65 and ERK1/2 Pathways, Respectively, in Mouse Liver Fibrogenesis. Frontiers in Immunology . 2017;8:p. 1214. doi: 10.3389/fimmu.2017.01214. - DOI - PMC - PubMed

Publication types

MeSH terms

LinkOut - more resources