

Achieving High Standards in Clinical Biochemistry: Integrating Six Sigma, Quality Goal Index (QGI), and Operating Specifications (OPSpecs) for Targeted Quality Enhancement
- PMID: 39735008
- PMCID: PMC11681992
- DOI: 10.7759/cureus.74693
Achieving High Standards in Clinical Biochemistry: Integrating Six Sigma, Quality Goal Index (QGI), and Operating Specifications (OPSpecs) for Targeted Quality Enhancement
Abstract
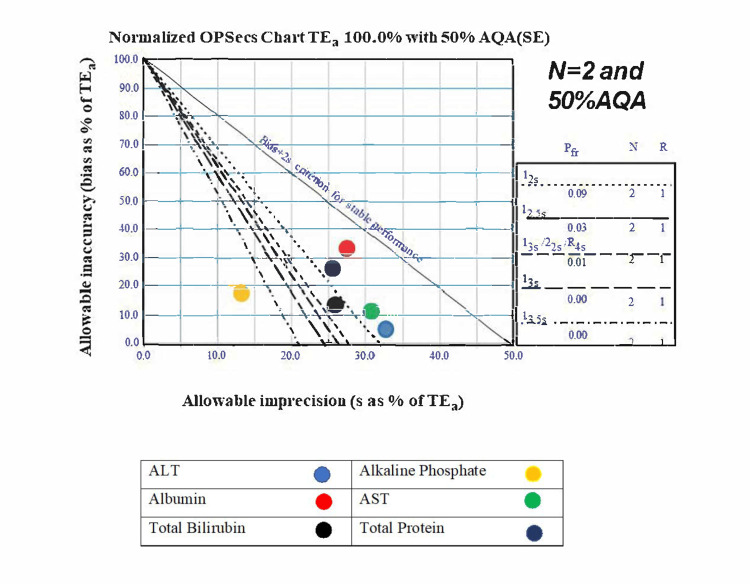
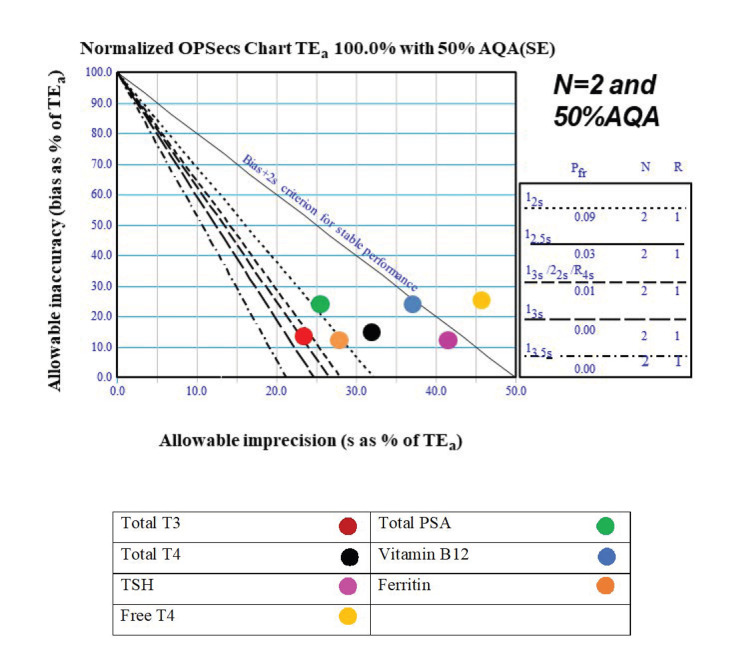
Background Sigma metrics, a cornerstone of quality control (QC) in manufacturing, have been increasingly adopted in analytical processes. In clinical biochemistry labs, Sigma analysis provides insights into the level of QC achieved and identifies deviations from perfection. Methods A prospective-retrospective observational study was conducted at the Central Diagnostic Laboratory of Shree Krishna Hospital between August 2021 and July 2022. Sigma metrics were calculated using the formula: Sigma = (TEa - Bias%) / CV%. Total allowable error (TEa) values were derived from guidelines including the Clinical Laboratory Improvement Amendments (CLIA), Royal College of Pathologists of Australasia (RCPA), and Rilibäk. Bias% was assessed using data from External Quality Assurance Services (EQAS), while the coefficient of variation (CV%) was calculated based on internal QC data. For parameters with Sigma values less than 3, Quality Goal Index (QGI) ratios were computed to assess whether errors were primarily due to precision or accuracy issues. Operating Specifications (OPSpecs) charts were generated to guide adjustments to internal QC procedures for underperforming tests. Results The analysis revealed that high-density lipoprotein (HDL) cholesterol exhibited excellent performance with a Sigma value of ≥ 6 based on newer CLIA guidelines. Parameters such as alkaline phosphatase (ALP), low-density lipoprotein (LDL) cholesterol, creatine kinase, iron, and sodium achieved Sigma values between 4 and 6, indicating satisfactory QC. However, certain parameters, including urea, creatinine, thyroid-stimulating hormone (TSH), free thyroxine (FT4), vitamin B12, and chloride, demonstrated Sigma values less than 3, signaling the need for immediate quality improvement. QGI analysis highlighted precision issues in some tests, while others showed accuracy deficits. The OPSpecs charts provided a comprehensive framework for customizing QC protocols to address specific parameter deficiencies. Conclusions This study highlights the value of Sigma metrics in refining QC protocols in clinical biochemistry laboratories. Shifting from generalized to parameter-specific QC plans allows for better resource allocation, improved efficiency, and higher test accuracy. Tools like QGI and OPSpecs charts help identify underperforming tests, supporting continuous quality improvement in diagnostics.
Keywords: laboratory quality improvement; opspec charts; quality control (qc); quality goal index (qgi); sigma metrics; total allowable error (tea).
Copyright © 2024, Panchal et al.
Conflict of interest statement
Human subjects: Consent for treatment and open access publication was obtained or waived by all participants in this study. Institutional Ethics Committee-2, Bhaikaka University, Karamsad, Anand, Gujarat issued approval IEC/BU/2021/Ex. 39/268. Animal subjects: All authors have confirmed that this study did not involve animal subjects or tissue. Conflicts of interest: In compliance with the ICMJE uniform disclosure form, all authors declare the following: Payment/services info: All authors have declared that no financial support was received from any organization for the submitted work. Financial relationships: All authors have declared that they have no financial relationships at present or within the previous three years with any organizations that might have an interest in the submitted work. Other relationships: All authors have declared that there are no other relationships or activities that could appear to have influenced the submitted work.
Figures
References
-
- Berry T. New York: McGraw-Hill Education; 1990. Managing the total quality transformation.
-
- Why is the laboratory an afterthought for managed care organizations? Forsman RW. https://pubmed.ncbi.nlm.nih.gov/8653920/ Clin Chem. 1996;42:813–816. - PubMed
-
- Quality management science in clinical chemistry: a dynamic framework for continuous improvement of quality. Westgard JO, Burnett RW, Bowers GN. https://pubmed.ncbi.nlm.nih.gov/2208645/ Clin Chem. 1990;36:1712–1716. - PubMed
-
- Errors in laboratory medicine. Bonini P, Plebani M, Ceriotti F, Rubboli F. https://pubmed.ncbi.nlm.nih.gov/11978595/ Clin Chem. 2002;48:691–698. - PubMed
-
- The WHO international external quality assessment scheme for haematology. Lewis SM. https://pubmed.ncbi.nlm.nih.gov/3262439/ Bull World Health Organ. 1988;66:283–290. - PMC - PubMed
LinkOut - more resources
Full Text Sources