. 2024 Dec 13:15:1507852.
doi: 10.3389/fmicb.2024.1507852. eCollection 2024.

Identification of virus-rich intermediate cells as crucial players in SARS-CoV-2 infection and differentiation dynamics of human airway epithelium

Affiliations

Identification of virus-rich intermediate cells as crucial players in SARS-CoV-2 infection and differentiation dynamics of human airway epithelium

Mi Il Kim et al. Front Microbiol. .

Abstract

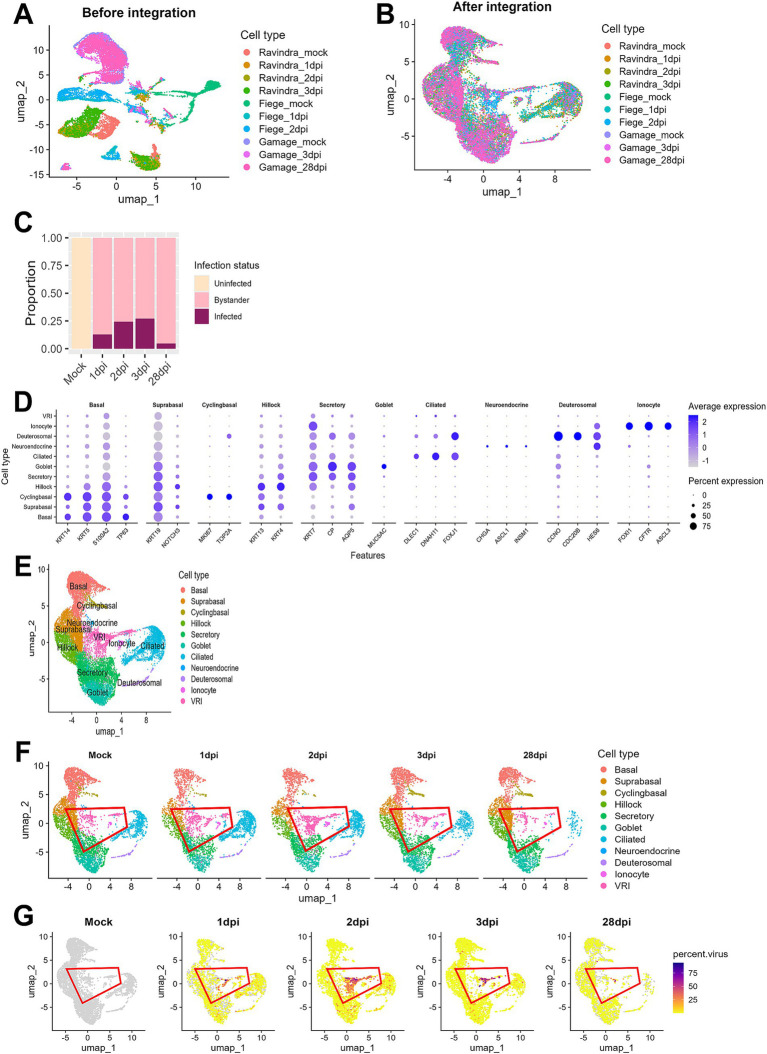
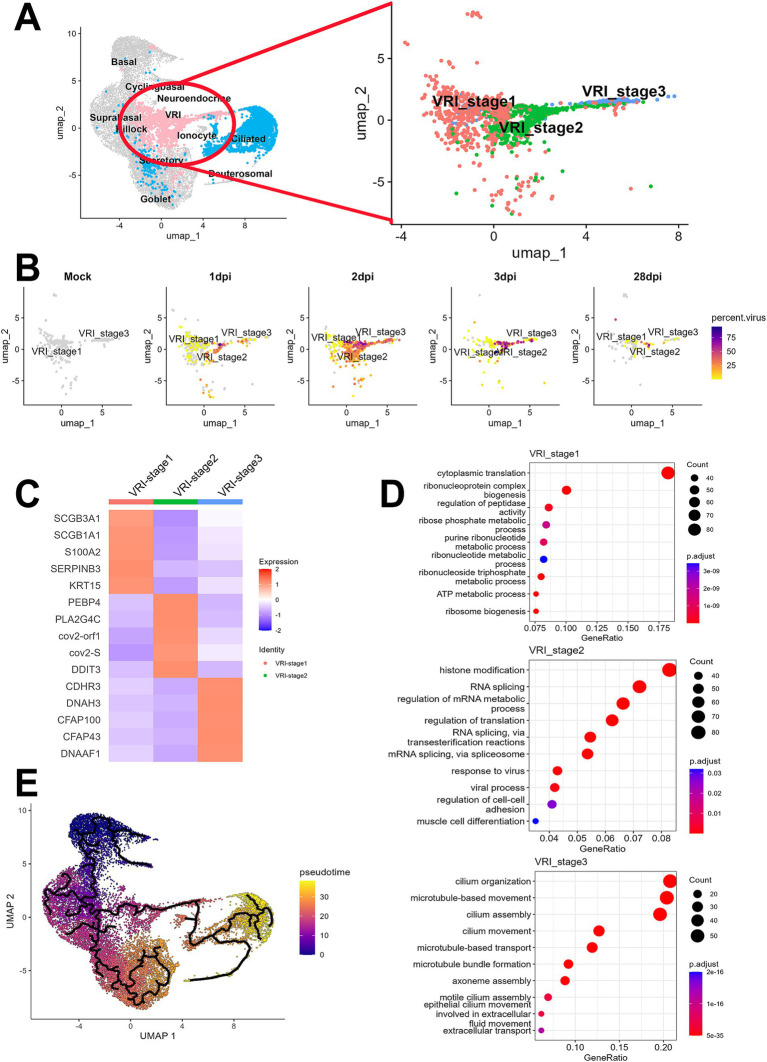
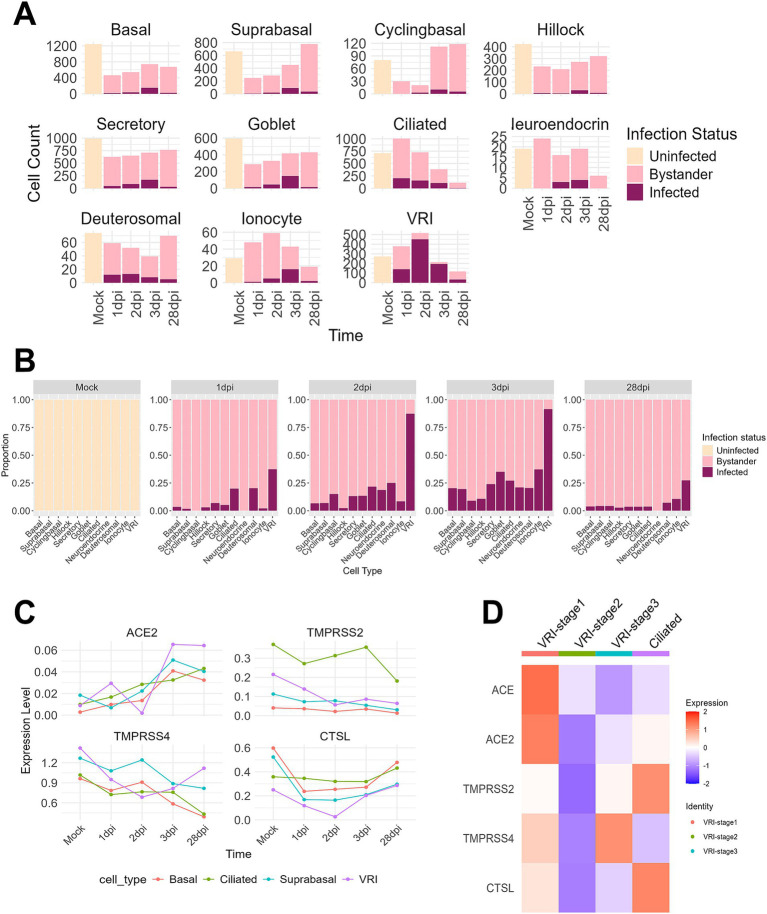
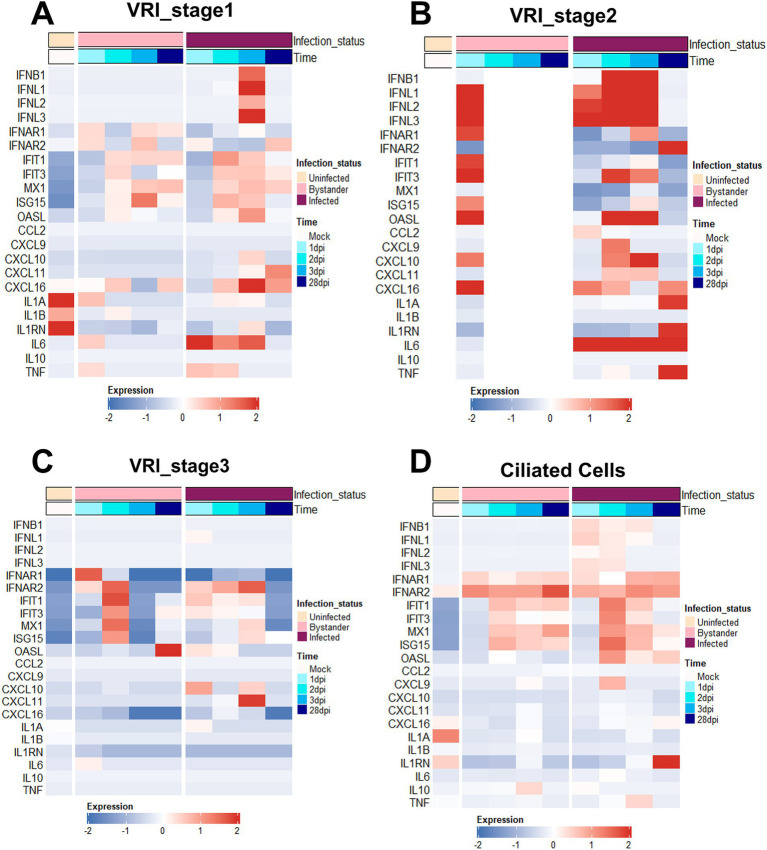
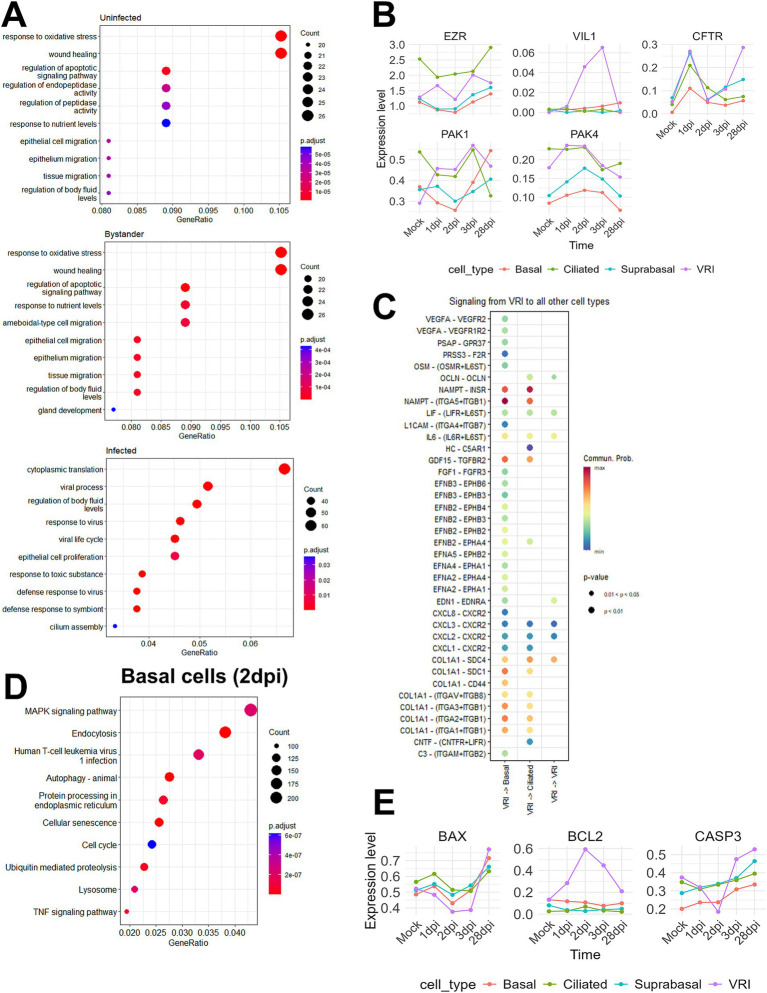
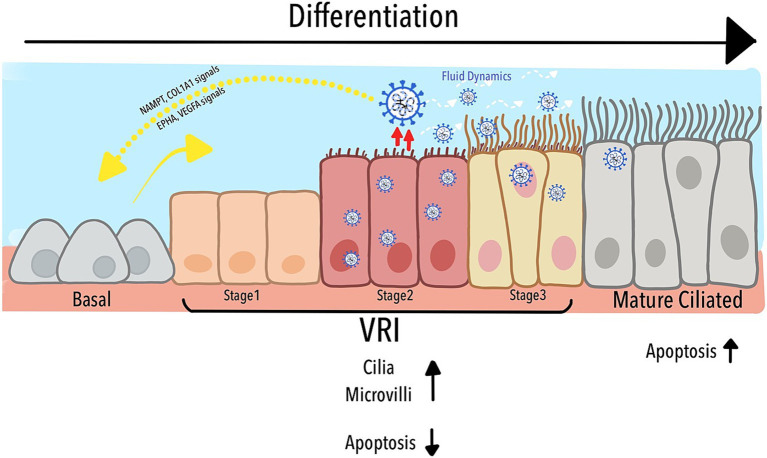
Understanding the early interactions between severe acute respiratory syndrome coronavirus 2 (SARS-CoV-2) and human airway epithelial cells is essential for unraveling viral replication and spread mechanisms. In this study, we investigated the early dynamics of airway epithelial cells during SARS-CoV-2 infection using well-differentiated human nasal and tracheal epithelial cell cultures by incorporating three publicly available single-cell RNA sequencing datasets. We identified a previously uncharacterized cell population, termed virus-rich intermediate (VRI) cells, representing an intermediate differentiation stage between basal and ciliated cells. These VRI cells exhibited high viral loads at all infection time points, strong interferon and inflammatory responses, increased mRNA expression of microvilli-related genes (PAK1, PAK4, VIL1), and suppression of apoptosis markers (BAX, CASP3) alongside increased anti-apoptotic gene expression (BCL2). Cell-cell interaction analysis revealed that VRI cells send signals to basal cells via receptor-ligand pathways such as EPHA and VEGF, likely promoting basal cell differentiation and proliferation through MAPK signaling. These findings suggest that SARS-CoV-2 utilizes VRI cells as a primary site for replication and spread, leveraging these cells' unique differentiation state to evade host cell death and facilitate viral propagation. This study provides insights into the early cellular responses to SARS-CoV-2 infection and highlights potential therapeutic targets to limit viral spread.

Keywords: SARS-CoV-2; air-liquid interface culture; airway epithelial cell; single-cell RNA sequencing; virus-rich intermediate.


Conflict of interest statement

The authors declare that the research was conducted in the absence of any commercial or financial relationships that could be construed as a potential conflict of interest.

Figures

Figure 1
Figure 1
Integration and analysis of scRNA-seq data from SARS-CoV-2-infected ALI cultures. (A) UMAP plot displaying scRNA-seq data before integration, showing separate clustering of individual datasets by sequencing platform or sample batch; (B) UMAP plot of scRNA-seq data after batch correction and integration using Seurat, showing harmonized cell clustering across all datasets. (C) Bar plot illustrating the proportion of cells across different infection time points after integration. (D) Bar plot displaying the proportion of cells at days post-infection. Cells were classified into three groups: uninfected (Mock), infected (cells with percent viral gene >0.1%), and bystander (cells not infected but exposed to the infection environment); (E) UMAP plot showing annotated cell clusters after integration, labeled according to the cell types; (F) UMAP plots showing temporal changes in cell population composition across days post-infection. Each color represents the different cell types, and the red outline highlights VRI stage cells; (G) UMAP plots show the distribution of infected cells (percent viral load > 0.1%) across the time points. Viral load is represented by a color scale, with warmer colors indicating higher viral load.
Figure 2
Figure 2
Elucidation of VRI as a cell population differentiating from basal to ciliated cells. (A) UMAP projection of the full dataset on the left and a sub-clustering of VRI-stage clusters (VRI_stage1, VRI_stage2, and VRI_stage3) on the right; (B) UMAP plots displaying viral load distributions across time points. Cells are colored by viral load percentage, illustrating dynamic changes within VRI-stage clusters; (C) Heatmap showing the expression levels of key marker genes across VRI_stage1, VRI_stage2, VRI_stage3; (D) Dot plots representing the top enriched pathways and biological processes in VRI_stage1, VRI_stage2, and VRI_stage3 clusters. Dot size corresponds to the gene ratio, and color intensity indicates the adjusted p-value for pathway enrichment; (E) Pseudo-time trajectory analysis performed using Monocle3, illustrating the differentiation pathways of cells. Cells are color-coded by pseudo-time.
Figure 3
Figure 3
VRI serves as a primary site for SARS-CoV-2 infection. (A) Bar plots showing the cell counts of infected, uninfected, and bystander cells for different cell types across time points; (B) Bar plots depicting the proportions of infected, uninfected, and bystander cells for different cell types across time points; (C) Line plots representing the expression levels (log-normalized values) of viral entry and response genes (e.g., ACE2, TMPRSS2, CTSL) over time across different cell types; (D) Heatmap showing the expression of viral entry genes (ACE2, TMPRSS2, CTSL, etc.) across VRI-stage cells and ciliated cells relevant populations at time points. The color scale indicates Z score-transformed expression level. Infected cells are shown in purple, bystander cells in light pink, and uninfected cells in gray.
Figure 4
Figure 4
VRI cells exhibit strong interferon and inflammatory responses. (A–D) Heatmaps depicting the expression levels of key immune response genes across time and infection status in different cell populations; (A) VRI_stage1 cells; (B) VRI_stage2 cells; (C) VRI_stage3 cells; (D) Ciliated cells; Each column represents a pseudobulk average of all cells from a single cell type and single study. The color scale indicates z-score-transformed expression levels, with red representing higher expression and blue representing lower expression.
Figure 5
Figure 5
SARS-CoV-2 induced changes in epithelial cell composition. (A) Dot plots showing the top enriched pathways and biological processes in VRI-stage cells, divided into three groups: uninfected, infected, and bystander cells. The dot size represents the number of genes involved in each pathway, and the color scale indicates adjusted p-values; (B) Line plots showing the temporal expression dynamics of markers related to microvilli formation (e.g., EGFR, IL6, and VEGFA) in various cell types. The expression values represent log-normalized pseudobulk data obtained using Seurat’s “AggregateExpression” function; (C) Bubble plot displaying the cell-cell interaction signaling analyzed using CellChat, showing signaling sent from VRI-stage cells to other cell types at 2dpi. The color scale represents the communication probability (Comm. Prob.), and the size of the bubbles indicates p-values for the identified interactions; (D) Dot plot illustrating the top GO enrichment pathways in basal cells at 2dpi. The dot size represents the number of genes involved, and the color scale indicates adjusted p-values; (E) Line plots showing the temporal expression dynamics of markers related to apoptosis across various cell types over time. The expression values represent log-normalized pseudobulk data obtained using Seurat’s “AggregateExpression” function. Lines represent the average gene expression level in each cell type at different time points post-infection.
Figure 6
Figure 6
Schematic representation of VRI cell differentiation and role in SARS-CoV-2 infection.

Similar articles

References

    1. Adil M. T., Rahman R., Whitelaw D., Jain V., Al-Taan O., Rashid F., et al. . (2021). SARS-CoV-2 and the pandemic of COVID-19. Postgrad. Med. J. 97, 110–116. doi: 10.1136/postgradmedj-2020-138386, PMID: - DOI - PMC - PubMed
    1. Ahn J. H., Kim J., Hong S. P., Choi S. Y., Yang M. J., Ju Y. S., et al. . (2021). Nasal ciliated cells are primary targets for SARS-CoV-2 replication in the early stage of COVID-19. J. Clin. Invest. 131:e148517. doi: 10.1172/JCI148517, PMID: - DOI - PMC - PubMed
    1. Audrito V., Messana V. G., Deaglio S. (2020). NAMPT and NAPRT: two metabolic enzymes with key roles in inflammation. Front. Oncol. 10:358. doi: 10.3389/fonc.2020.00358, PMID: - DOI - PMC - PubMed
    1. Barber G. N. (2001). Host defense, viruses and apoptosis. Cell Death Differ. 8, 113–126. doi: 10.1038/sj.cdd.4400823 - DOI - PubMed
    1. Barnett K. C., Xie Y., Asakura T., Song D., Liang K., Taft-Benz S. A., et al. . (2023). An epithelial-immune circuit amplifies inflammasome and IL-6 responses to SARS-CoV-2. Cell Host Microbe 31, 243–259.e6. doi: 10.1016/j.chom.2022.12.005, PMID: - DOI - PMC - PubMed

LinkOut - more resources