. 2024 Dec 10;8(4):1149-1172.
doi: 10.1162/netn_a_00394. eCollection 2024.

The impact of Parkinson's disease on striatal network connectivity and corticostriatal drive: An in silico study

Affiliations

The impact of Parkinson's disease on striatal network connectivity and corticostriatal drive: An in silico study

Ilaria Carannante et al. Netw Neurosci. .

Abstract

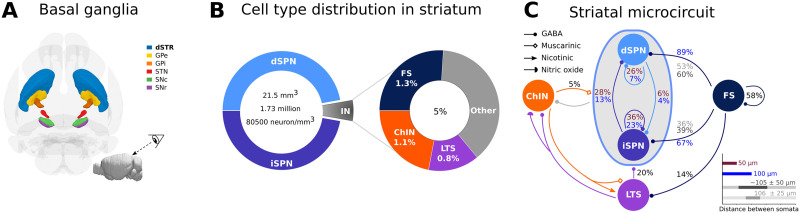
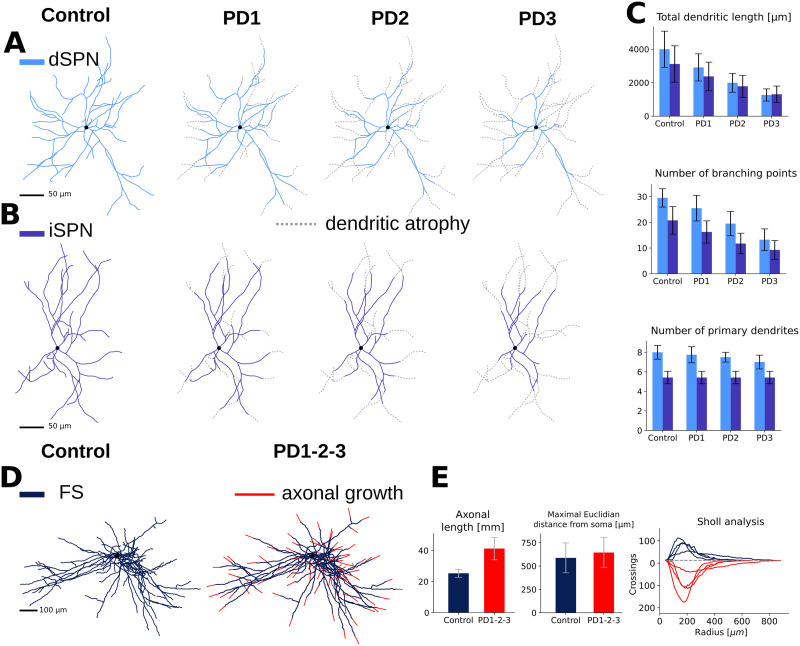
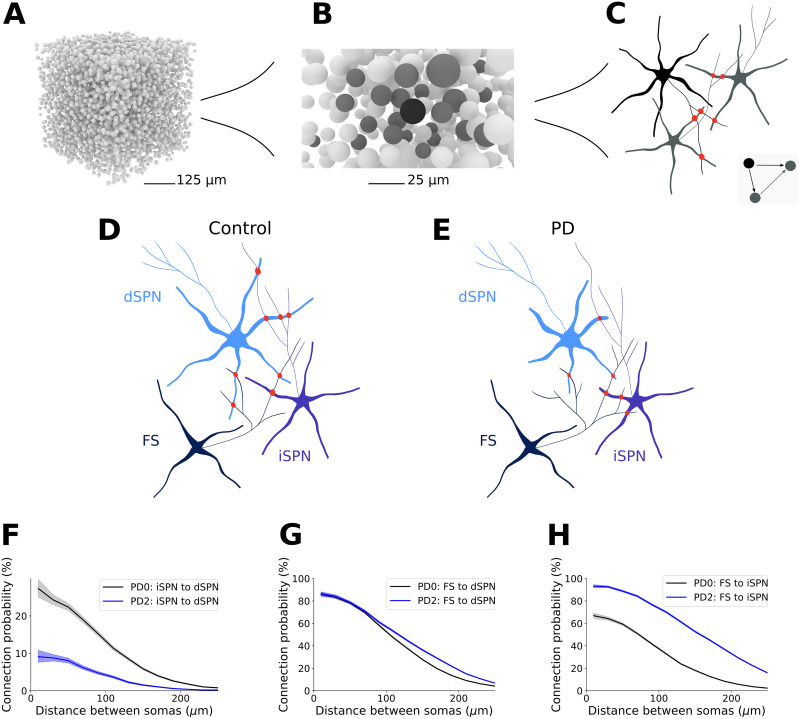
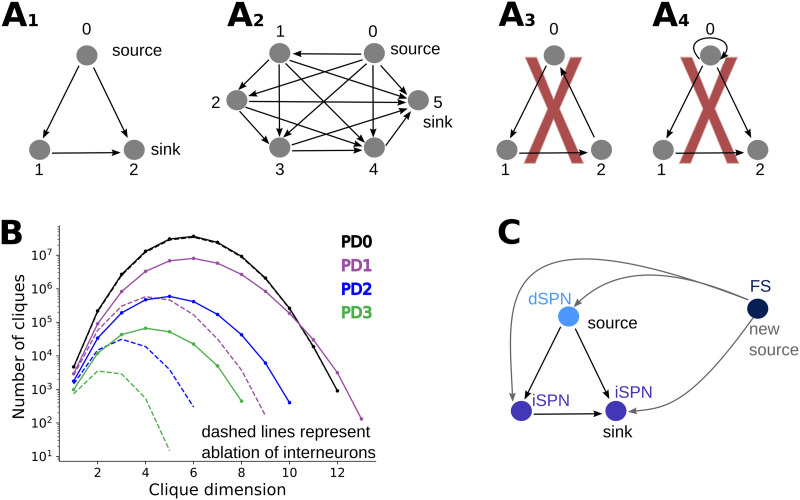
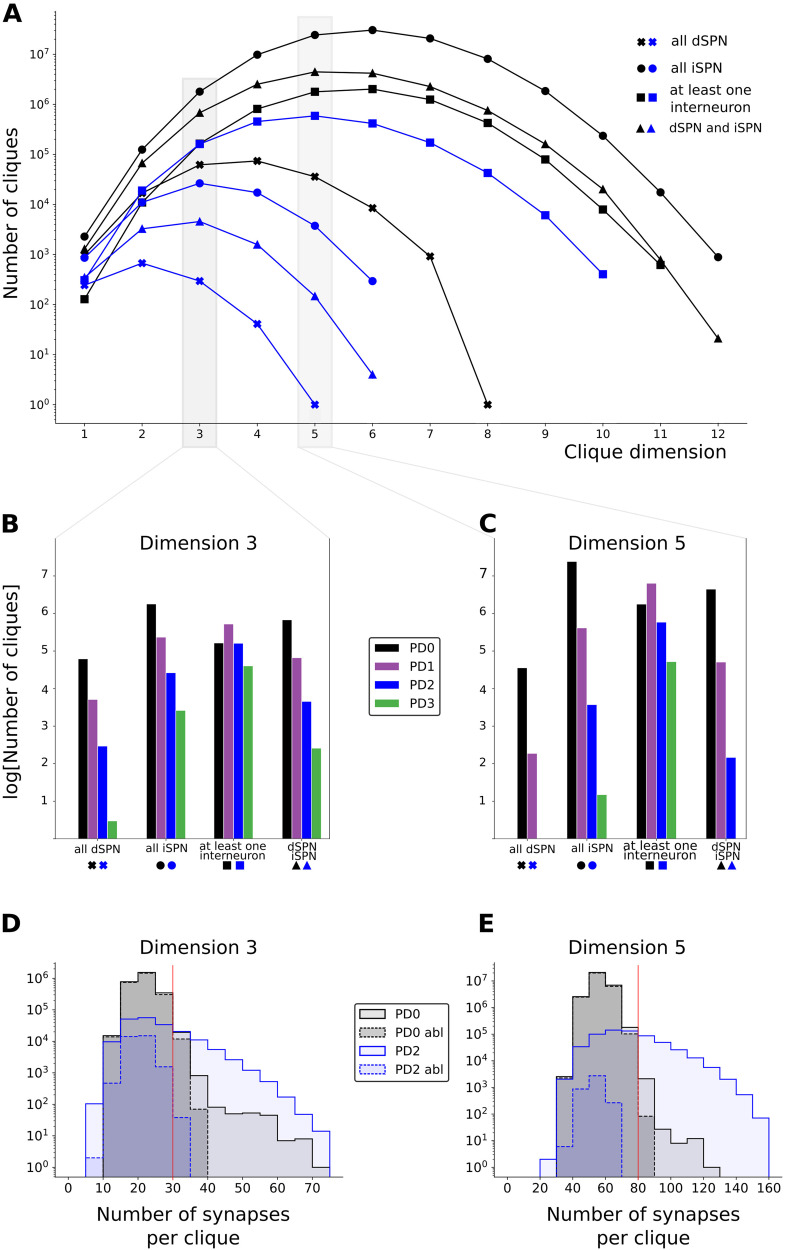
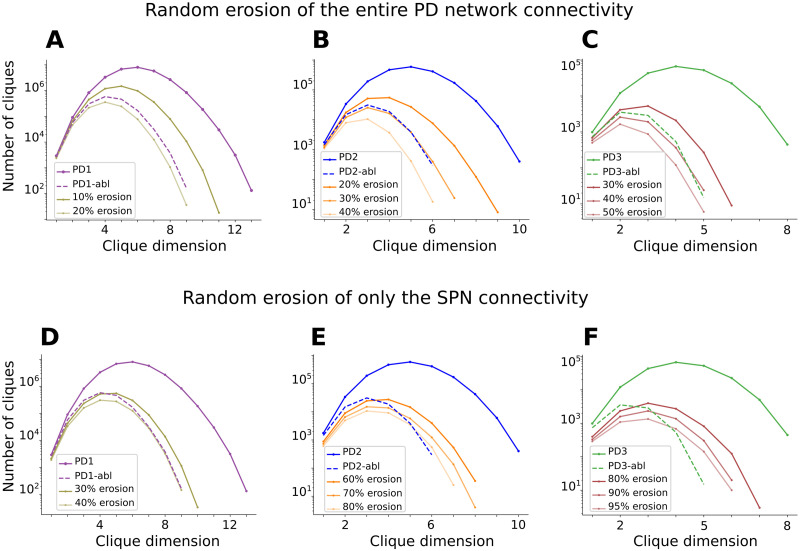
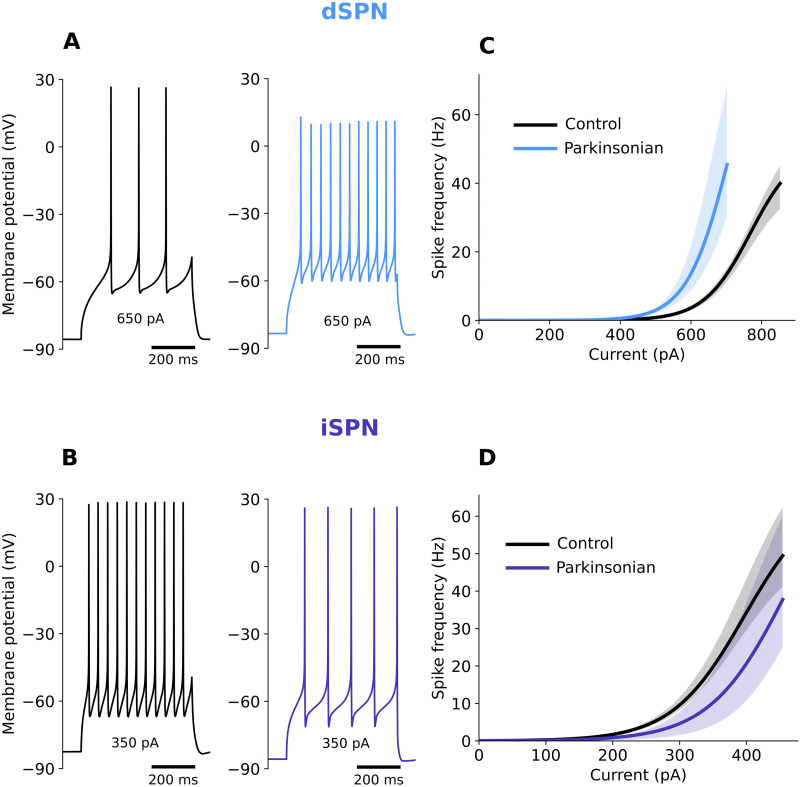
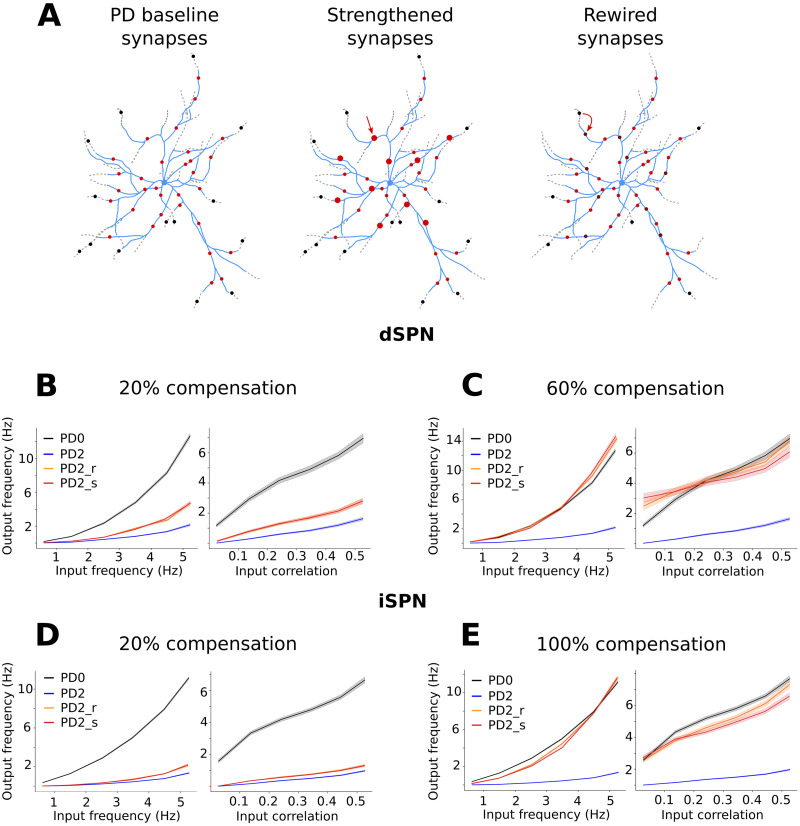
Striatum, the input stage of the basal ganglia, is important for sensory-motor integration, initiation and selection of behavior, as well as reward learning. Striatum receives glutamatergic inputs from mainly cortex and thalamus. In rodents, the striatal projection neurons (SPNs), giving rise to the direct and the indirect pathway (dSPNs and iSPNs, respectively), account for 95% of the neurons, and the remaining 5% are GABAergic and cholinergic interneurons. Interneuron axon terminals as well as local dSPN and iSPN axon collaterals form an intricate striatal network. Following chronic dopamine depletion as in Parkinson's disease (PD), both morphological and electrophysiological striatal neuronal features have been shown to be altered in rodent models. Our goal with this in silico study is twofold: (a) to predict and quantify how the intrastriatal network connectivity structure becomes altered as a consequence of the morphological changes reported at the single-neuron level and (b) to investigate how the effective glutamatergic drive to the SPNs would need to be altered to account for the activity level seen in SPNs during PD. In summary, we predict that the richness of the connectivity motifs in the striatal network is significantly decreased during PD while, at the same time, a substantial enhancement of the effective glutamatergic drive to striatum is present.

Keywords: Computational modeling; Directed cliques; Network higher order connectivity; Neuronal degeneration model; Parkinson’s disease; Striatum; Topological data analysis.

Plain language summary

This in silico study predicts the impact that the single-cell neuronal morphological alterations will have on the striatal microcircuit connectivity. We find that the richness in the topological striatal motifs is significantly reduced in Parkinson’s disease (PD), highlighting that just measuring the pairwise connectivity between neurons gives an incomplete description of network connectivity. Moreover, we predict how the resulting electrophysiological changes of striatal projection neuron excitability together with their reduced number of dendritic branches affect their response to the glutamatergic drive from the cortex and thalamus. We find that the effective glutamatergic drive is likely significantly increased in PD, in accordance with the hyperglutamatergic hypothesis.


Conflict of interest statement

Competing Interests: The authors have declared that no competing interests exist.

Figures

<b>Figure 1.</b>
Figure 1.
Organization of the striatal microcircuit. (A) View of the mouse basal ganglia nuclei (direction shown in the inset). The dorsal striatum (dSTR), globus pallidus external and internal segment (GPe and GPi, respectively), subthalamic nucleus (STN), and substantia nigra pars reticulata and pars compacta (SNr and SNc, respectively) are shown in relative sizes. The color coding is as indicated. The inset on the bottom right represents the entire mouse brain and the observer’s view. (B) The mouse striatum is around 21.5 mm3 with a total of 1.73 million neurons, which correspond to approximately 80,500 neurons/mm3. The main cells in the striatum are the SPNs; they constitute around 95% of the neurons, and they are divided into two subpopulations (dSPN and iSPN). The remaining 5% of the neurons are interneurons. FS, ChIN, and LTS interneurons are included in this in silico network. Together, they account for around 3.2% of the neurons (around 64% of the interneuron types). (C) Connection probabilities between the neuronal subtypes included in the in silico network were collected from published data, as explained in Hjorth et al. (2020). When more than one number refers to the same connection (arrow), they come from different publications. In particular, the distance between the somatic pairs is different. Dark brown and blue refer to somatic pair distance within 50 μm and 100 μm, respectively, while dark and light gray refer to an average distance of about 105 ± 50 μm and 106 ± 25 μm, respectively.
<b>Figure 2.</b>
Figure 2.
Morphological changes over PD stages in the model. (A, B) The dendritic arborization of SPNs (dSPN and iSPN) is reduced in PD mice. Three different stages of the disease are simulated. PD1 refers to a mild starting phase, PD2 refers to a medium stage, and PD3 refers to a very severe phase. Only soma and dendrites are shown for SPNs, and the gray dotted lines represent the dendritic branches that atrophied. (C) The total dendritic length, number of branching points, and number of primary dendrites for control (healthy) and PD stages are represented as histograms. (D) The axonal arborization of FS interneurons is increased in PD mice. Only soma and axon are shown for FS, and the red lines represent the axonal branches that have sprouted. (E) The axonal length increased over 60% while the maximal euclidian distance from soma (the radius of the smallest sphere containing the axon) does not change significantly. The significant increase reported in the number of grid crossings by FS axons in PD (Gittis et al., 2011) is also captured in our models and is shown in the Sholl analysis plot.
<b>Figure 3.</b>
Figure 3.
From morphologies to connectivity. Generating network connectivity using Snudda from reconstructed morphologies for healthy and PD networks. (A) Example of positions of multicompartmental neurons (somas) placed in a cube (5,000 somata are illustrated). A set of neurons in the center of the cube, called kernel, is selected. All the pre- and postsynaptic neurons of the kernel form the core. The topological analysis is then performed on the kernel and core, and only the cliques with at least one element in the kernel are kept to avoid edge effects. (B) Illustrates only one neuron forming the kernel (in black), and the elements in the core are in dark gray. (C) Illustration of touch detection between a neuron in the kernel and two of its partners in the core. The three neurons together form a clique (inset figure), and the synapses are shown in red. (D, E) Illustration of connections between one FS, dSPN, and iSPN in the PD0 network and in PD2, respectively. The loss of dendrites in PD causes a reduction in connectivity between the two SPN neurons (here, from 4 to 1), while the effect of FS axonal growth leads to new synapses on the iSPN (here, from 1 to 3). (F) The dendritic degeneration of the SPN leads to reduced pairwise connection probability at all soma-to-soma distances between SPN, here illustrated by the iSPN-to-dSPN connection probability. (G) In accordance with data from Gittis et al. (2011), the growth of FS axons compensates for part of the degeneration of the dSPN morphologies, maintaining the connection probability between the neuron types. (H) For FS-iSPN connectivity, the growth of the FS axons and locally increased synapse density compensates for the degeneration, leading to a doubling of the connectivity within 100 μm. Shaded regions in F, G, and H represent the Wilson score interval.
<b>Figure 4.</b>
Figure 4.
Directed cliques and their presence in PD networks. (A) A directed clique is a set of all to all connected vertices, with a unique source and a unique sink (see the Topological Measurements section). A clique composed of n + 1 vertices is called a n-clique. A1 and A2 are examples of a 2-clique and a 5-clique, respectively. Figure A3 represents a cyclic structure in a directed graph instead, where a source and a sink are not present. This is therefore not an example of a directed clique. The graph represented in A4 is also not a directed clique, according to our definition, since we assume that directed graphs do not contain self-loops. (B) Number of directed cliques in the healthy network (PD0) and different parkinsonian stages (PD1, PD2, PD3) as a function of the clique dimension in log scale. Dashed lines represent directed clique counts in networks where interneurons have been ablated (only dSPNs and iSPNs are present in the networks). (C) Schematic representation suggesting how, during PD stages, new high-dimensional cliques can be formed. The axonal growth of FS interneurons during PD progression can indeed determine connections from FS to existing directed cliques. The FS interneuron together with the neurons composing the already existing directed clique then form a new directed clique with source FS. This mechanism explains why PD1 has higher dimensional directed cliques than PD0, despite the dendritic atrophy of SPNs in the PD network.
<b>Figure 5.</b>
Figure 5.
Composition of directed cliques. (A, B, and C) The presence of directed cliques composed by only dSPN cells (x marker), only iSPN cells (circle marker), containing at least one interneuron (square marker), and containing both dSPN and iSPN (triangular marker) is analyzed. (A) Number, in log scale, of directed cliques with specific neuron compositions described above as a function of the clique dimension in the healthy network PD0 (black curves) and at parkinsonian stage PD2 (blue curves). (B, C) Number, in log scale, of cliques in dimension 3 and dimension 5, respectively, in PD0 (in black), PD1 (in purple), PD2 (in blue), and PD3 (in green) subdivided within the specific neuron compositions. (D, E) Represent the log scale histogram of cliques in dimensions 3 and 5 with a given number of synapses, respectively, in PD0 (light gray), PD0 interneuron ablated (dark gray dashed boundary), PD2 (light blue), and PD2 interneuron ablated (light blue dashed boundary). Vertical red lines represent the thresholds such that cliques with a subthreshold number of synapses were more abundant in PD0, while cliques with a suprathreshold number of synapses were more abundant in PD2.
<b>Figure 6.</b>
Figure 6.
Interneurons are keys to maintaining network connectivity. Despite being only 5% of the neuron population, ablation of the interneurons leads to significant loss of connectivity in each PD stage. The importance of the interneurons can be observed by assessing how many random synapses (directed edges) in the network have to be removed to obtain a comparable effect to ablating the interneurons on directed clique counts. In PD1 (A), 10%–20% of connections need to be eroded; in PD2 (B), around 30% of connections need to be eroded; while in PD3 (C), approximately 40% of connections need to be eroded. If instead only SPN synapses are removed, the fraction of synapses that need to be removed is even higher. In PD1 (D), 30%–40% of the SPNs synapses need to be eroded; in PD2 (E), between 60% and 80% of the SPNs synapses need to be eroded; and in PD3 (F), 80%–95% of the SPNs synapses need to be eroded.
<b>Figure 7.</b>
Figure 7.
Modeling of the electrophysiological properties of SPNs during PD. Changes of excitability and shape of the action potential in the SPNs’ model of the direct pathway (dSPN, A) and indirect pathway (iSPN, B). Voltage traces and current-frequency response curves are shown for healthy neurons (control, black lines) and neuron models adjusted to mimic physiological changes typical for PD (parkinsonian, color lines). Voltage plots illustrate the discharge patterns of the healthy and PD cells in response to the same somatic direct current injection. Current-frequency curves are shown for the single-cell models, dSPN (C), and iSPN (D), using one morphology (up to nine variations) for each cell type and multiple fitted electrical parameter sets (up to 10 for each cell). Shaded regions represent range values.
<b>Figure 8.</b>
Figure 8.
SPNs responses to stimulation of corticostriatal synapses in the control network (PD0) and during PD (PD2). (A) Because of the dendritic atrophy of SPNs (dotted gray branches), some corticostriatal synapses are lost (black circles). The synapses (red circles) on the remaining branches (light blue) are not sufficient to produce the same response as the healthy cells. For this reason, two compensatory mechanisms were implemented to restore the activity level. Percentages of the remaining synapses (20%, 40%, 60%, 80%, and 100%) were strengthened (illustrated as larger circles in middle panel), or percentages of lost synapses were rewired (recovered and redistributed) on the remaining dendrites (illustrated as dark red circles in right panel). Different synaptic input frequencies (from 0.5 to 5 Hz in steps of 0.5 Hz) and input correlations (from 0 to 0.5 in steps of 0.1) were used to stimulate the neurons. Specifically, all the combinations were considered and the output frequency is plotted either as function of the input frequency averaging over the input correlations (left panels B, C, D, E) or as a function of the input correlations averaging over the input frequencies (right panels B, C, D, E). Line colors represent the output frequency of the healthy (PD0, black) neurons, the parkinsonian ones (PD2, blue), as well as levels of rewiring (PD2_r, orange) and strengthening (PD2_s, red). Specifically, B and C refer to dSPN when 20% and 60% compensation were applied, respectively. D and E refer to iSPN when 20% and 100% compensations were applied, respectively.

Similar articles

References

    1. Alberquilla, S., Gonzalez-Granillo, A., Martín, E. D., & Moratalla, R. (2020). Dopamine regulates spine density in striatal projection neurons in a concentration-dependent manner. Neurobiology of Disease, 134, 104666. 10.1016/j.nbd.2019.104666, - DOI - PubMed
    1. Aosaki, T., Miura, M., Suzuki, T., Nishimura, K., & Masuda, M. (2010). Acetylcholine–dopamine balance hypothesis in the striatum: An update. Geriatrics & Gerontology International, 10, S148–S157. 10.1111/j.1447-0594.2010.00588.x, - DOI - PubMed
    1. Azdad, K., Chàvez, M., Bischop, P. D., Wetzelaer, P., Marescau, B., De Deyn, P. P., … Schiffmann, S. N. (2009). Homeostatic plasticity of striatal neurons intrinsic excitability following dopamine depletion. PLoS One, 4(9), e6908. 10.1371/journal.pone.0006908, - DOI - PMC - PubMed
    1. Bamford, N. S., Zhang, H., Schmitz, Y., Wu, N.-P., Cepeda, C., Levine, M. S., … Sulzer, D. (2004). Heterosynaptic dopamine neurotransmission selects sets of corticostriatal terminals. Neuron, 42(4), 653–663. 10.1016/S0896-6273(04)00265-X, - DOI - PubMed
    1. Beck, G., Singh, A., & Papa, S. M. (2018). Dysregulation of striatal projection neurons in Parkinson’s disease. Journal of Neural Transmission, 125(3), 449–460. 10.1007/s00702-017-1744-5, - DOI - PMC - PubMed

LinkOut - more resources