. 2024 Dec 10;8(4):1192-1211.
doi: 10.1162/netn_a_00397. eCollection 2024.

A generative model of the connectome with dynamic axon growth

Affiliations

A generative model of the connectome with dynamic axon growth

Yuanzhe Liu et al. Netw Neurosci. .

Abstract

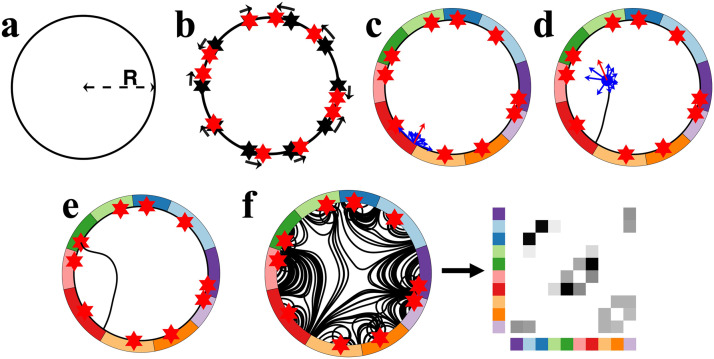
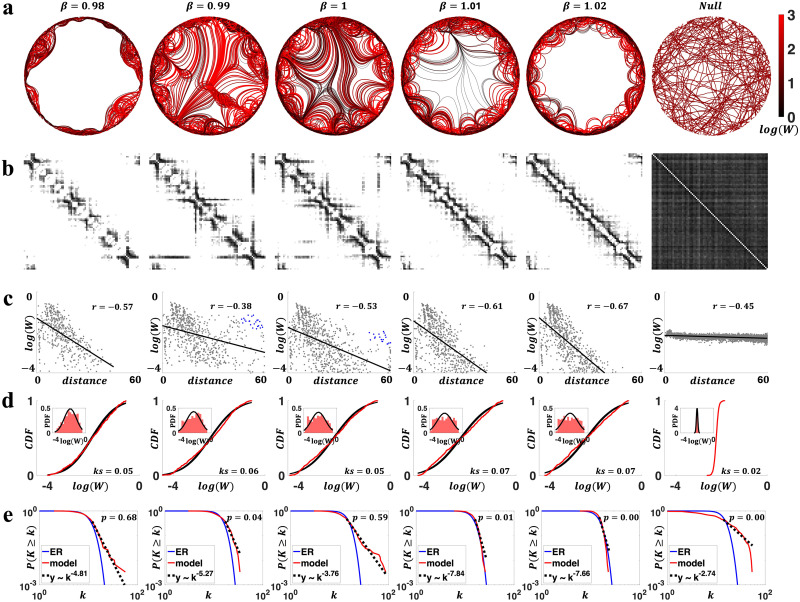
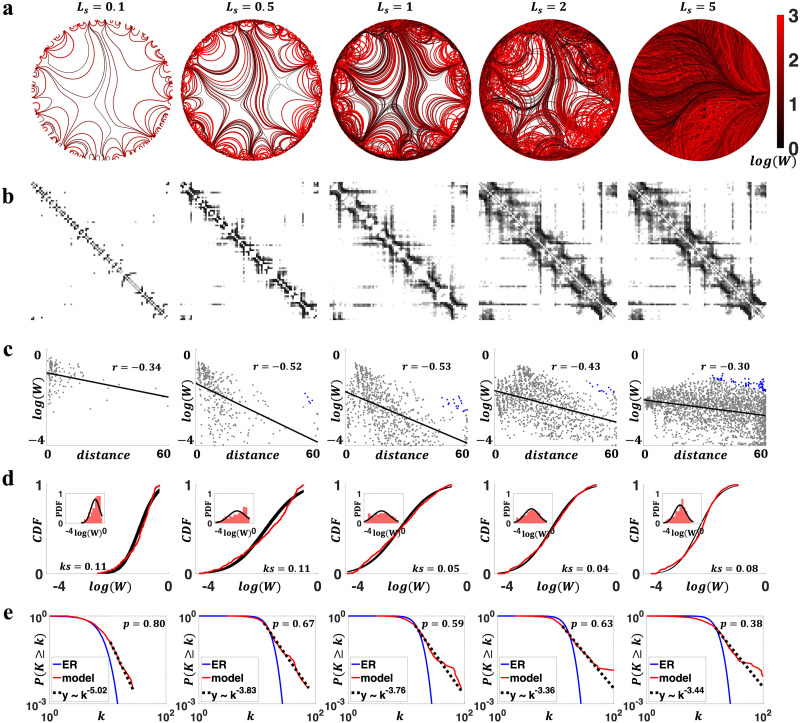
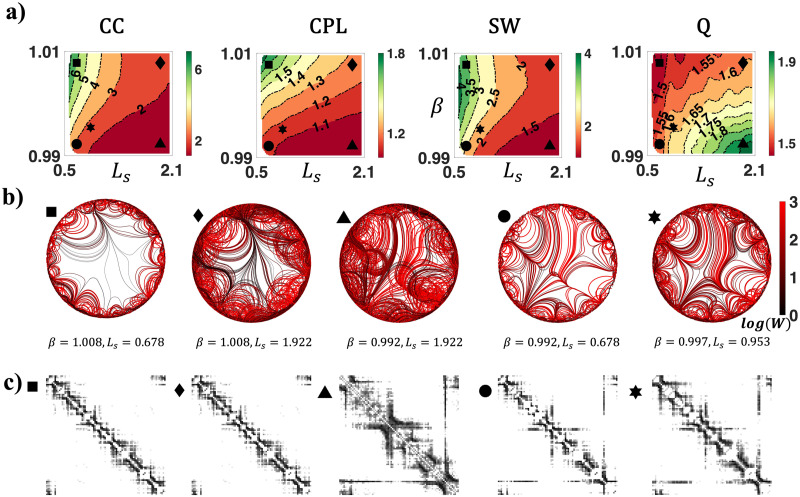
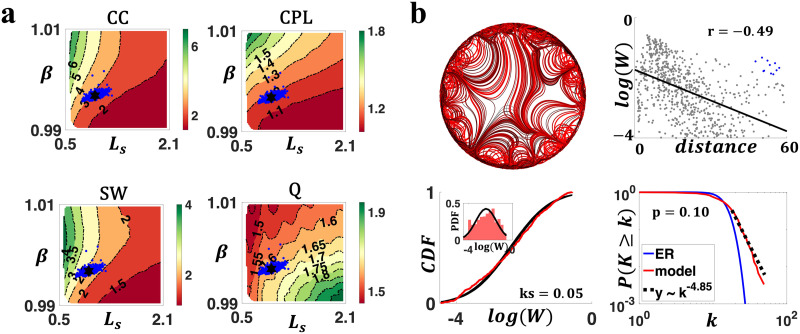
Connectome generative models, otherwise known as generative network models, provide insight into the wiring principles underpinning brain network organization. While these models can approximate numerous statistical properties of empirical networks, they typically fail to explicitly characterize an important contributor to brain organization-axonal growth. Emulating the chemoaffinity-guided axonal growth, we provide a novel generative model in which axons dynamically steer the direction of propagation based on distance-dependent chemoattractive forces acting on their growth cones. This simple dynamic growth mechanism, despite being solely geometry-dependent, is shown to generate axonal fiber bundles with brain-like geometry and features of complex network architecture consistent with the human brain, including lognormally distributed connectivity weights, scale-free nodal degrees, small-worldness, and modularity. We demonstrate that our model parameters can be fitted to individual connectomes, enabling connectome dimensionality reduction and comparison of parameters between groups. Our work offers an opportunity to bridge studies of axon guidance and connectome development, providing new avenues for understanding neural development from a computational perspective.

Keywords: Axon simulation; Connectome; Generative model; Network neuroscience.

Plain language summary

Generative models of the human connectome provide insight into principles driving brain network development. However, current models do not capture axonal outgrowth, which is crucial to the formation of neural circuits. We develop a novel generative connectome model featuring dynamic axonal outgrowth, revealing the contribution of microscopic axonal guidance to the network topology and axonal geometry of macroscopic connectomes. Simple axonal outgrowth rules representing continuous chemoaffinity gradients are shown to generate complex, brain-like topologies and realistic axonal fascicle architectures. Our model is sufficiently sensitive to capture subtle interindividual differences in axonal outgrowth between healthy adults. Our results are significant because they reveal core principles that may give rise to both complex brain networks and brain-like axonal bundles, unifying neurogenesis across scales.


Conflict of interest statement

Competing Interests: The authors have declared that no competing interests exist.

Figures

<b>Figure 1.</b>
Figure 1.
Illustrative example of the generative process governing axonal growth and network formation. (A) The model is formulated on a circle of radius R. (B) Coordinates are uniformly positioned along the circle’s circumference, each representing a node center (black hexagrams). We used 10 nodes in this illustrative example. The coordinates are randomly perturbed on the circumference (in the direction of black arrows; new node centers are represented with red hexagrams) to introduce nodal heterogeneity. (C) Node regions (colored patches) are defined through a 1D Voronoi tessellation approach along the perimeter. An axon is seeded on the perimeter. It perceives an attractive force from all nodes (blue arrows) and propagates step by step in the direction of the net force (red arrow). (D) The net force experienced by the growth cone is updated at each propagation step to ensure that nodes that become closer to the growth cone exert greater force, while nodes further from the growth cone exert less force. (E) The simulated axon forms a connection when its growth cone reaches a point on the circular circumference. (F) Multiple axons are generated, giving rise to structures resembling axonal fiber bundles. The endpoints of axons are assigned to the nearest nodes to construct a network, and the generated network is represented using a weighted, undirected connectivity matrix.
<b>Figure 2.</b>
Figure 2.
Characterization of generated connectomes under variation of the force decay parameter (i.e., β). Ls was fixed to 1. (A) Circles show the generated axons for different values of β (0.98–1.02). The rightmost circle shows generated axons using a random walk null model. Axons are color-coded (using a black-red spectrum; see the color bar) by connection weights, such that black (red) curves represent weaker (stronger) connections. The color scale is truncated at a connectivity weight of 103. The null network shows 5% of axons generated. (B) Connectivity matrices for networks in panel (A). Nodes are ordered such that geometrically adjacent nodes are close to each other. Connectivity weights are log-scaled and normalized between 0 and 1. (C) Scatterplots of connection weights (log-scaled) versus distances for networks in panel (A). Strong long-range connections that deviate from the EDR are shown as blue dots in β = 0.99 and 1. Distributions of connection weights and distances are shown in the marginal histograms. (D) Distributions of connection weights (normalized by nodal strength) for networks in panel (A) (red), compared with the fitted lognormal distributions (black), in terms of the cumulative density function (CDF; main figures) and probability density function (PDF; insets), respectively. KS described the one-sample Kolmogorov-Smirnov statistics of lognormal fit. (E) Nodal degree distributions for the evaluated β values. Results (with median p value among 1,000 simulations; model and null) are compared with Erdös-Rényi random networks (ER) and scale-free fits (ykα). Scale-free distribution is plausible if p > 0.1.
<b>Figure 3.</b>
Figure 3.
Characterization of generated networks changed under variation in the step length parameter (i.e., Ls). Results are visualized for representative parameter combinations (Ls = 0.1–5 and fixed β = 1). (A) Axon organizations of model networks. A higher network density was evident with increasing Ls (4, 11, 24, 35, and 75% connectivity density, from left to right). (B) Connectivity matrices for networks in panel (A). (C) Negative associations between connection weights and distances, with blue dots in Ls = 0.5, 1, 2, and 5 representing strong long-range connections that deviate from the EDR. Distributions of connection weights and distances are shown in the marginal histograms. (D) Distributions of connectivity weights (normalized by nodal strength) in model networks (red), compared with fitted log-normal distribution (black). The main figure compared CDF, and the insets compared PDF. (E) Degree distributions in generated networks, compared with ER networks and scale-free fit. All evaluated Ls values showed scale-free behaviors (median p > 0.1).
<b>Figure 4.</b>
Figure 4.
Complex topological organization of the generated connectomes. (A) Contour plots of the weighted network average CC, CPL, SW, and modularity Q of generated networks, benchmarked to null networks with preserved weight, degree, and strength distributions. All measures were normalized to the null networks. (B) Axon organization of example networks, generated by parameters labeled with a square (β = 1.008, Ls = 0.678), diamond (β = 1.008, Ls = 1.922), triangle (β = 0.992, Ls = 1.922), circle (β = 0.992, Ls = 0.678), and hexagram (β = 0.997, Ls = 0.953) in panel (A). (C) Connectivity matrices of example networks in (B).
<b>Figure 5.</b>
Figure 5.
Individual parameters for HCP connectomes. (A) Optimized individual parameters (blue dots) overlaid on the contour plots of weighted topological measures (CC, CPL, SW, and modularity Q). The black hexagram represents the group average parameters (β = 0.9968, Ls = 0.9531). (B) Networks simulated with the HCP group average parameters showed organic axon organization (top left), negatively associated connection weights and distances (top right; blue dots represent strong long-range connections that deviate from the EDR), lognormally distributed weights (bottom left), and scale-free degree distributions (bottom right; despite the p value marginally above the threshold of p = 0.1).

Update of

Similar articles

Cited by

References

    1. Akarca, D., Schiavi, S., Achterberg, J., Genc, S., Jones, D. K., & Astle, D. E. (2023). A weighted generative model of the human connectome. bioRxiv. 10.1101/2023.06.23.546237 - DOI
    1. Akarca, D., Vértes, P. E., Bullmore, E. T., CALM team, & Astle, D. E. (2021). A generative network model of neurodevelopmental diversity in structural brain organization. Nature Communications, 12(1), 4216. 10.1038/s41467-021-24430-z, - DOI - PMC - PubMed
    1. Alberts, B. (2017). Molecular biology of the cell. Garland Science. 10.1201/9781315735368 - DOI
    1. Amunts, K., Lepage, C., Borgeat, L., Mohlberg, H., Dickscheid, T., Rousseau, M.-É., … Evans, A. C. (2013). BigBrain: An ultrahigh-resolution 3D human brain model. Science, 340(6139), 1472–1475. 10.1126/science.1235381, - DOI - PubMed
    1. Arnatkevičiūtė, A., Fulcher, B. D., & Fornito, A. (2019). A practical guide to linking brain-wide gene expression and neuroimaging data. NeuroImage, 189, 353–367. 10.1016/j.neuroimage.2019.01.011, - DOI - PubMed

LinkOut - more resources