. 2024 Dec 13:15:1422497.
doi: 10.3389/fimmu.2024.1422497. eCollection 2024.

Identification and verification of the optimal feature genes of ferroptosis in thyroid-associated orbitopathy

Affiliations

Identification and verification of the optimal feature genes of ferroptosis in thyroid-associated orbitopathy

Xuemei Li et al. Front Immunol. .

Abstract

Background: Thyroid-associated orbitopathy (TAO) is an autoimmune inflammatory disorder of the orbital adipose tissue, primarily causing oxidative stress injury and tissue remodeling in the orbital connective tissue. Ferroptosis is a form of programmed cell death driven by the accumulation of reactive oxygen species (ROS), iron metabolism disorder, and lipid peroxidation. This study aims to identify and validate the optimal feature genes (OFGs) of ferroptosis with diagnostic and therapeutic potential in TAO orbital adipose tissue through bioinformatics analysis and to assess their correlation with disease-related immune cell infiltration.

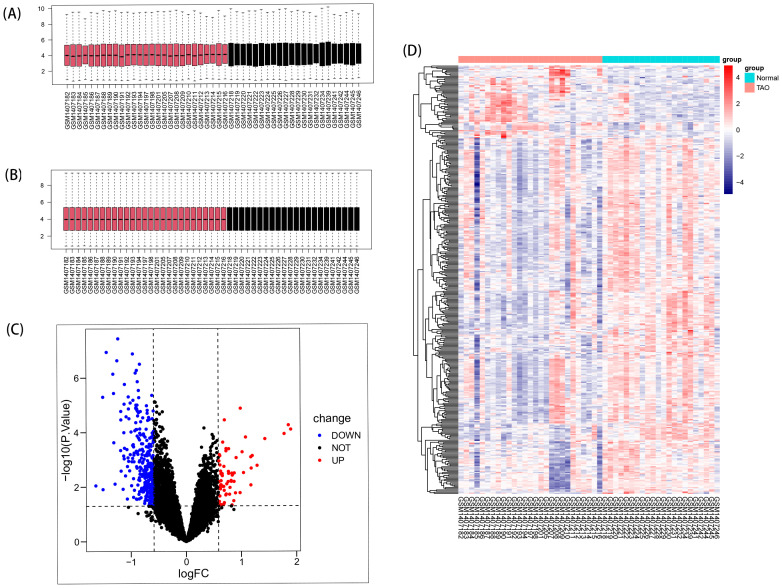
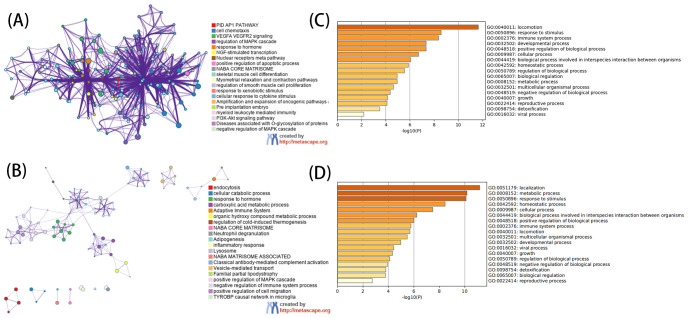
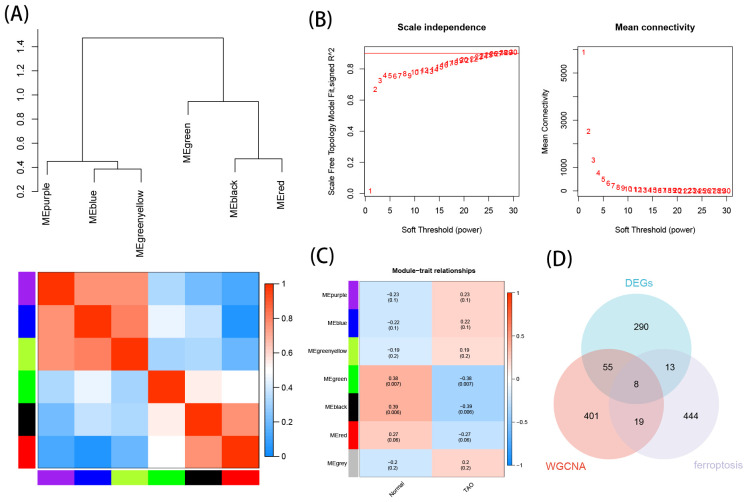
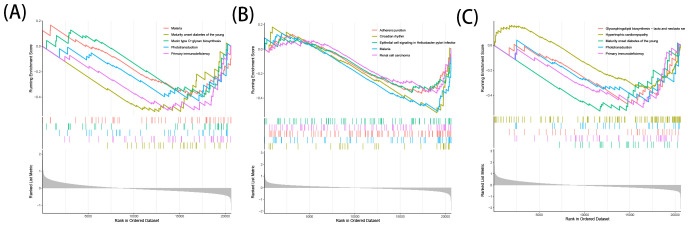
Methods: Search of the Gene Expression Omnibus database for TAO-related gene datasets led to the selection of GSE58331 for differential gene expression analysis. WGCNA was employed to identify key disease modules and hub genes. The intersection of DEGs, hub genes and ferroptosis-related gene yielded key genes of ferroptosis. Machine learning algorithms identified OFGs of ferroptosis. Meanwhile, by comparing the expression of FRGs in the orbital adipose tissue and the orbital fibroblasts (OFs) of healthy controls and TAO patients, as well as co-culturing macrophages and OFs in vitro, the influence of macrophages on FRGs in OFs was explored. CIBERSORT analyzed immune cell infiltration to determine proportions of immune cell types in each sample, and Spearman correlation analysis explored relationships between OFGs and infiltrating immune cells. Finally, GSEA determined the function of each key biomarker based on the median expression of OFGs.

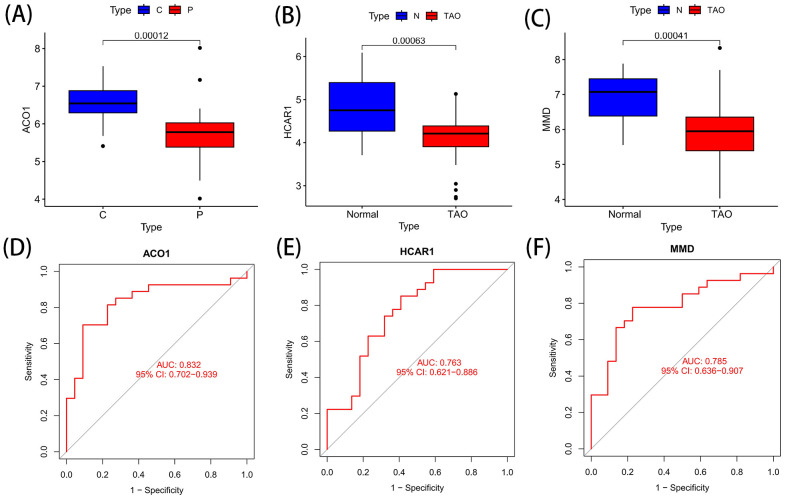
Results: Three TAO FRGs (ACO1, MMD, and HCAR1) were screened in the dataset. The ROC results of ACO1 showed that the AUC value was greater than 0.8 in all the datasets, which was the strongest for disease specificity and diagnostic ability. Validation results showed that, in addition to MMD, the expression of ACO1 and HCAR1 in orbital adipose tissue of TAO patients was significantly down-regulated, while M2-type macrophages might be involved in regulating the expression of ACO1 in orbital adipose-derived OFs. CIBERSORT immune cell infiltration analysis showed that in orbital adipose tissue of TAO patients, memory B-lymphocytes, T regulatory cells, NK-cells, M0-type macrophages, M1-type macrophages, resting dendritic cells, activated mast cells, and neutrophils infiltration levels were significantly elevated.

Conclusion: Through bioinformatics analysis, this study identified and validated two OFGs of ferroptosis with diagnostic and therapeutic potential in TAO orbital adipose tissue, suggesting that the downregulation of ACO1 and HCAR1 may be potential molecular targets in the pathogenesis of TAO.

Keywords: GEO; WGCNA; ferroptosis-related gene; immune cell infiltration; orbitopathy.


Conflict of interest statement

The authors declare that the research was conducted in the absence of any commercial or financial relationships that could be construed as a potential conflict of interest.

Figures

Figure 1
Figure 1
The flow chart of this study.
Figure 2
Figure 2
DEGs in anterior orbital adipose tissue between the TAO and Normal individuals. (A) Box plots of included samples before removing batch effects. (B) Box plots of included samples after removing batch effects. (C) Volcano plot of DEGs. Data points in red are up-regulated genes, and in blue are down-regulated genes. (D) The heatmap shows the clustering of DEGs in the normal and TAO groups, with red squares representing up-regulation, blue squares representing down-regulation, and the darker color represents the higher fold of differential expression.
Figure 3
Figure 3
Functional analysis of DEGs. (A) For GO enrichment analysis of up-regulated DEGs. (B) For GO enrichment analysis of down-regulated DEGs. (C) For KEGG enrichment analysis of up-regulated DEGs. (D) For KEGG enrichment analysis of down-regulated DEGs. (A, C) use network graphs to display the correlation between enriched pathways, with pathways having a correlation greater than 0.3 connected by lines, and different colors representing different enriched pathways. The length of the bar corresponds to the scale after transformation by log10(P) into the enriched P value, with a longer bar and darker color indicating a more significant enrichment of that function.
Figure 4
Figure 4
Construction of WGCNA networks and obtain the key genes of ferroptosis in TAO. (A) Clustering of module eigengenes, and heat map shows the correlation between each module. (B) Scale independence and mean connectivity of various soft-thresholding. (C) Module–trait relationships. (D) Venn diagram shows the intersection of WGCNA hub genes, EDGs and FRGs.
Figure 5
Figure 5
Acquisition of the OFGs of ferroptosis in TAO. (A) Biomarker detection using LASSO regression analysis. (B) biomarker detection by SVM-REF. (C, D) Biomarker detection by random forest. (E) Venn diagram shows the shared diagnostic markers of ferroptosis in TAO between LASSO, SVM-REF and random forest.
Figure 6
Figure 6
Differential expression and ROC curve of OFGs of ferroptosis. (A) The expression difference of ACO1 between TAO and Normal. (B) The expression difference of HCRA1 between TAO and Normal. (C) The expression difference of MMD between TAO and Normal. (D) The predictive value of ACO1 in TAO from the ROC curve. (E) The predictive value of HCRA1 in TAO from the ROC curve. (F) The predictive value of MMD in TAO from the ROC curve. Each panel displayed the AUC under the curve and 95% CI. ROC, ROC curve; AUC, area under the curve; CI, confidence interval.
Figure 7
Figure 7
GSEA analysis of OFGs for ferroptosis in TAO. (A) GSEA analysis of ACO1. (B) GSEA analysis of HCRA1. (C) GSEA analysis of MMD.
Figure 8
Figure 8
Immune cell infiltration analysis. (A) Violin diagram of the proportion of 22 types of immune cells. The red marks represent the difference in infiltration between the TAO and Normal samples. (B) Correlation analysis of immune cell infiltrations with three OFGs. Red represents a positive correlation, and blue represents a negative correlation. Darker color implies stronger correlation. *P < 0.05, **P < 0.01, ***P < 0.001. ns, no significance.
Figure 9
Figure 9
The expression of three FRGS in orbital fat was verified between the healthy control group and the TAO patient group. (A-C) The transcription levels of the three FRGS in orbital fat were different. (D-F) The protein levels of the three FRGS in orbital fat were different. (Notes: The transcript level expression of these FRGs was normalized to that of β-actin, and the protein level was normalized to that of GAPDH. The statistical significance of differences was calculated by the Student’s t-test. The results are presented as the mean ± SEM. n= 3; ns: p > 0.05,*P < 0.05, **P < 0.01, ***P < 0.001, ****P<0.0001).
Figure 10
Figure 10
The expression of primary cells from orbital fat of healthy people and TAO patients in the three FRGS was verified. (A-D) The primary cells were fibroblasts. (E-G) The transcription levels of the three FRGS were different in the primary cells. (H-J) The protein levels of the three FRGS were different in the primary cells. (Notes: The transcript level expression of these FRGs was normalized to that of β-actin, and the protein level was normalized to that of GAPDH. The statistical significance of differences was calculated by the Student’s t-test. The results are presented as the mean ± SEM. n= 3; ns: p > 0.05,*P < 0.05, **P < 0.01, ***P < 0.001, ****P<0.0001).
Figure 11
Figure 11
Expression verification of three FRGS after interaction between primary cells from orbital fat of TAO patients and macrophages. (A) THP cells. (B) M0 macrophages. (C) M2 macrophages. (D) validation of M0 macrophages. (E) validation of M2 macrophages. (F-H) Differences in protein levels of three FRGS in primary cell-macrophage interactions after exchange. (The protein levels of these FRGs were normalized to the expression of GAPDH. The statistical significance of differences was calculated by the Student’s t-test. The results are presented as the mean ± SEM. n= 3; ns: p > 0.05,*P < 0.05, **P < 0.01, ***P < 0.001, ****P<0.0001).

Similar articles

Cited by

References

    1. Bahn RS. Graves' Ophthalmopathy. N Engl J Med. (2010) 362:726–38. doi: 10.1056/Nejmra0905750 - DOI - PMC - PubMed
    1. Bartalena L, Piantanida E, Gallo D, Lai A, Tanda ML. Epidemiology, natural history, risk factors, and prevention of graves' Orbitopathy. Front Endocrinol (Lausanne). (2020) 11:615993. doi: 10.3389/Fendo.2020.615993 - DOI - PMC - PubMed
    1. Yang S, Wang X, Xiao W, Xu Z, Ye H, Sha X, et al. . Dihydroartemisinin exerts antifibrotic and anti-inflammatory effects in graves' Ophthalmopathy by targeting orbital fibroblasts. Front Endocrinol (Lausanne). (2022) 13:891922. doi: 10.3389/Fendo.2022.891922 - DOI - PMC - PubMed
    1. Antonelli A, Fallahi P, Elia G, Ragusa F, Paparo SR, Ruffilli I, et al. . Graves' Disease: clinical manifestations, immune pathogenesis (Cytokines and chemokines) and therapy. Best Pract Res Clin Endocrinol Metab. (2020) 34:101388. doi: 10.1016/J.Beem.2020.101388 - DOI - PubMed
    1. Bartalena L, Ml T, Piantanida E, Lai A. Oxidative stress and graves' Ophthalmopathy: in vitro studies and therapeutic implications. Biofactors. (2003) 19:155–63. doi: 10.1002/Biof.5520190308 - DOI - PubMed

LinkOut - more resources