. 2024 Dec 13:15:1509370.
doi: 10.3389/fimmu.2024.1509370. eCollection 2024.

ATP5J regulates microglial activation via mitochondrial dysfunction, exacerbating neuroinflammation in intracerebral hemorrhage

Affiliations

ATP5J regulates microglial activation via mitochondrial dysfunction, exacerbating neuroinflammation in intracerebral hemorrhage

Naixin Ren et al. Front Immunol. .

Abstract

Microglial-mediated neuroinflammation is crucial in the pathophysiological mechanisms of secondary brain injury (SBI) following intracerebral hemorrhage (ICH). Mitochondria are central regulators of inflammation, influencing key pathways such as alternative splicing, and play a critical role in cell differentiation and function. Mitochondrial ATP synthase coupling factor 6 (ATP5J) participates in various pathological processes, such as cell proliferation, migration, and inflammation. However, the role of ATP5J in microglial activation and neuroinflammation post-ICH is poorly understood. This study aimed to investigate the effects of ATP5J on microglial activation and subsequent neuroinflammation in ICH and to elucidate the underlying mechanisms. We observed that ATP5J was upregulated in microglia after ICH. AAV9-mediated ATP5J overexpression worsened neurobehavioral deficits, disrupted the blood-brain barrier, and increased brain water content in ICH mice. Conversely, ATP5J knockdown ameliorated these effects. ATP5J overexpression also intensified microglial activation, neuronal apoptosis, and inflammatory responses in surrounding tissues post-ICH. ATP5J impaired microglial dynamics and reduced the proliferation and migration of microglia to injury sites. We used oxyhemoglobin (OxyHb) to stimulate BV2 cells and model ICH in vitro. Further in vitro studies showed that ATP5J overexpression enhanced OxyHb-induced microglial functional transformation. Mechanistically, ATP5J silencing reversed dynamin-related protein 1 (Drp1) and mitochondrial fission 1 protein (Fis1) upregulation in microglia post-OxyHb induction; reduced mitochondrial overdivision, excessive mitochondrial permeability transition pore opening, and reactive oxygen species production; restored normal mitochondrial ridge morphology; and partially restored mitochondrial respiratory electron transport chain activity. ATP5J silencing further alleviated OxyHb-induced mitochondrial dysfunction by regulating mitochondrial metabolism. Our results indicate that ATP5J is a key factor in regulating microglial functional transformation post-ICH by modulating mitochondrial dysfunction and metabolism, thereby positively regulate neuroinflammation. By inhibiting ATP5J, SBI following ICH could be prevented. Therefore, ATP5J could be a candidate for molecular and therapeutic target exploration to alleviate neuroinflammation post-ICH.

Keywords: ATP5J; intracerebral hemorrhage; microglia; mitochondrial reprogramming; secondary brain injury.


Conflict of interest statement

The authors declare that the research was conducted in the absence of any commercial or financial relationships that could be construed as a potential conflict of interest.

Figures

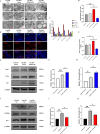
Figure 1
Figure 1
Expression profile of ATP5J in ICH mice. (A) Flow chart illustrating the experimental design in vivo. Assays were conducted at various time points post-ICH onset. (B) mRNA levels of ATP5J in perihematomal tissues at the indicated time points. (C) Protein levels of ATP5J in perihematomal tissues at the indicated time points. (D) Quantification of the ATP5J protein expression in perihematomal tissues at the indicated time points. Statistical significance: *p < 0.05, **p < 0.01, ***p < 0.001 compared with Sham; # p < 0.05, ## p < 0.01 compared with 72H. Data were presented as mean ± SE, where the mean values of the Sham group were normalized to 1. Group sizes: n = 6 per group.
Figure 2
Figure 2
Spatial localization of ATP5J in ICH mice. The following assays were performed after ICH at 72H. Double immunofluorescent analysis was performed using ATP5J antibodies (red) and the neuronal marker NeuN (green), the microglial marker Iba-1 (green), the vascular marker CD31, or the astrocyte marker (green) in brain sections. Nuclei were fluorescently labeled with 4,6-diamino-2-phenylindole (DAPI; blue; n = 6). Representative images of the ICH (72H) groups are shown. Images at 20× magnification were used for structural localization, while 40× mirror magnification highlights finer details. Scale bar = 20 μm.
Figure 3
Figure 3
ATP5J modulates behavioral outcomes, neurological deficits, and cell apoptosis following intracerebral hemorrhage (ICH). (A) ATP5J knockdown significantly reduces corner turn scores, indicating improved motor function, while ATP5J overexpression worsens performance. (B) ATP5J knockdown extends the latency to fall, suggesting enhanced motor coordination, whereas ATP5J overexpression shortens the latency. (C) ATP5J knockdown improves forelimb placing scores, reflecting enhanced motor function, while ATP5J overexpression leads to a decline. (D) ATP5J knockdown markedly lowers neurological deficit scores, indicating functional recovery, while ATP5J overexpression exacerbates deficits. (E) ATP5J knockdown decreases the number of TUNEL-positive cells, indicating reduced apoptosis, whereas ATP5J overexpression significantly increases apoptotic cell counts. Representative images were captured at 40× magnification, and the scale bar = 20 μm (n = 6 per group). (F) Quantification of TUNEL-positive cells. Statistical significance: *p < 0.05, **p < 0.01, ***p < 0.001.
Figure 4
Figure 4
Effects of the knockdown and overexpression of ATP5J on ICH-induced hematoma expansion, brain edema, and blood–brain barrier permeability. (A) Representative images of Evans blue extravasation. (B) Quantification of Evans blue extravasation 72 h after ICH (n = 6 per group). (C, D) Representative images of the expansion size of the hematoma and the quantification of the hemorrhagic volume in different groups. (G) Quantification of brain water content 72 h after ICH (n = 6 per group). (E-G) AQP4 and MMP-9 protein levels in mouse brain tissues around the hematoma 72 h after ICH. Statistical significance: *p < 0.05, **p < 0.01, ***p < 0.001; # p < 0.05, n = 6 per group.
Figure 5
Figure 5
Reducing effects of ATP5J knockdown on microglial activation and morphological changes after ICH. (A) Immunohistochemistry staining of activated microglia (Iba-1) in the perihematomal region, 72 hours after ICH. Scale bar = 50 μm (n = 6 per group). (B) Representative images of activated microglia (red) in the perihematomal region, used for the measurement of morphological parameters and quantitative analysis, including intersections (C), average branch length (D), and endpoint branch numbers (E). Scale bar = 20 μm (n = 6 per group). Statistical significance: *p < 0.05, ***p < 0.001; #p < 0.05, ##p < 0.01, ###p < 0.001.
Figure 6
Figure 6
Attenuating effects of ATP5J knockdown on the pro-inflammatory state of microglia in vivo. (A, C) Representative images of double immunofluorescent analysis using Iba-1 antibodies (red) and either the pro-inflammatory marker iNOS (green) or the anti-inflammatory marker Arg-1 (green) in brain sections from the perihematomal region, 72 hours after ICH. Scale bar = 20 μm (n = 6 per group). (B, D) Quantification of Arg-1+Iba-1+ cells and iNOS+Iba-1+ cells in the perihematomal region. Statistical significance: *p < 0.05, **p < 0.01, ###p < 0.001.
Figure 7
Figure 7
Increased brain inflammation by ATP5J overexpression and reduced inflammatory response by ATP5J knockdown. (A–C) Immunoblot analysis of TNF-α and IL-1β expression in the perihemorrhagic tissues of ICH mice. (D, G) mRNA expression levels of inflammatory markers (IL-6 and iNOS) in ICH mice after ATP5J knockdown or overexpression. (E, F) mRNA expression levels of anti-inflammatory markers (CD206 and Ym-1) in ICH mice after ATP5J knockdown or overexpression. Statistical significance: *p < 0.05, **p < 0.01, ***p < 0.001; ****p < 0.0001, # p < 0.05, ## p < 0.01, ### p < 0.001. n = 6 per group.
Figure 8
Figure 8
Reduction in the migration and repopulation of microglia to the perihematomal region via ATP5J expression upregulation after ICH in vivo. (A, B) Representative images and quantification of the immunofluorescence staining of BrdU and Iba-1 in the perihematomal tissues of ICH mice in each group. Scale bar = 20 μm (n = 6 per group). (C, D) Aggregation of Iba-1+ cells around neurons in brain tissues on the hemorrhagic side of ICH mice. Scale bar = 20 μm (n = 6 per group). Statistical significance: *p < 0.05, **p < 0.01, ### p < 0.001.
Figure 9
Figure 9
Reduction in the migration and repopulation of microglia to the perihematomal region via ATP5J expression upregulation after ICH in vitro. (A) Flow chart showing the experimental design in vitro. (B, G) Transwell assay was performed to determine the migratory capacity of BV2 cells after ATP5J knockdown or overexpression. (C) CCK-8 assay showed that the number of BV2 cells significantly decreased after ATP5J overexpression in vitro; this effect was mitigated by ATP5J knockdown. (D–F) mRNA expression levels of the BV2 cell homeostasis marker CX3CL1, the cell cycle arrest inducer CDKn1a, and the DNA replication inhibitor slfn5 after ATP5J knockdown or overexpression. Statistical significance: **p < 0.01, ***p < 0.001; p < 0.05, # p < 0.05, ## p < 0.01, ### p < 0.001. n = 3 per group.
Figure 10
Figure 10
Attenuation of the OxyHb-induced mitochondrial structure and dysfunction of BV2 cells via ATP5J knockdown. (A) Representative images of mitochondrial morphology under different conditions: the OxyHb+NC and OxyHb+Vector groups showed inner membrane collapse; the OxyHb+ATP5J-KD group exhibited a decrease in mitochondrial damage; the OxyHb+ATP5J-OE group had an increase in mitochondrial damage. Scale bars: 5 μm (black), 2 μm (white), and 500 nm (red). (B) Statistical analysis of the mitochondrial aspect ratio in BV2 cells treated with different methods. (C) Statistical analysis of the proportion of different crista structures in BV2 cells: tubular crista (**p < 0.01, ###p < 0.001), short tubular crista (*p < 0.05, ##p < 0.01), fragmented crista (**p < 0.01, ###p < 0.001), expanded crista (*p < 0.05, #p < 0.05), and large spherical crista (ns, p < 0.05). (D, E) Mitochondrial membrane potential measured via TMRE staining. Aggregated red fluorescence denotes normal mitochondria, while decreased red fluorescence indicates damaged mitochondria and decreased ΔΨm. Scale bar = 20 μm. (F, I) Protein expression levels of the mitochondrial division proteins Drp1 and Fis1 in each group. (G, H, J, K) Quantification of Drp1 and Fis1 protein expression in each group. “OxyHb+NC” represents BV2 cells transfected with NC siRNA and treated with 20 μM OxyHb; “OxyHb+Vector” includes cells transfected with an empty vector and treated with 20 μM OxyHb; “Control+NC” includes cells transfected with NC siRNA without OxyHb treatment. Statistical significance: *p < 0.05, **p < 0.01, ***p < 0.001; # p < 0.05, ## p < 0.01, ### p < 0.001. n = 3 per group.
Figure 11
Figure 11
Stimulation of mitochondrial metabolic reprogramming and ROS accumulation in BV2 cells by the OxyHb-induced upregulation of ATP5J expression. (A-E) Measurement of the enzymatic activities of mitochondrial electron transport chain complexes. (F, I, G, J) Flow cytometry analysis of intracellular ROS levels in BV2 cells from different groups. (H) Changes in ATP contents in BV2 cells from different groups. (K) Changes in lactate contents in BV2 cells from different groups. “OxyHb+NC” represents BV2 cells transfected with NC siRNA and treated with 20 μM OxyHb; “OxyHb+Vector” includes cells transfected with an empty vector and treated with 20 μM OxyHb; “Control+NC” includes cells transfected with NC siRNA without OxyHb treatment. Statistical significance: *p < 0.05, **p < 0.01, ***p < 0.001; # p < 0.05, ## p < 0.01, ### p < 0.001. n = 3 per group.

Similar articles

Cited by

References

    1. Shao Z, Tu S, Shao A. Pathophysiological mechanisms and motential therapeutic targets in intracerebral hemorrhage. Front Pharmacol. (2019) 10:1079. doi: 10.3389/fphar.2019.01079 - DOI - PMC - PubMed
    1. Wang R, Liang Z, Xue X, Mei H, Ji L, Wang B, et al. . Microglial FoxO3a deficiency ameliorates ferroptosis-induced brain injury of intracerebral haemorrhage via regulating autophagy and heme oxygenase-1. J Cell Mol Med. (2024) 28:e18007. doi: 10.1111/jcmm.18007 - DOI - PMC - PubMed
    1. Morotti A, Boulouis G, Dowlatshahi D, Li Q, Shamy M, Al-Shahi Salman R, et al. . Intracerebral haemorrhage expansion: definitions, predictors, and prevention. Lancet Neurol. (2023) 22:159–71. doi: 10.1016/S1474-4422(22)00338-6 - DOI - PubMed
    1. Liu J, Chen H, Yu T, Fu X, Qian C, Feng X. Berberine mitigates intracerebral hemorrhage-induced neuroinflammation in a gut microbiota-dependent manner in mice. Aging (Albany NY). (2023) 15:2705–20. doi: 10.18632/aging.204642 - DOI - PMC - PubMed
    1. Shi SX, Li Y-J, Shi K, Wood K, Ducruet AF, Liu Q. IL (Interleukin)-15 bridges astrocyte-microglia crosstalk and exacerbates brain injury following intracerebral hemorrhage. Stroke. (2020) 51:967–74. doi: 10.1161/STROKEAHA.119.028638 - DOI - PubMed

Substances

LinkOut - more resources