. 2024 Dec 13:15:1431200.
doi: 10.3389/fendo.2024.1431200. eCollection 2024.

Unveiling the molecular landscape of PCOS: identifying hub genes and causal relationships through bioinformatics and Mendelian randomization

Affiliations

Unveiling the molecular landscape of PCOS: identifying hub genes and causal relationships through bioinformatics and Mendelian randomization

Yifang He et al. Front Endocrinol (Lausanne). .

Abstract

Background: Polycystic ovary syndrome (PCOS) is a complex endocrine disorder with various contributing factors. Understanding the molecular mechanisms underlying PCOS is essential for developing effective treatments. This study aimed to identify hub genes and investigate potential molecular mechanisms associated with PCOS through a combination of bioinformatics analysis and Mendelian randomization (MR).

Methods: This study employed bioinformatics analysis in conjunction with MR methods using publicly available databases to identify hub genes. We employed complementary MR methods, including inverse-variance weighted (IVW), to determine the causal relationship between the hub genes and PCOS. Sensitivity analyses were performed to ensure results reliability. Enrichment analysis and immune infiltration analysis were further conducted to assess the role and mechanisms of hub genes in the development of PCOS. Additionally, we validated hub gene expression in both an animal model and serum samples from PCOS patients using qRT-PCR.

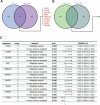
Results: IVW analysis revealed significant associations between 10 hub genes and the risk of PCOS: CD93 [P= 0.004; OR 95%CI= 1.150 (1.046, 1.264)], CYBB [P= 0.013; OR 95%CI= 1.650 (1.113,2.447)], DOCK8 [P= 0.048; OR 95%CI= 1.223 (1.002,1.494)], IRF1 [P= 0.036; OR 95%CI= 1.343 (1.020,1.769)], MBOAT1 [P= 0.033; OR 95%CI= 1.140 (1.011,1.285)], MYO1F [P= 0.012; OR 95%CI= 1.325 (1.065,1.649)], NLRP1 [P= 0.020; OR 95%CI= 1.143 (1.021,1.280)], NOD2 [P= 0.002; OR 95%CI= 1.139 (1.049,1.237)], PIK3R1 [P= 0.040; OR 95%CI= 1.241 (1.010,1.526)], PTER [P= 0.015; OR 95%CI= 0.923 (0.866,0.984)]. No heterogeneity and pleiotropy were observed. Hub genes mainly enriched in positive regulation of cytokine production and TNF signaling pathway, and exhibited positive or negative correlations with different immune cells in individuals with PCOS. qRT-PCR validation in both the rat model and patient serum samples confirmed hub gene expression trends consistent with our combined analysis results.

Conclusions: Our bioinformatics combined with MR analysis revealed that CD93, CYBB, DOCK8, IRF1, MBOAT1, MYO1F, NLRP1, NOD2, PIK3R1 increase the risk of PCOS, while PTER decreases the risk of PCOS. This discovery has implications for clinical decision-making in terms of disease diagnosis, prognosis, treatment strategies, and opens up novel avenues for drug development.

Keywords: Mendelian randomization; SNP; bioinformatic analysis; causal relationship; pcos.


Conflict of interest statement

The authors declare that the research was conducted in the absence of any commercial or financial relationships that could be construed as a potential conflict of interest.

Figures

Figure 1
Figure 1
Workflow chart of data generation and analysis.
Figure 2
Figure 2
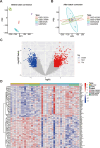
Identification of DEGs in GCs associated with PCOS patients and control subjects. (A) PCA plot of GC samples before batch correction; (B) PCA plot after batch correction; (C) The volcano plot. Red represent up-regulated genes, gray dots represent not significant genes, blue dots represent down-regulated genes; (D) Heat map. DEGs, differentially expressed genes. PCA, principal component analysis.
Figure 3
Figure 3
Identify of hub genes and MR results; (A) Venn diagram showed up-regulated hub genes; (B) Venn diagram showed down-regulated hub genes; (C) The forest plot of MR results for 10 hub genes and PCOS. MR, mendelian randomization.
Figure 4
Figure 4
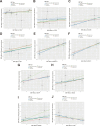
Scatter plots illustrate the causal effects of hub genes on PCOS. (A-I) Scatter plots showed that CD93, CYBB, DOCK8, IRF1, MBOAT1, MYO1F, NLRP1, NOD2, PIK3R1 significantly increased the risk of PCOS; (J) Scatter plots showed that PTER significantly reduced the risk of PCOS.
Figure 5
Figure 5
Forest plots illustrate the causal effects of hub genes on PCOS. (A-I) Forest plot of MR analysis results for CD93, CYBB, DOCK8, IRF1, MBOAT1, MYO1F, NLRP1, NOD2, PIK3R1; (J) Forest plot of MR analysis results for PTER on PCOS.
Figure 6
Figure 6
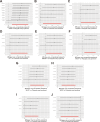
Forest plots of leave-one-out sensitivity analysis provide evidence supporting the validity of the IVW results. (A) CD93 on PCOS; (B) CYBB on PCOS; (C) DOCK8 on PCOS; (D) IRF1 on PCOS; (E) MBOAT1 on PCOS; (F) MYO1F on PCOS; (G) NLRP1 on PCOS; (H) NOD2 on PCOS; (I) PIK3R1 on PCOS; (J) PTER on PCOS.
Figure 7
Figure 7
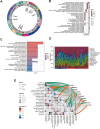
Bioinformatics analyses of hub genes. (A) Circos plot of hub genes; (B) GO enrichment analysis of hub genes; (C) KEGG enrichment analysis of the hub genes; (D) A Composition of infiltration immune cells in the PCOS and control groups; (E). Heat map of correlation between hub genes and immune cells, green and red lines indicated positive and negative correlations, respectively, with thicker lines indicating stronger correlations.
Figure 8
Figure 8
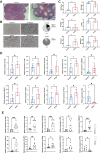
Construction of the DHEA- induced PCOS rat model and measurement of hub gene expression. (A) HE staining results of the ovarian tissues in various groups of rats, magnification: 40×; (B) Estrus status of rats in the DHEA and control groups; (C) Levels of sex hormones in rat serum; (D) Expression levels of Cd93, Cybb, Dock8, Irf1, Mboat1, Myo1f, Nlrp1, Nod2, Pik3r1, and Pter in rat ovarian tissue, as determined by qRT-PCR; (E) Expression levels of CD93, CYBB, DOCK8, IRF1, MBOAT1, MYO1F, NLRP1, NOD2, PIK3R1, and PTER in clinical serum samples as determined by qRT-PCR. PRGE, progesterone; PRL, prolactin; E2, estradiol; FSH, follicle-stimulating hormone; LH, luteinizing hormone; T, testosterone; AMH, anti-Mullerian hormone. The adjusted p value is ns, which is not significant. *P < 0.05, **P < 0.01 and ***P < 0.001.

Similar articles

Cited by

References

    1. Zhu T, Cui J, Goodarzi MO. Polycystic ovary syndrome and risk of type 2 diabetes, coronary heart disease, and stroke. Diabetes. (2021) 70:627–37. doi: 10.2337/db20-0800 - DOI - PubMed
    1. Safiri S, Noori M, Nejadghaderi SA, Karamzad N, Carson-Chahhoud K, Sullman MJM, et al. . Prevalence, incidence and years lived with disability due to polycystic ovary syndrome in 204 countries and territories, 1990-2019. Hum Reprod. (2022) 37:1919–31. doi: 10.1093/humrep/deac091 - DOI - PubMed
    1. Christ JP, Cedars MI. Current guidelines for diagnosing PCOS. Diagnostics (Basel). (2023) 13:1113. doi: 10.3390/diagnostics13061113 - DOI - PMC - PubMed
    1. Shrivastava S, Conigliaro RL. Polycystic ovarian syndrome. Med Clin North Am. (2023) 107:227–34. doi: 10.1016/j.mcna.2022.10.004 - DOI - PubMed
    1. Zehravi M, Maqbool M, Ara I. Polycystic ovary syndrome and infertility: an update. Int J Adolesc Med Health. (2021) 34:1–9. doi: 10.1515/ijamh-2021-0073 - DOI - PubMed

LinkOut - more resources