

Subseasonal Prediction of Heat-Related Mortality in Switzerland
- PMID: 39735735
- PMCID: PMC11669574
- DOI: 10.1029/2024GH001199
Subseasonal Prediction of Heat-Related Mortality in Switzerland
Abstract
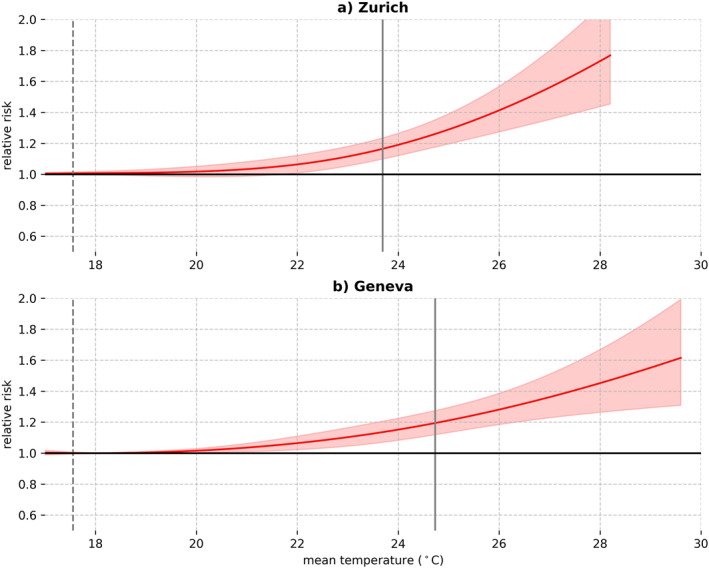
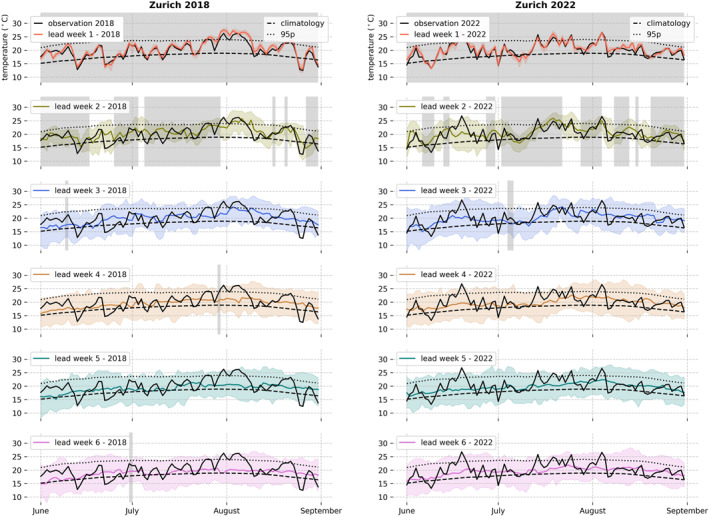
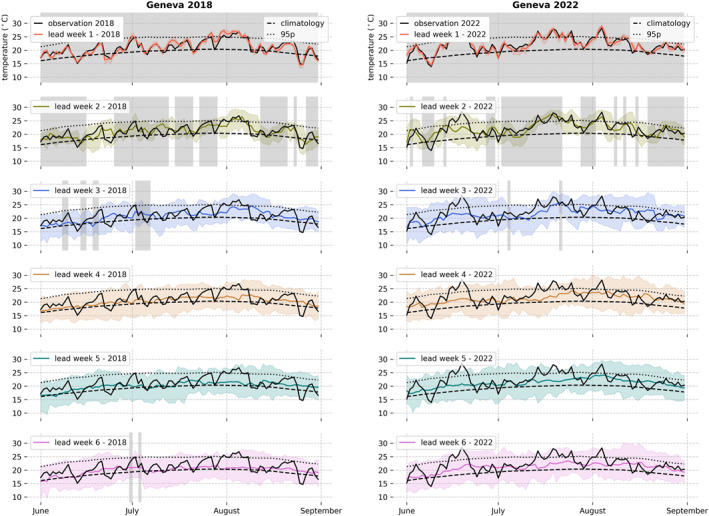
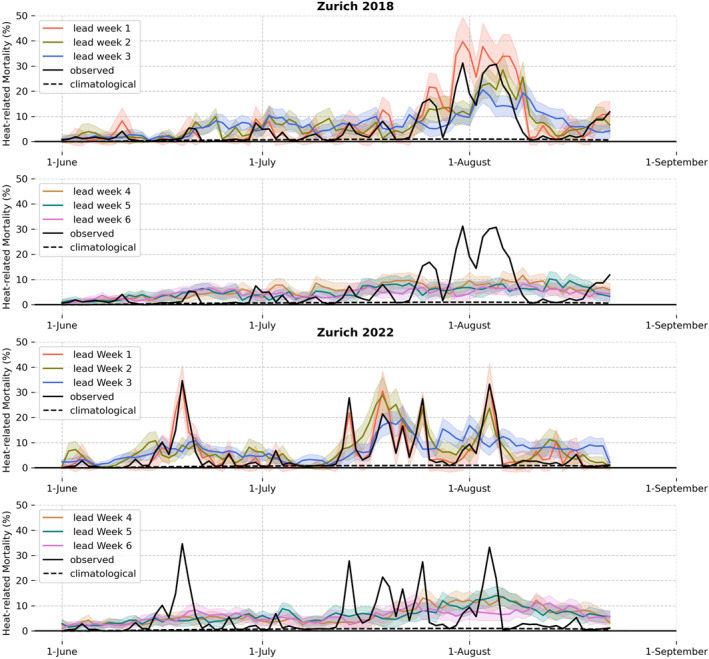
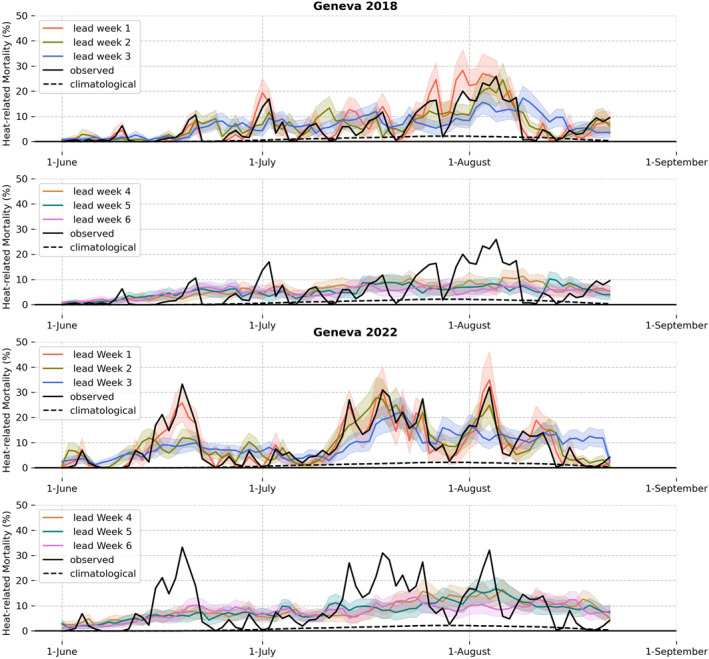
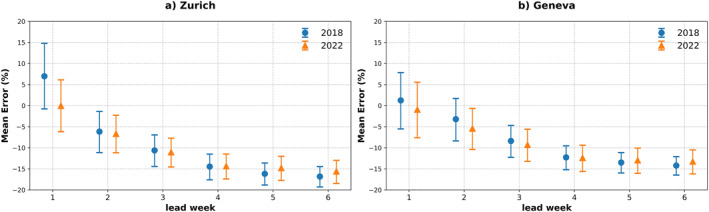
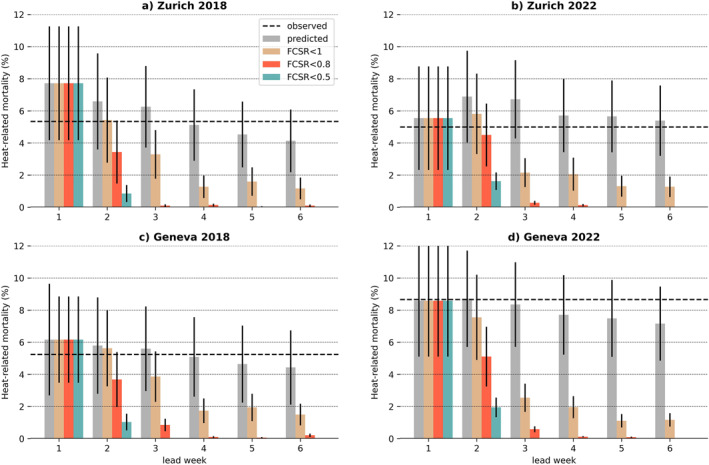
Heatwaves pose a range of severe impacts on human health, including an increase in premature mortality. The summers of 2018 and 2022 are two examples with record-breaking temperatures leading to thousands of heat-related excess deaths in Europe. Some of the extreme temperatures experienced during these summers were predictable several weeks in advance by subseasonal forecasts. Subseasonal forecasts provide weather predictions from 2 weeks to 2 months ahead, offering advance planning capabilities. Nevertheless, there is only limited assessment of the potential for heat-health warning systems at a regional level on subseasonal timescales. Here we combine methods of climate epidemiology and subseasonal forecasts to retrospectively predict the 2018 and 2022 heat-related mortality for the cantons of Zurich and Geneva in Switzerland. The temperature-mortality association for these cantons is estimated using observed daily temperature and mortality during summers between 1990 and 2017. The temperature-mortality association is subsequently combined with bias-corrected subseasonal forecasts at a spatial resolution of 2-km to predict the daily heat-related mortality counts of 2018 and 2022. The mortality predictions are compared against the daily heat-related mortality estimated based on observed temperature during these two summers. Heat-related mortality peaks occurring for a few days can be accurately predicted up to 2 weeks ahead, while longer periods of heat-related mortality lasting a few weeks can be anticipated 3 to even 4 weeks ahead. Our findings demonstrate that subseasonal forecasts are a valuable-but yet untapped-tool for potentially issuing warnings for the excess health burden observed during central European summers.
Keywords: Switzerland; extreme events; heatwaves; heat‐health warnings; mortality prediction; subseasonal forecast.
© 2024 The Author(s). GeoHealth published by Wiley Periodicals LLC on behalf of American Geophysical Union.
Conflict of interest statement
The authors declare no conflicts of interest relevant to this study.
Figures
Similar articles
-
Evaluation of an Early-Warning System for Heat Wave-Related Mortality in Europe: Implications for Sub-seasonal to Seasonal Forecasting and Climate Services.Int J Environ Res Public Health. 2016 Feb 6;13(2):206. doi: 10.3390/ijerph13020206. Int J Environ Res Public Health. 2016. PMID: 26861369 Free PMC article.
-
A machine learning model that outperforms conventional global subseasonal forecast models.Nat Commun. 2024 Jul 30;15(1):6425. doi: 10.1038/s41467-024-50714-1. Nat Commun. 2024. PMID: 39080287 Free PMC article.
-
The Mosquito, the Virus, the Climate: An Unforeseen Réunion in 2018.Geohealth. 2020 Aug 1;4(8):e2020GH000253. doi: 10.1029/2020GH000253. eCollection 2020 Aug. Geohealth. 2020. PMID: 32864539 Free PMC article.
-
[Heat-health action plans to prevent heat-related deaths-experiences from Switzerland].Bundesgesundheitsblatt Gesundheitsforschung Gesundheitsschutz. 2019 May;62(5):605-611. doi: 10.1007/s00103-019-02928-8. Bundesgesundheitsblatt Gesundheitsforschung Gesundheitsschutz. 2019. PMID: 30899963 Review. German.
-
The 2023 Latin America report of the Lancet Countdown on health and climate change: the imperative for health-centred climate-resilient development.Lancet Reg Health Am. 2024 Apr 23;33:100746. doi: 10.1016/j.lana.2024.100746. eCollection 2024 May. Lancet Reg Health Am. 2024. PMID: 38800647 Free PMC article. Review.
References
-
- Altalo, M. G. , & Smith, L. A. (2004). Using ensemble weather forecasts to manage utilities risk. Environmental Finance, 20(October), 8–9.
-
- Arias, P. , Bellouin, N. , Coppola, E. , Jones, R. , Krinner, G. , Marotzke, J. , et al. (2021). Climate change 2021: The physical science basis. Contribution of working group I to the sixth assessment report of the intergovernmental panel on climate change; technical summary. Cambridge University Press.
-
- Baker, L. , Charlton‐Perez, A. , & Mattu, K. L. (2023). Skilful sub‐seasonal forecasts of aggregated temperature over Europe. Meteorological Applications, 30(6), e2169. 10.1002/met.2169 - DOI
LinkOut - more resources
Full Text Sources