

Unveiling the molecular mechanism of sepal curvature in Dendrobium Section Spatulata through full-length transcriptome and RNA-seq analysis
- PMID: 39735769
- PMCID: PMC11671263
- DOI: 10.3389/fpls.2024.1497230
Unveiling the molecular mechanism of sepal curvature in Dendrobium Section Spatulata through full-length transcriptome and RNA-seq analysis
Abstract
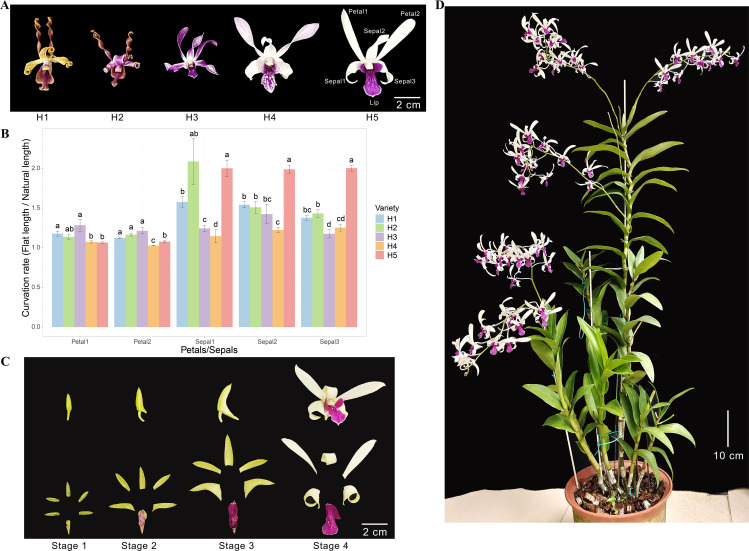
Introduction: Orchids are renowned for their intricate floral structures, where sepals and petals contribute significantly to ornamental value and pollinator attraction. In Dendrobium Section Spatulata, the distinctive curvature of these floral organs enhances both aesthetic appeal and pollination efficiency. However, the molecular and cellular mechanisms underlying this trait remain poorly understood.
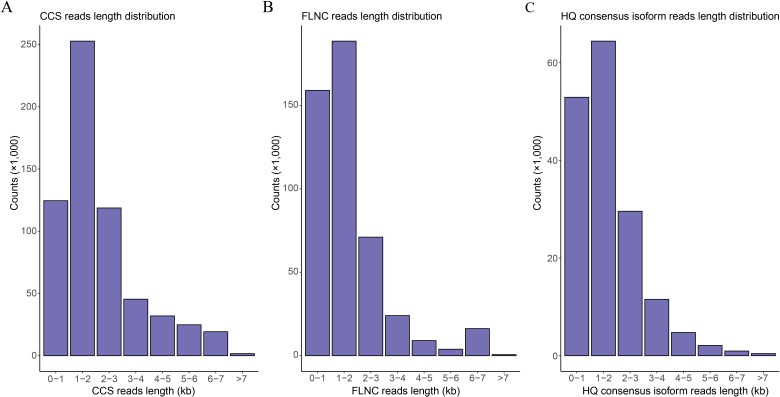
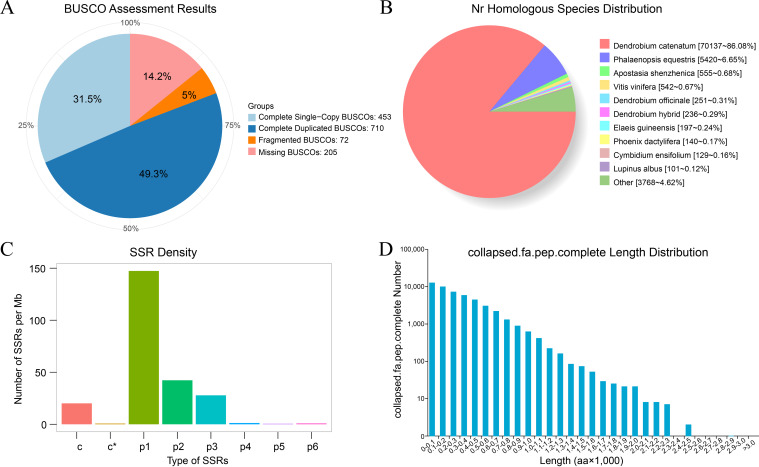
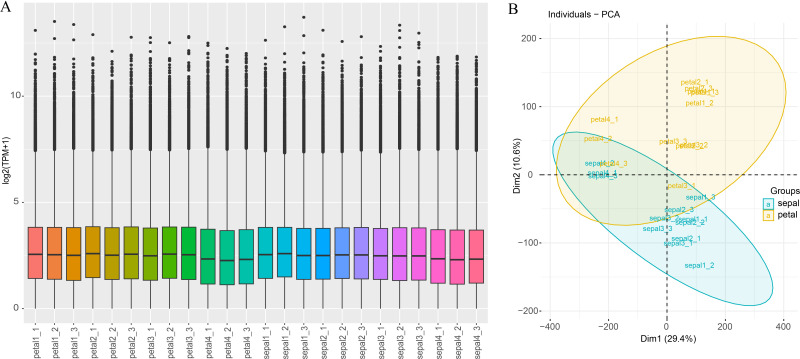
Methods: Morphological characteristics of five hybrids were analyzed, with a particular focus on hybrid H5, which exhibits pronounced sepal curling. Full-length transcriptomic sequencing was employed to assemble a reference transcriptome, while RNA-seq identified differentially expressed genes (DEGs) between sepals and petals. Gene ontology and pathway enrichment analyses were conducted to uncover biological processes associated with sepal curvature. Cytological microscopy was used to examine cell size and number, and quantitative real-time PCR (qRT-PCR) was performed to validate transcriptomic findings.
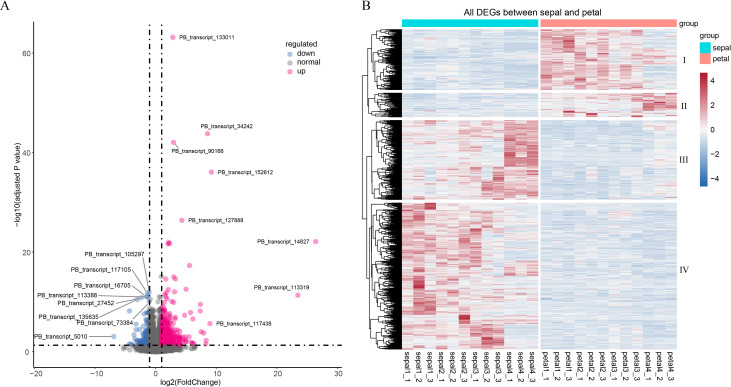
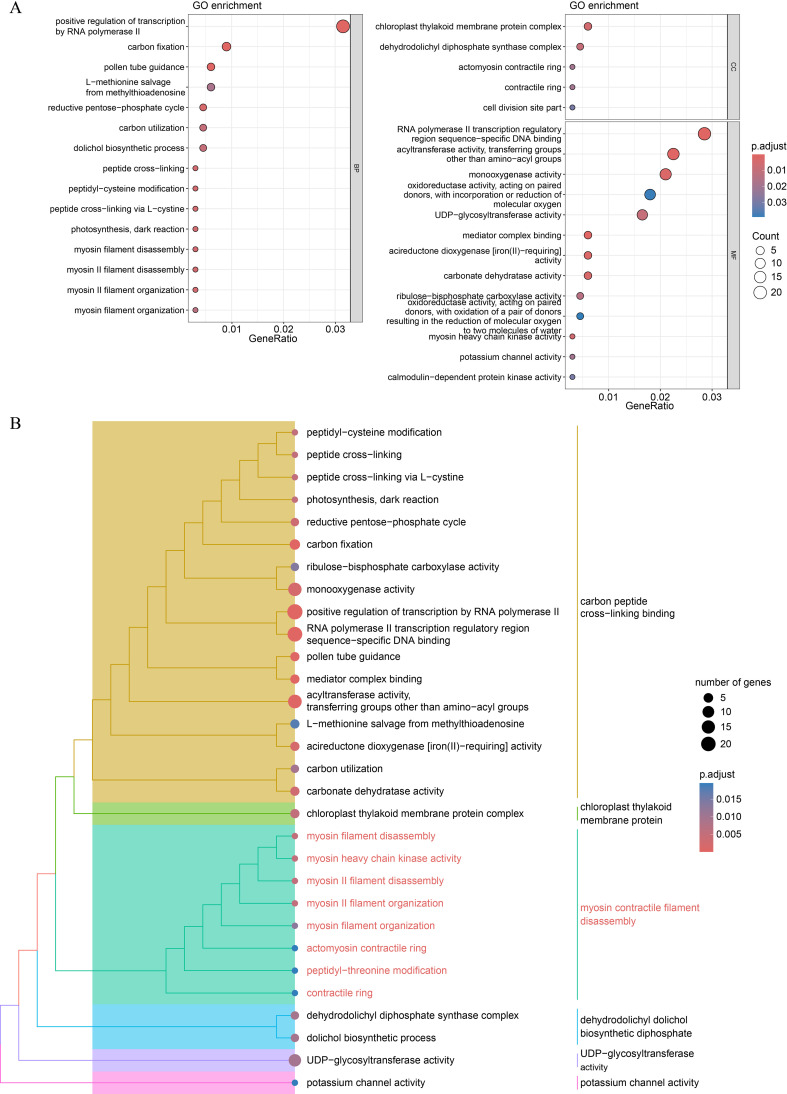
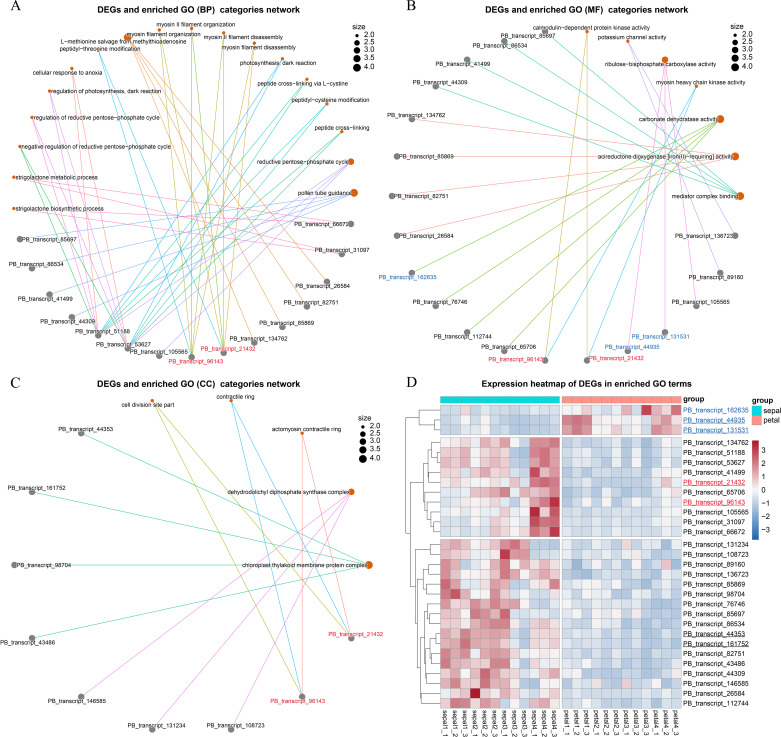
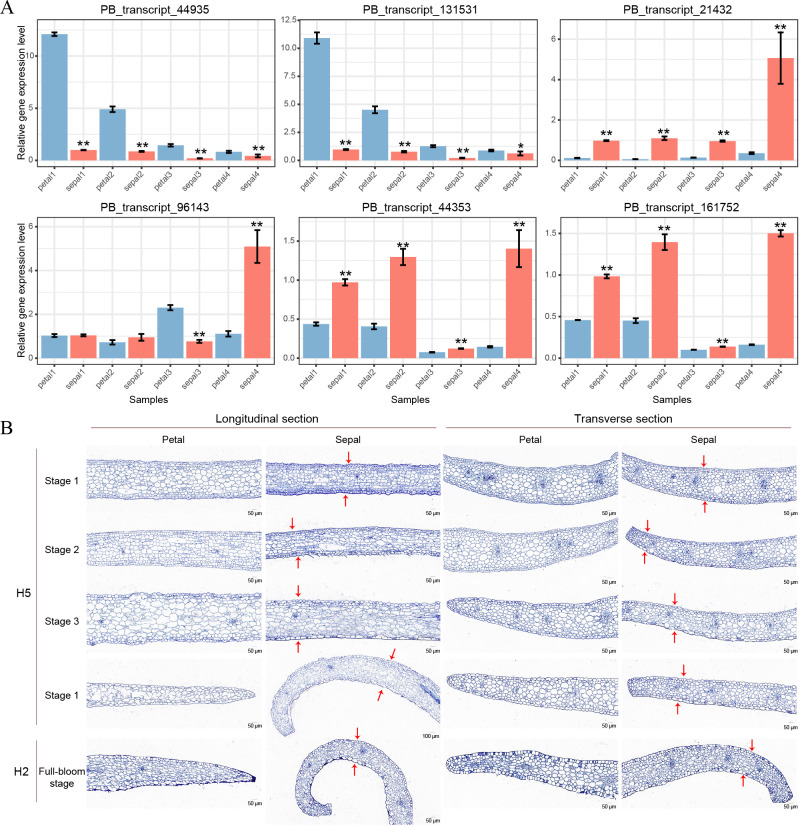
Results: The reference transcriptome contained 94,258 non-redundant transcripts, and RNA-seq identified 821 DEGs between sepals and petals, with 72.8% of these upregulated in sepals. Enrichment analysis revealed the significant involvement of DEGs in cytokinesis, cytoskeletal organization, and energy metabolism. Notably, myosin II filament organization was implicated in generating the mechanical forces responsible for curling, while metabolic pathways provided the energy necessary for these developmental processes. Cytological observations showed that the upper cell layers of the sepal were smaller and more numerous than the lower layers, indicating that differential cell growth contributes to sepal curvature. qRT-PCR analysis validated the differential expression of selected genes, supporting the transcriptomic findings.
Discussion: The interplay of cellular mechanics, cytoskeletal dynamics, and metabolic regulation is crucial in shaping sepal morphology. Future studies involving gene knockdown or overexpression experiments are recommended to validate the roles of specific genes in processes such as actin organization and myosin activity. Such work would provide deeper insights into the contributions of cytoskeletal dynamics and mechanical force generation to sepal morphogenesis.
Keywords: Dendrobium; cytokinesis; floral development; myosin filament; sepal curvature; transcriptomics.
Copyright © 2024 Qu, Li, Xu, Huang, Li, Jiang, Zheng, Fu, Zhang and Liu.
Conflict of interest statement
The authors declare that the research was conducted in the absence of any commercial or financial relationships that could be construed as a potential conflict of interest.
Figures
Similar articles
-
Comparative Transcriptomic Analysis of the Development of Sepal Morphology in Tomato (Solanum Lycopersicum L.).Int J Mol Sci. 2020 Aug 18;21(16):5914. doi: 10.3390/ijms21165914. Int J Mol Sci. 2020. PMID: 32824631 Free PMC article.
-
Post-pollination sepal longevity of female flower co-regulated by energy-associated multiple pathways in dioecious spinach.Front Plant Sci. 2022 Dec 14;13:1010149. doi: 10.3389/fpls.2022.1010149. eCollection 2022. Front Plant Sci. 2022. PMID: 36589106 Free PMC article.
-
Bulk Segregant Analysis Sequencing and RNA-Seq Analyses Reveal Candidate Genes Associated with Sepal Color Phenotype of Eggplant (Solanum melongena L.).Plants (Basel). 2024 May 16;13(10):1385. doi: 10.3390/plants13101385. Plants (Basel). 2024. PMID: 38794455 Free PMC article.
-
Optimal pollinator attraction strategies in Trollius ranunculoides Hemsl. (Ranunculaceae) at different altitudes: increased floral display or promotion of nectar output?Plant Biol (Stuttg). 2011 May;13(3):551-5. doi: 10.1111/j.1438-8677.2010.00402.x. Epub 2010 Dec 22. Plant Biol (Stuttg). 2011. PMID: 21489108
-
Auxin regulated metabolic changes underlying sepal retention and development after pollination in spinach.BMC Plant Biol. 2021 Apr 6;21(1):166. doi: 10.1186/s12870-021-02944-4. BMC Plant Biol. 2021. PMID: 33823793 Free PMC article.
References
LinkOut - more resources
Full Text Sources