. 2024 Dec 20:17:11375-11402.
doi: 10.2147/JIR.S474211. eCollection 2024.

Single-Cell Transcriptome Reveals the Heterogeneity of T Cells in Mice with Systemic Lupus Erythematosus and Neuronal Inflammation

Affiliations

Single-Cell Transcriptome Reveals the Heterogeneity of T Cells in Mice with Systemic Lupus Erythematosus and Neuronal Inflammation

Zhijie Shi et al. J Inflamm Res. .

Abstract

Introduction: Systemic lupus erythematosus is a heterogeneous autoimmune disease. A burst of autoimmune reactions in various systems can lead to severe clinical conditions closely associated with mortality. T cells serve as mediators that drive the occurrence and maintenance of inflammatory processes.

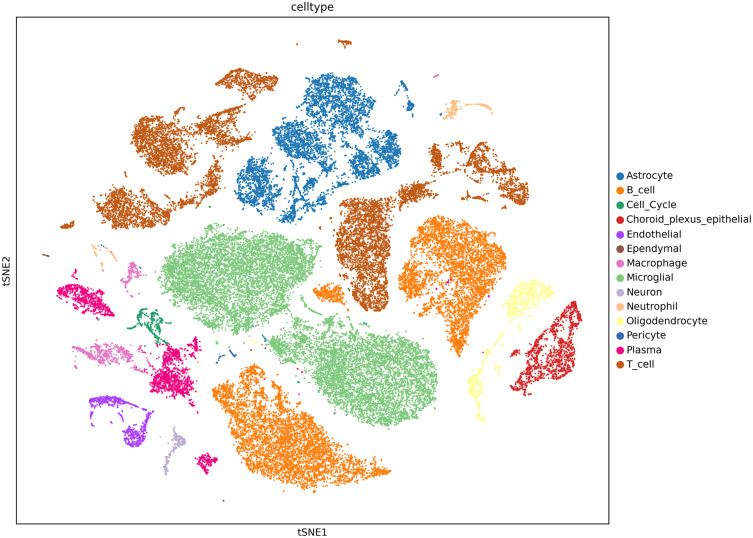
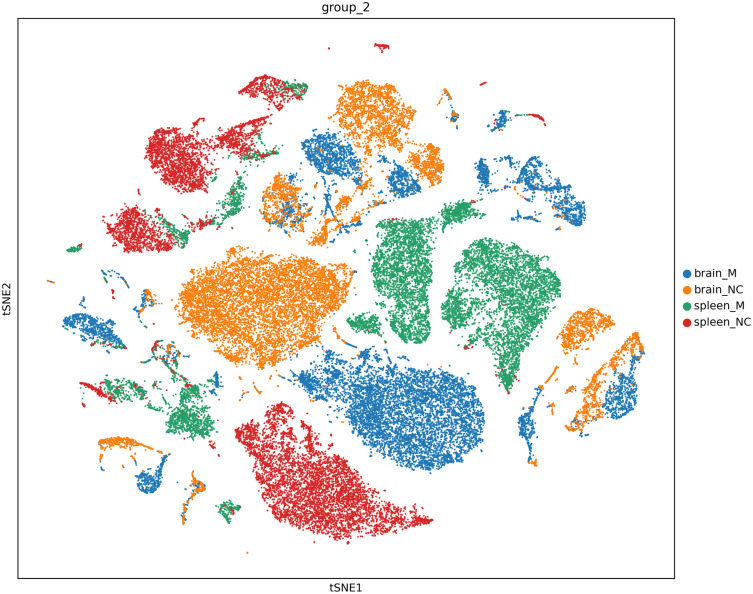
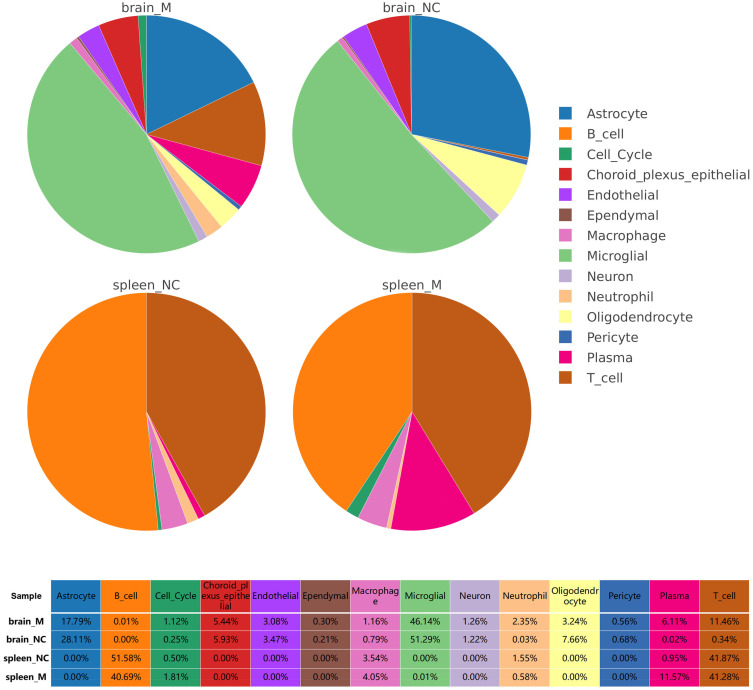
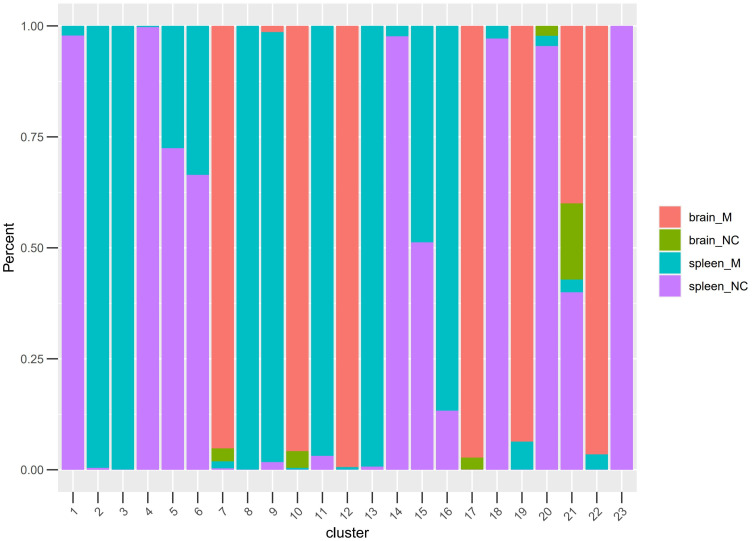
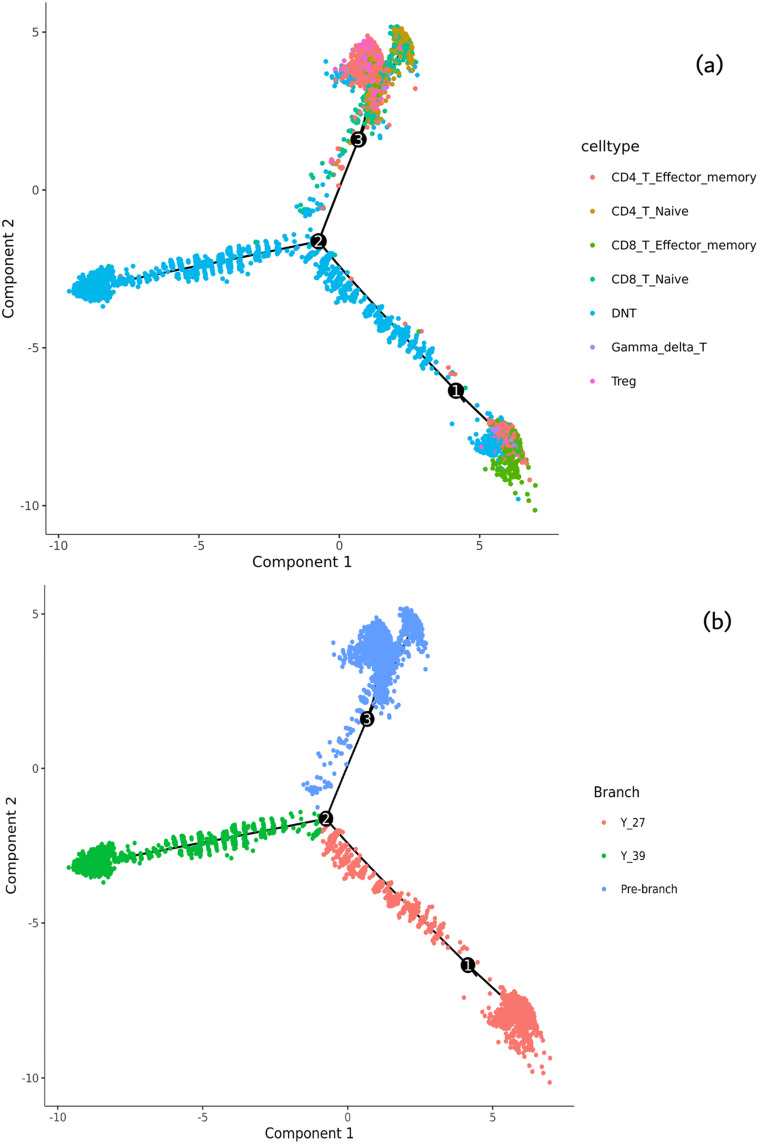
Methods: In this work, we employed single-cell transcriptome sequencing (scRNA-seq) involving 27704 cells from the brain and spleen tissues of MRL/lpr mice and 25355 healthy controls from BALB/c mice to explore the heterogeneity of T cells and their migration from the spleen to the brain.

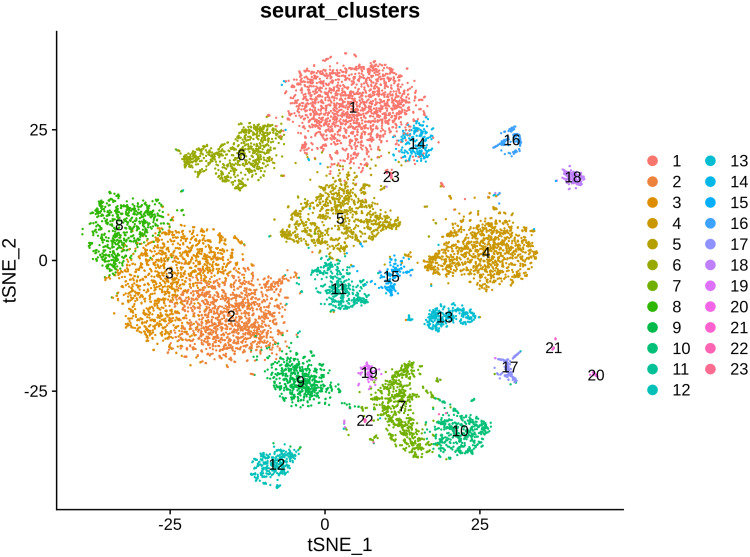
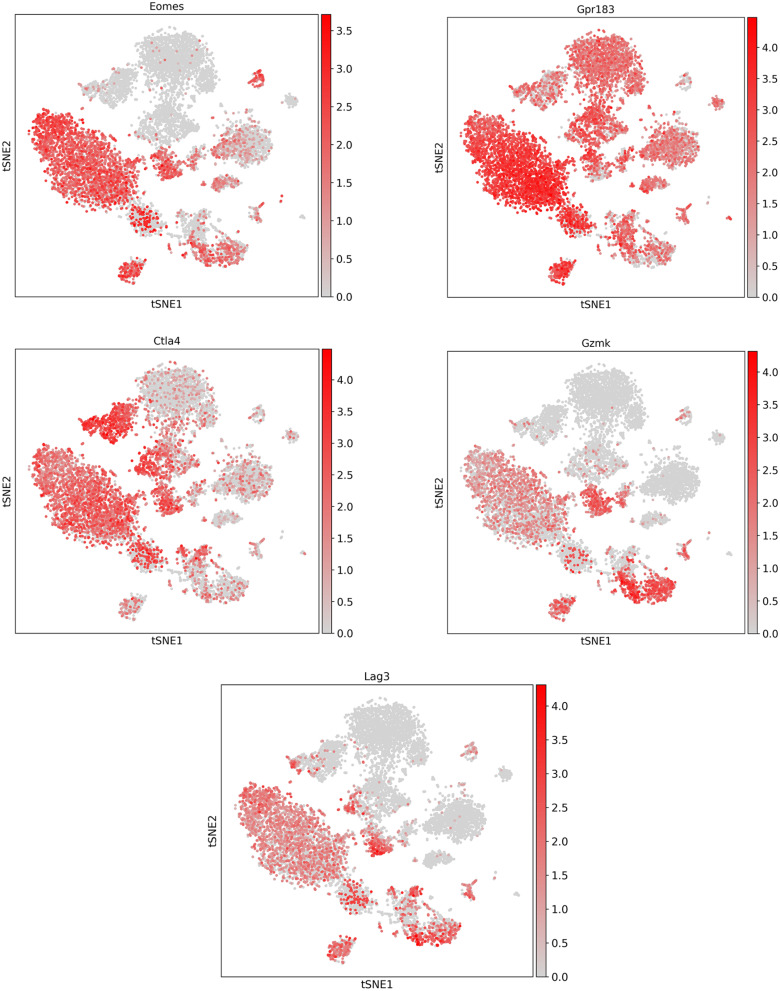
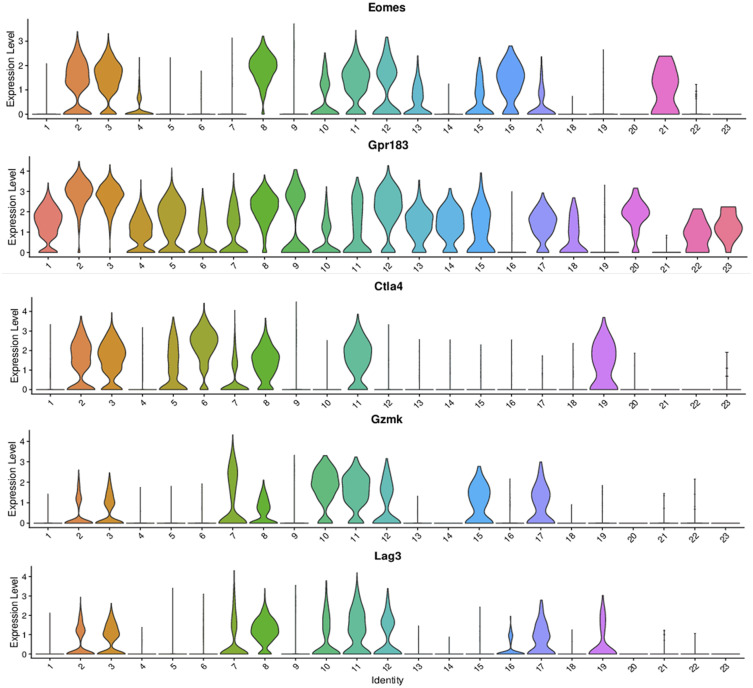
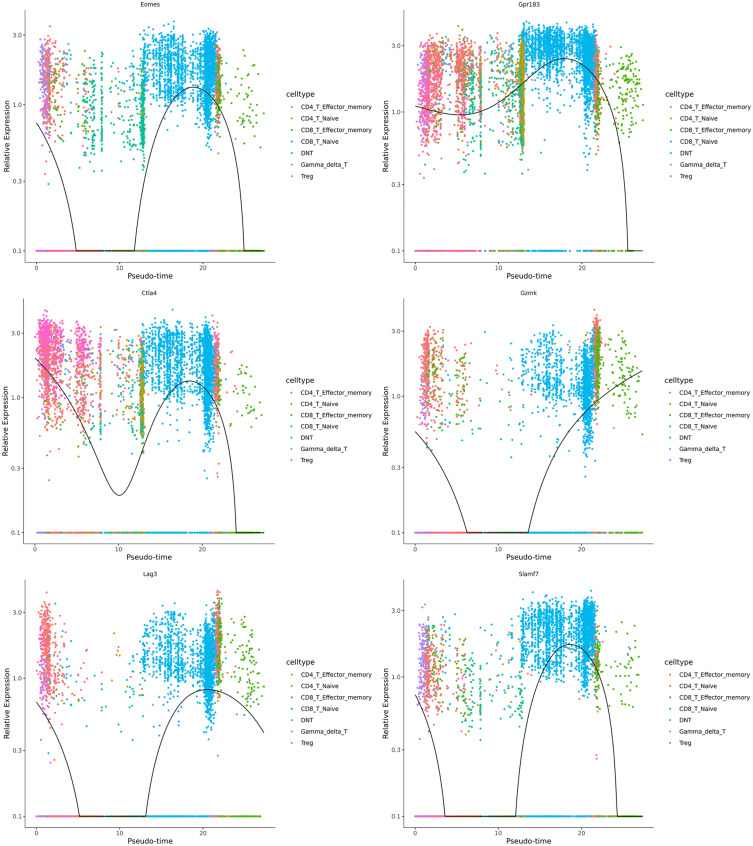
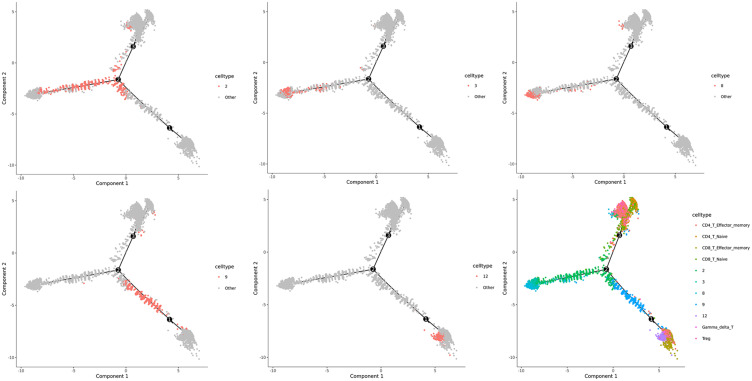
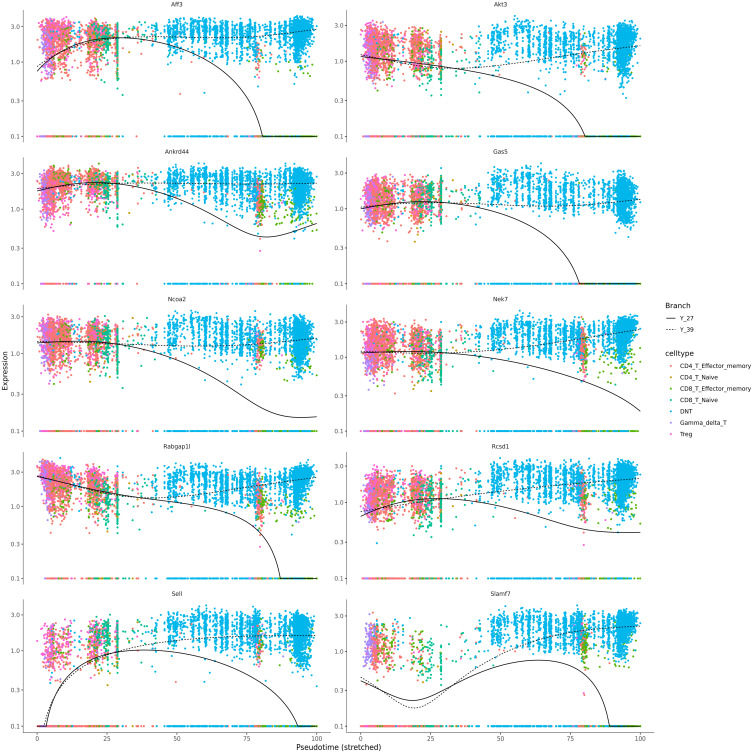
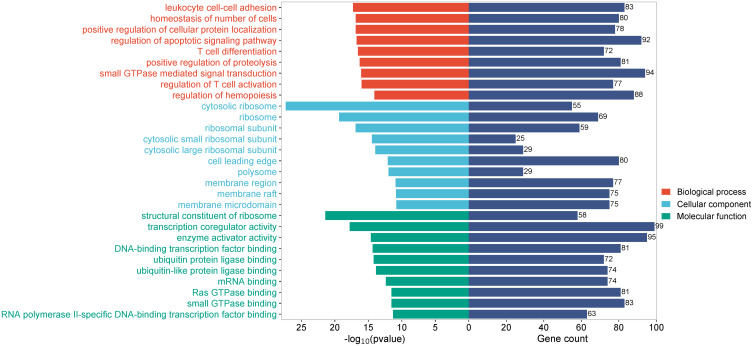
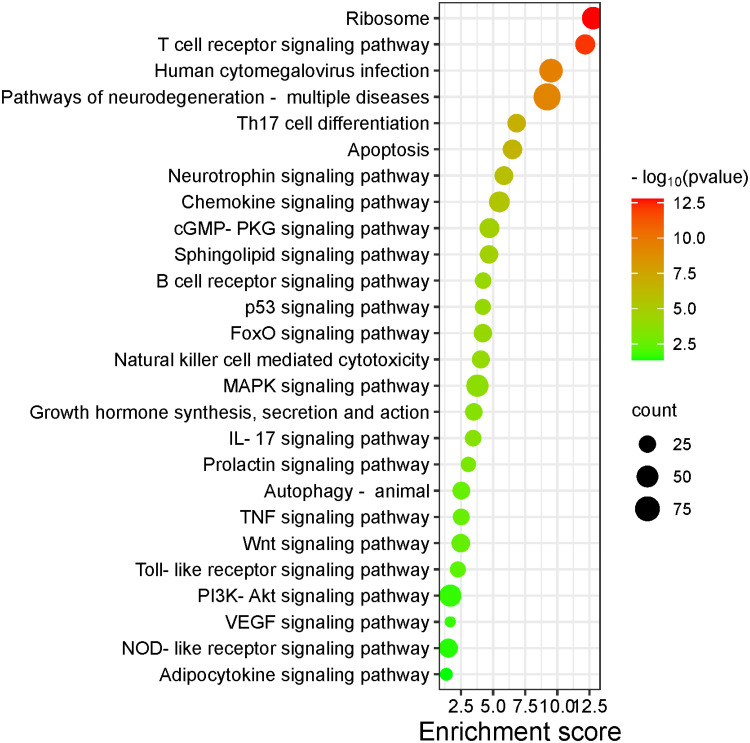
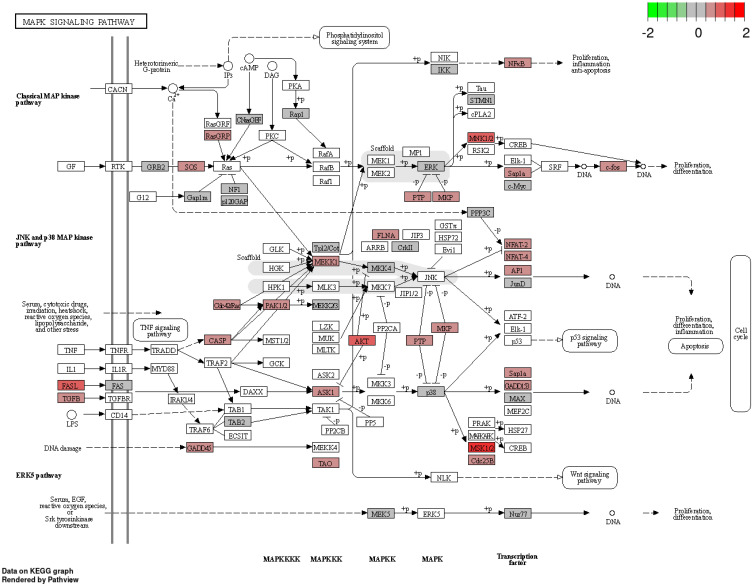
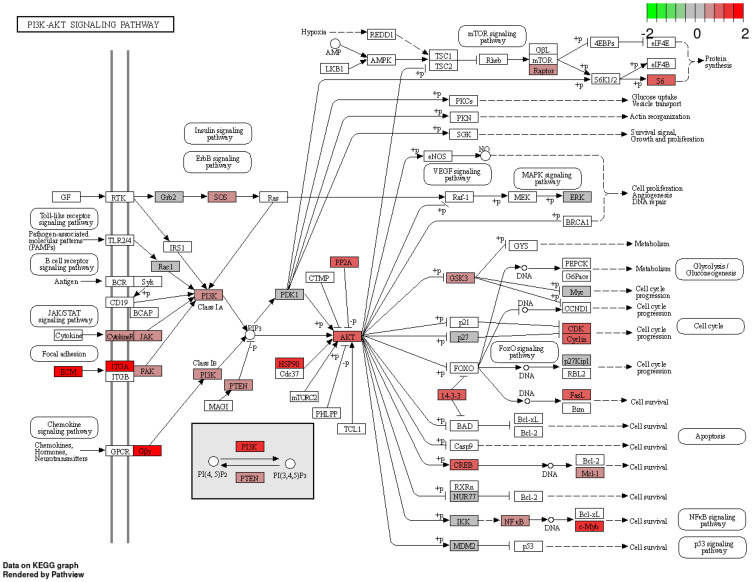
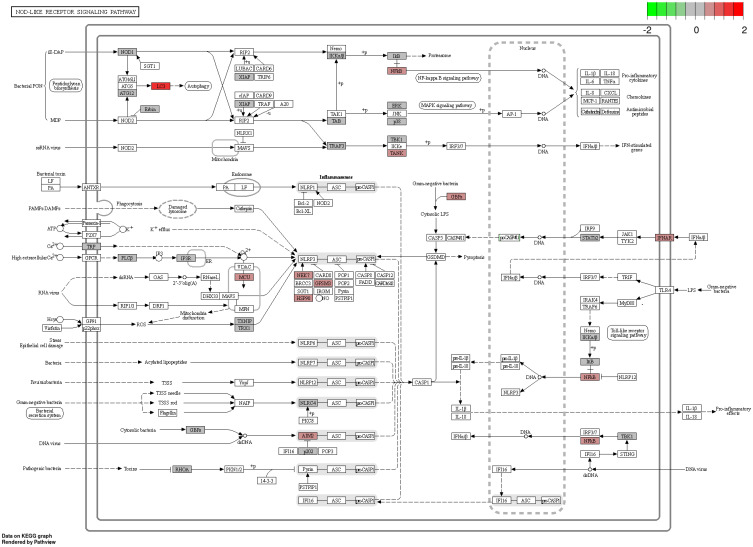
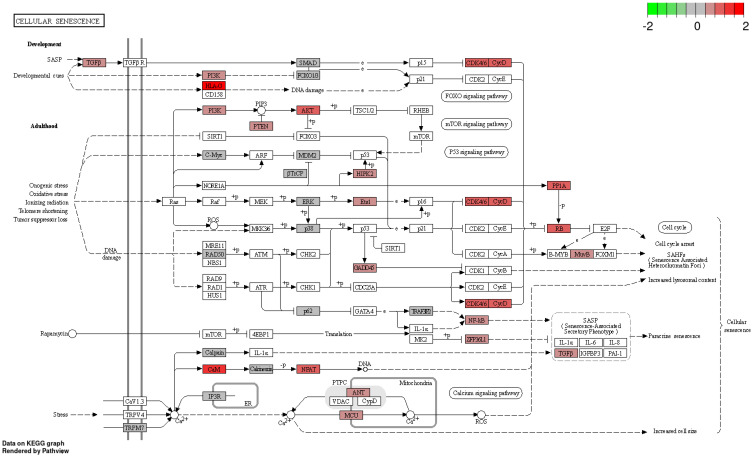
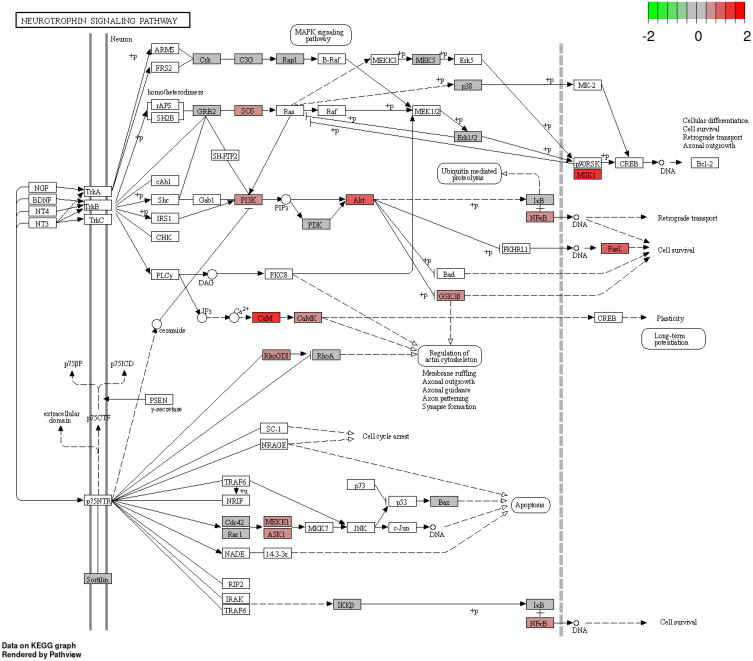
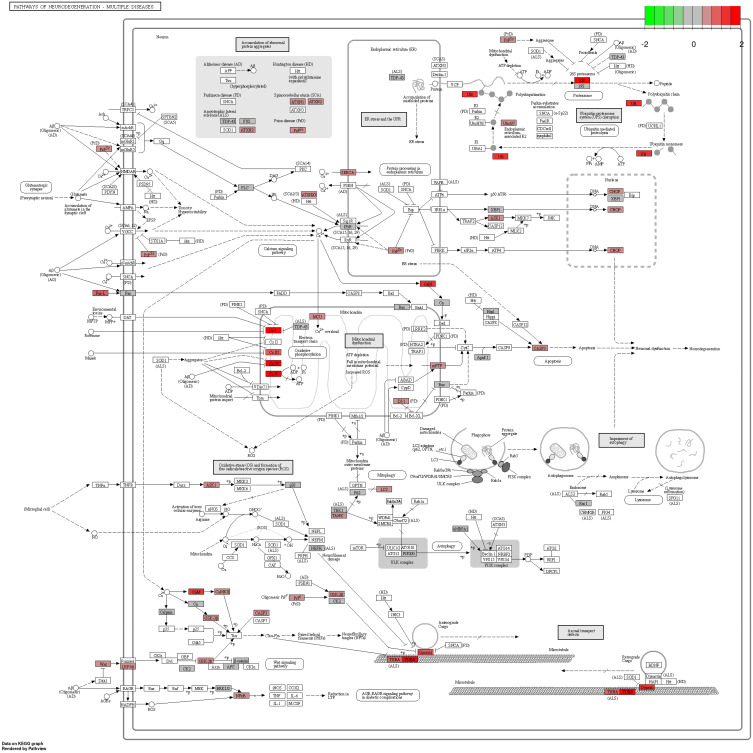
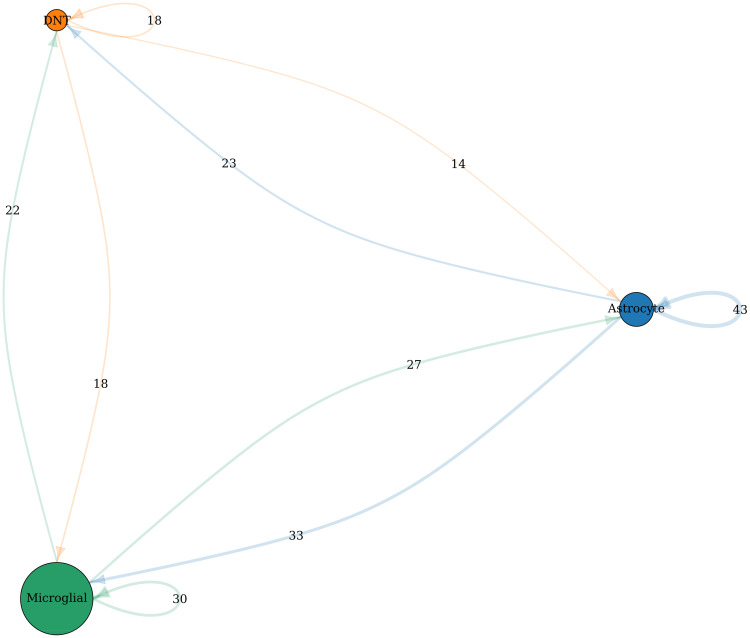
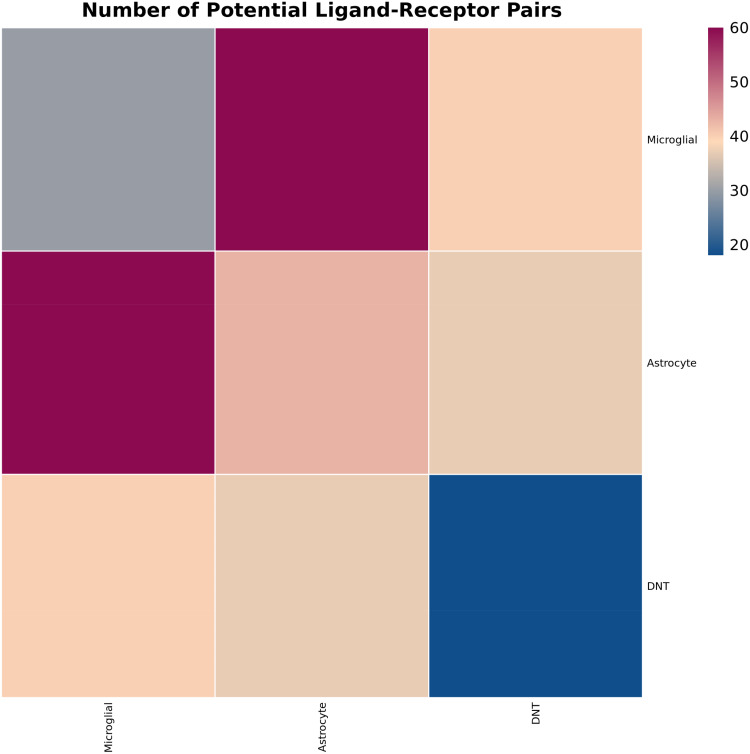
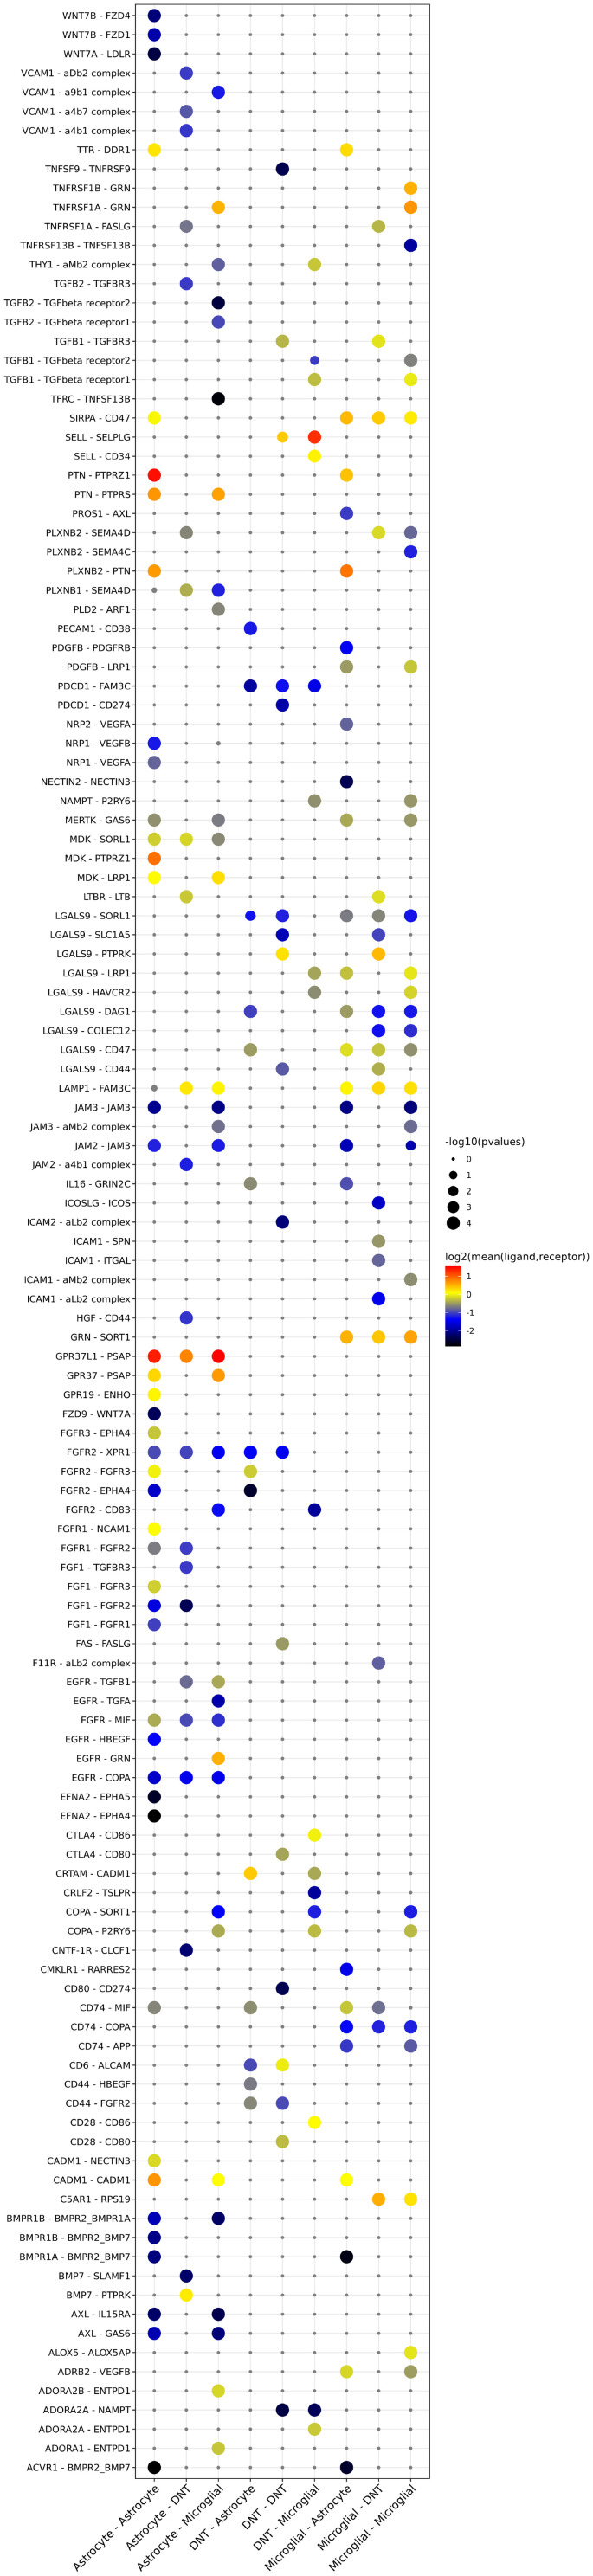
Results: We identified a distinct group of double-negative T cells in systemic lupus erythematosus (SLE) mice that significantly expressed Eomes and other specific markers. We used the analysis of pseudotime trajectory and enrichment to show that double-negative T cells in SLE mice are strongly associated with cellular senescence and exhaustion. Additionally, we focused on the interactions among DNT, astrocytes, and microglia in the mice brain. We observed greater expression of MDK-related ligand‒receptor pairs between astrocytes and double-negative T cells, indicating that MDK may be a therapeutic target for treating neuroinflammation in SLE.

Discussion: This research sheds light on the intricate dynamics of immune responses in mice with SLE, specifically highlighting the role of double-negative T cells and their connection to cellular senescence. The exploration of interactions between T cells, astrocytes, and microglia in the mice brain unveils potential avenues for therapeutic intervention, particularly in addressing neuronal inflammation in SLE.

Keywords: SLE; T cell; neuroinflammation; single-cell transcriptome.


Conflict of interest statement

The authors declare no conflict of interest.

Figures

Figure 1
Figure 1
T-SNE plot of clustering all cells from the spleen and brain samples. Each colour represents a certain cluster of the corresponding cell type labelled on the right.
Figure 2
Figure 2
The tSNE plot of clustering all cells from the spleen and brain samples. Each colour represents a certain cluster of sample resources labelled on the right. M for the MPL/lpr group, NC for the control group.
Figure 3
Figure 3
Pie plot of the differential cell composition of six samples. The percentage of the proportion is marked in the corresponding part, while each colour represents a certain cell type.
Figure 4
Figure 4
T-SNE plot of the T-cell subclusters. Each colour represents a certain cluster identified by specific marker genes.
Figure 5
Figure 5
Percentage of the original identity in each subcluster.
Figure 6
Figure 6
Heatmap of the top 10 markers of T cells in 23 subclusters.
Figure 7
Figure 7
(a) t-SNE plot of cell types in T-cell subclusters. C2, C3, C8, C9, and C12 are five subclusters that are not categorized as any common type of T cell. (bf). The expression levels of CD3d, CD3e, CD3g, CD4 and CD8 in “unknown” T cells.
Figure 8
Figure 8
Heatmap of the cluster’s top 20 expressed marker genes in T cell subclusters C2, C3, C8, C9, and C12.
Figure 9
Figure 9
T-SNE plot of the expression levels of the biomarkers Eomes, Gpr183, Ctla4, Gzmk, and Lag3 in DNT cells.
Figure 10
Figure 10
Violin plot of the expression levels of the biomarkers Eomes, Gpr183, Ctla4, Gzmk, and Lag3 in DNT cells.
Figure 11
Figure 11
Results of the pseudotime trajectory analysis. Each dot represents a single cell. The black lines indicate the main differentiation trajectories of the cells, and the black circles with numbers are the important nodes on the differentiation trajectories. (a) Each colour represents a certain type of T cell. (b) Each colour represents a certain branch of the trajectory.
Figure 12
Figure 12
The expression levels of Eomes, Gpr183, Ctla4, Gzmk, and Slamf7 according to pseudotime analysis. Each dot represents a single cell. The colour of the dot indicates the cell type, the abscissa is the pseudotime, the ordinate is the expression level of the specified gene in the cell, and the black curve indicates the trend of the gene between different cells with pseudotime.
Figure 13
Figure 13
Results of the pseudotime trajectory analysis of DNT in both the spleen and brain. Each dot represents a single cell. The colour of the dot represents the different subclusters or cell types. The black lines indicate the main differentiation trajectories of the cells, and the black circles with numbers are the important nodes on the differentiation trajectories.
Figure 14
Figure 14
The expression levels of genes according to pseudotime on different branches. Each dot represents a cell, the colour of the dot represents the pseudotime, the abscissa is the pseudotime, the ordinate is the expression level of the specified gene in the cell, and the solid and dashed lines in black represent the trend of the gene with pseudotime between cells in different branches.
Figure 15
Figure 15
The histogram of GO of DNT.
Figure 16
Figure 16
Bubble plot of the DNT KEGG database.
Figure 17
Figure 17
The MAPK signalling pathway KEGG plot of pathways associated with DNT.
Figure 18
Figure 18
The PI3K-Akt signalling pathway KEGG plot of pathways associated with DNT.
Figure 19
Figure 19
The NOD-like receptor signalling pathway KEGG plot of pathways associated with DNT.
Figure 20
Figure 20
The Cellular senescence KEGG plot of pathways associated with DNT.
Figure 21
Figure 21
Neurotrophin signalling pathway KEGG plot of pathways associated with DNT.
Figure 22
Figure 22
Pathways associated with multiple neurodegenerative diseases.
Figure 23
Figure 23
Cell communication network among DNTs, microglia and astrocytes in the brain. The different coloured circles represent different cell populations, the size of the circles is proportional to the number of cells in the cell population, the thickness of the connection represents the number of significant interactions between cells, and the number above represents the specific value. The thicker the connection line is, the stronger the communication. The connecting line arrow points from the signalling cell to the signalling cell, and the colour matches the type of cell from which the signal is emitted.
Figure 24
Figure 24
Heatmap of cell communication. The horizontal and vertical axes represent the cell type, and the colours correspond to the number of interactions, which gradually increases as the colour patch changes from dark blue to light blue to dark violet.
Figure 25
Figure 25
Dot plot of cell communication. The horizontal axis represents the two cell types involved in communication. The left side of the en-dash represents the cell type of the ligands, and the right side represents the cell type of the receptors. The vertical axis represents cell signalling. The size of the circle represents the P value after -log10 transformation, so the larger the circle is, the greater the confidence there is in this interaction. The colour represents the average expression of the ligands and the receptors.

Similar articles

References

    1. Dorner T, Furie R. Novel paradigms in systemic lupus erythematosus. Lancet. 2019;393(10188):2344–2358. [Published Online First: 20190606]. doi:10.1016/S0140-6736(19)30546-X - DOI - PubMed
    1. Schwartz N, Stock AD, Putterman C. Neuropsychiatric lupus: new mechanistic insights and future treatment directions. Nat Rev Rheumatol. 2019;15(3):137–152. doi:10.1038/s41584-018-0156-8 - DOI - PMC - PubMed
    1. Sharabi A, Tsokos GC. T cell metabolism: new insights in systemic lupus erythematosus pathogenesis and therapy. Nat Rev Rheumatol. 2020;16(2):100–112. doi:10.1038/s41584-019-0356-x - DOI - PubMed
    1. Li H, Boulougoura A, Endo Y, Tsokos GC. Abnormalities of T cells in systemic lupus erythematosus: new insights in pathogenesis and therapeutic strategies. J Autoimmun. 2022;132(102870):102870. [Published Online First: 20220722]. doi:10.1016/j.jaut.2022.102870 - DOI - PubMed
    1. Guo C, Liu Q, Zong D, et al. Single-cell transcriptome profiling and chromatin accessibility reveal an exhausted regulatory CD4+ T cell subset in systemic lupus erythematosus. Cell Rep. 2022;41(6):111606. doi:10.1016/j.celrep.2022.111606 - DOI - PubMed

LinkOut - more resources