. 2025 Feb;12(8):e2412244.
doi: 10.1002/advs.202412244. Epub 2024 Dec 30.

Combined Blockade of Lipid Uptake and Synthesis by CD36 Inhibitor and SCD1 siRNA Is Beneficial for the Treatment of Refractory Prostate Cancer

Affiliations

Combined Blockade of Lipid Uptake and Synthesis by CD36 Inhibitor and SCD1 siRNA Is Beneficial for the Treatment of Refractory Prostate Cancer

Jiyuan Chen et al. Adv Sci (Weinh). 2025 Feb.

Abstract

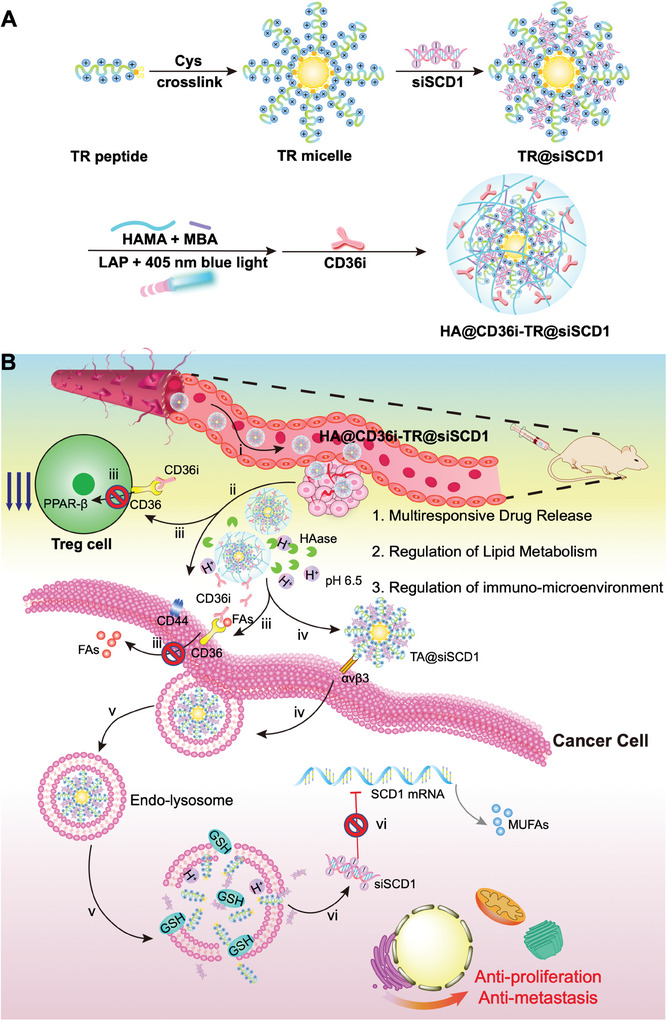
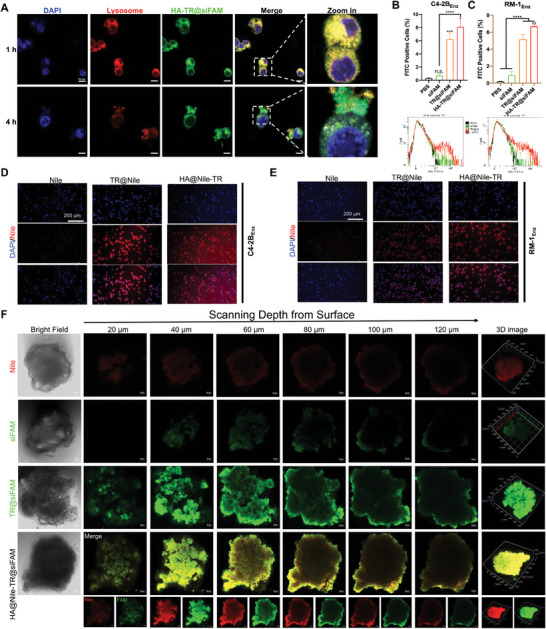
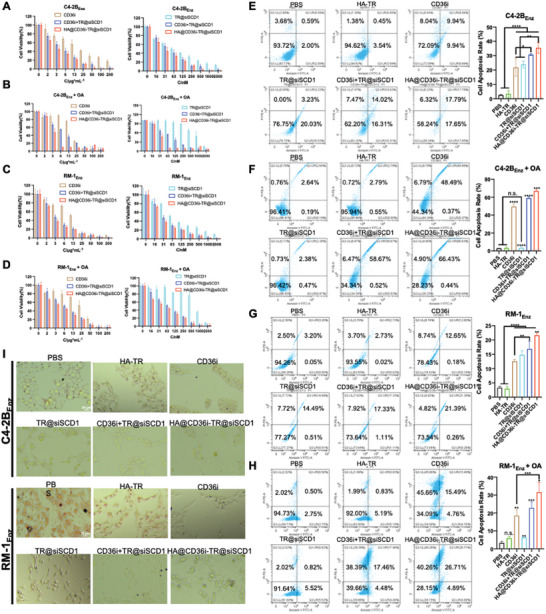
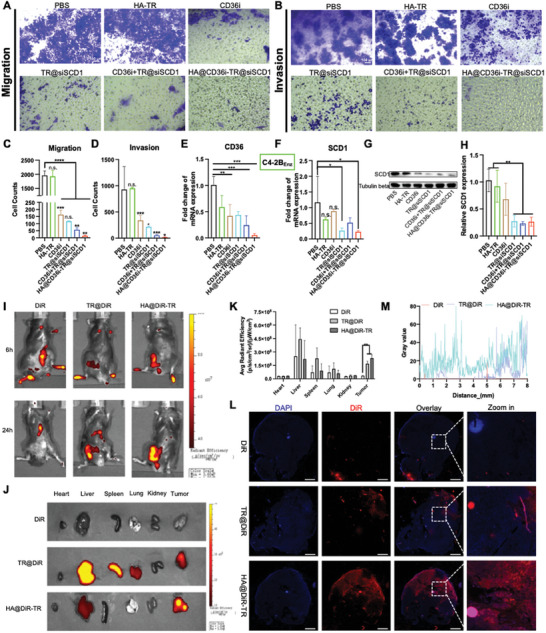
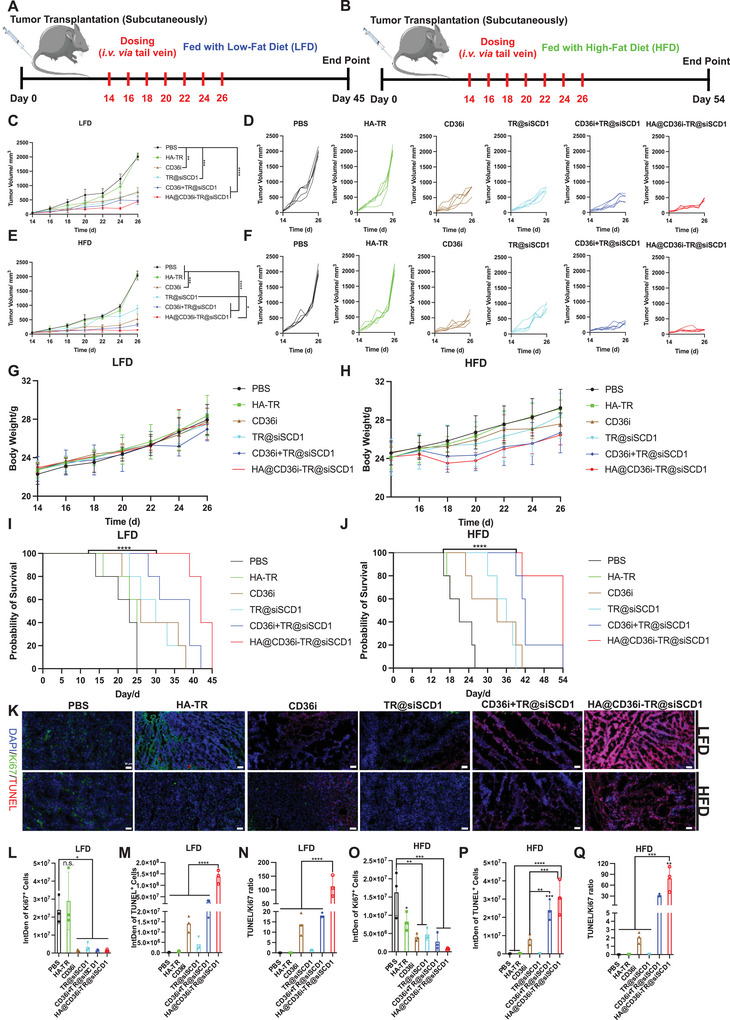
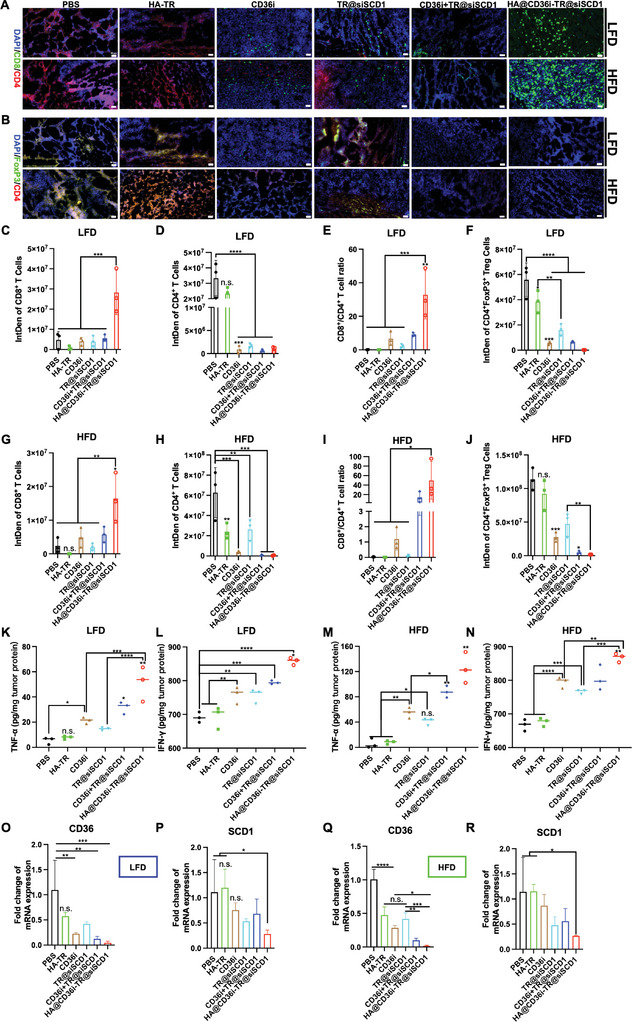
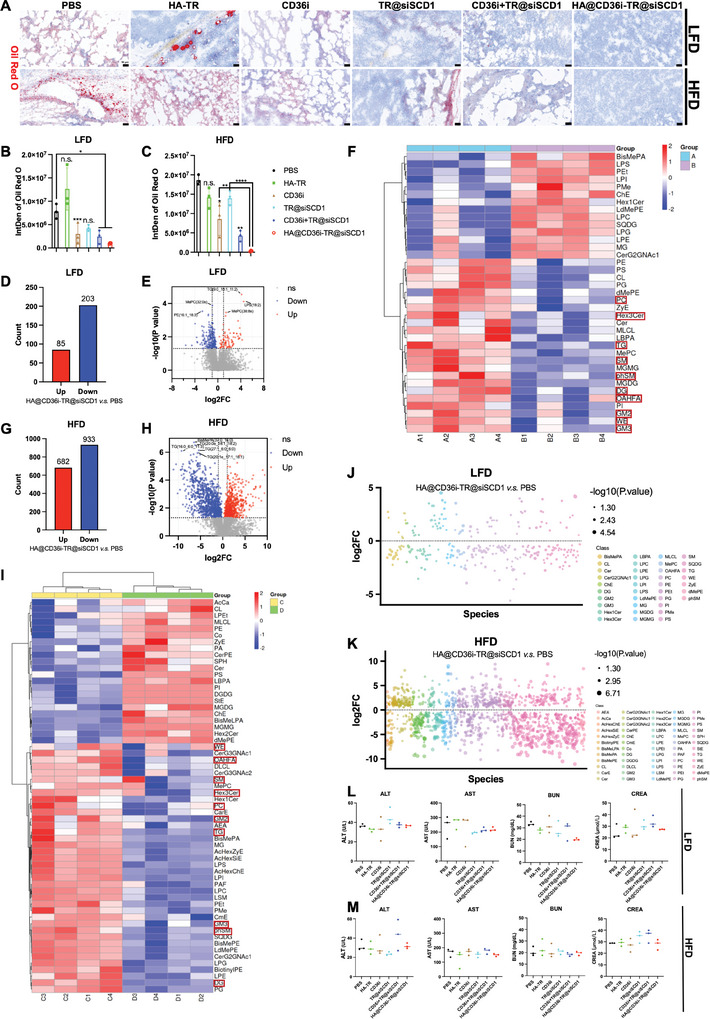
Drug resistance is an important factor for prostate cancer (PCa) to progress into refractory PCa, and abnormal lipid metabolism usually occurs in refractory PCa, which presents great challenges for PCa therapy. Here, a cluster of differentiation 36 (CD36) inhibitor sulfosuccinimidyl oleate sodium (CD36i) and stearoyl-CoA desaturase 1 (SCD1) siRNA (siSCD1) are selected to inhibit lipid uptake and synthesis in PCa, respectively. To this end, a multiresponsive drug delivery nanosystem, HA@CD36i-TR@siSCD1 is designed. The hyaluronic acid (HA) gel "shell" of HA-TR nanosystem can release drugs in response to the acidic tumor microenvironment and hyaluronidase, and the tumor targeting (TR) cationic micellar "core" can release drugs in response to glutathione. This multiresponsive drug release is beneficial for the exogenous inhibition of lipid uptake by CD36i and the endogenous inhibition of lipid synthesis by siSCD1. The established HA-TR nanosystem has good tumor targeting ability and tumor penetration ability, and that HA@CD36i-TR@siSCD1 has good synergistic effects, which can significantly restrain the growth, invasion, and metastasis of PCa. Moreover, under high-fat conditions, the tumors are more sensitive to HA@CD36i-TR@siSCD1 treatment, almost no accumulation of lipid droplets is observed in HA@CD36i-TR@siSCD1-treated tumors, with enhanced antitumor immunity. Hence, this study provides a new treatment option for refractory PCa patients, especially those with a high-fat diet.

Keywords: CD36; SCD1; drug resistance; lipid metabolism; refractory prostate cancer.


Conflict of interest statement

The authors declare no conflict of interest.

Figures

Scheme 1
Scheme 1
Schematic illustration of the A) establishment and B) mechanism of HA@CD36i‐TR@siSCD1 nanosystem.
Figure 1
Figure 1
Characterization of TR micelles and HA‐TR nanoparticles. A) Transmission electron microscope (TEM) image of TR micelles (bar = 200 nm); B) Stability of TR micelles in PBS buffer (pH 7.4) at 4 °C for 30 days (n = 3, mean ± SD); C) CMC of TR micelles; D) TEM image of HA‐TR nanoparticles (bar = 50 nm); E) Stability of HA‐TR in PBS buffer (pH 7.4) at 4 °C for 30 days (n = 3, mean ± SD); F) The particle sizes and zeta potentials of TR micelles, HA‐TR and HA@CD36i‐TR@siSCD1 (n = 3, mean ± SD); G) EE% and DL% for siCy3 in HA@‐TR@siCy3 (n = 3, mean ± SD); H) Cumulative release curve of siCy3 (HA‐TR@siCy3) in PBS buffers (pH = 6.5 or 7.4) with or without DTT/HAase (n = 3, mean ± SD, two‐way ANOVA, **** p < 0.0001); I) Agarose gel electrophoresis with different N/P ratios TR@pEGFP; J) Agarose gel electrophoresis with different N/P ratios TR@pEGFP with 50 mM DTT; K,L) HEK‐293T cells were co‐incubated with different N/P ratios TR@pEGFP or HA‐TR@pEGFP for 24 h and witnessed under a fluorescence microscope, PEI@pEGFP was used as a positive control (bars = 100 µm, n = 3, mean ± SD, two‐way ANOVA, ** p < 0.01); M) Vector toxicity investigation, concentration range: 0–1200 µg mL−1 (n = 3, mean ± SD, one‐way ANOVA, *** p < 0.001).
Figure 2
Figure 2
Intracellular uptake and transport of HA‐TR, Nile, and siFAM were used as model drugs. A) Lysosomal escape experiment of HA‐TR@siFAM (bars = 10 µm); B,C) Cellular uptake of HA‐TR@siFAM by C4‐2BEnz or RM‐1Enz cells, analyzed by a flow cytometry (n = 3, mean ± SD, one‐way ANOVA, n.s.: no significance, ** p < 0.01, *** p < 0.001, **** p < 0.0001); D,E) Cellular uptake of HA‐TR@Nile by C4‐2BEnz or RM‐1Enz cells, analyzed by a fluorescence microscope (bars = 200 µm); F) Study on tumoroid penetration ability of HA@Nile‐TR@siFAM in C4‐2BEnz tumoroids (bars = 50 µm).
Figure 3
Figure 3
In vitro anti‐proliferation ability of HA@CD36i‐TR@siSCD1. A–D) The anti‐cell proliferation effect of HA@CD36i‐TR@siSCD1 was investigated by a CCK‐8 kit, co‐incubated with (A) C4‐2BEnz cells (B) C4‐2BEnz cells + 500 µM OA (C) RM‐1Enz cells (D) RM‐1Enz cells + 500 µM OA; E–H) The apoptosis effect of HA@CD36i‐TR@siSCD1 was investigated by an Annexin V‐FITC/PI Apoptosis kit, co‐incubated with (E) C4‐2BEnz cells (F) C4‐2BEnz cells + 500 µM OA (G) RM‐1Enz cells (H) RM‐1Enz cells + 500 µM OA (n = 3, mean ± SD, one‐way ANOVA, n.s.: no significance, * p < 0.05, ** p < 0.01, *** p < 0.001, **** p < 0.0001); I) C4‐2BEnz or RM‐1Enz cells were co‐incubated with 500 µM OA and treated with HA@CD36i‐TR@siSCD1 and other controls for 24 h and dyed with oil red O (bars = 20 µm).
Figure 4
Figure 4
In vitro anti‐invasion and metastasis as well as gene inhibition/knockout investigations, and in vivo distribution study. A) Anti‐metastasis test and C) statistical analysis (bars = 100 µm, n = 3, mean ± SD, multiple t test, n.s.: no significance, ** p < 0.01, *** p < 0.001, **** p < 0.0001); B) Anti‐invasion test and D) statistical analysis (bars = 100 µm, n = 3, mean ± SD, multiple t test, n.s.: no significance, * p < 0.015, *** p < 0.001); E,F) RT‐qPCR analysis of (E) CD36 and (F) SCD1 mRNA levels in C4‐2BEnz cells (n = 3, mean ± SD, one‐way ANOVA, n.s.: no significance, * p < 0.05, ** p < 0.01, *** p < 0.001); G,H) Western blotting analysis of SCD1 protein expression in C4‐2BEnz cells (n = 3, mean ± SD, one‐way ANOVA, ** p < 0.01); I) In vivo fluorescence imaging of RM‐1Enz tumor‐bearing C57BL/6J mice after intravenous injection of DiR, TR@DiR, and HA@DiR‐TR; J) Ex vivo imaging of tumors and major organs and K) statistical analysis (n = 3, mean ± SD, multiple t test, ** p < 0.01); L) Tumor penetration study (bars = 1 mm) and M) statistical analysis.
Figure 5
Figure 5
In vivo pharmacodynamics study of HA@CD36i‐TR@siSCD1. A,B) Schematic depicts the procedure of (A) LFD‐fed and (B) HFD‐fed RM‐1Enz bearing C57BL/6J mouse model; C–F) Tumor volume curves of each group in (C,D) LFD‐fed model and (E, F) HFD‐fed model(n = 5, mean ± SD, one‐way ANOVA, * p < 0.05, ** p < 0.01, *** p < 0.001, **** p < 0.0001); G,H) Body weight curves of each group in (G) LFD‐fed model and (H) HFD‐fed model (n = 5, mean ± SD); I,J) Survival curves of each group in (G) LFD‐fed model and (H) HFD‐fed model(n = 5, log‐rank analysis, **** p < 0.0001); K) Typical immunofluorescence images of Ki67+ and TUNEL+ cells in each group in LFD‐fed and HFD‐fed models (bars = 50 µm); L–Q) Statistical analysis of Ki67+ cell signals, TUNEL+ cell signals and TUNEL/Ki67 ratios of each group in (L‐N) LFD‐fed and (O‐Q) HFD‐fed models (n = 3, mean ± SD, one‐way ANOVA, n.s.: no significance, * p < 0.05, ** p < 0.01, *** p < 0.001, **** p < 0.0001).
Figure 6
Figure 6
In vivo mechanism study. A,B) Typical immunofluorescence images of (A) CD8+ T cells and CD4+ T cells and (B) CD4+FoxP3+ Treg cells in each group in LFD‐fed and HFD‐fed models (bars = 50 µm); C–J) Statistical analysis of CD8+ T cell signals, CD4+ T cell signals, CD8+/CD4+ T cell ratios and CD4+FoxP3+ Treg cell signals of each group in (C‐F) LFD‐fed and (G‐J) HFD‐fed models (n = 3, mean ± SD, one‐way ANOVA, n.s.: no significance, * p < 0.05, ** p < 0.01, *** p < 0.001, **** p < 0.0001); K–N) Intratumor TNF‐α and IFN‐γ levels of each group in (K, L) LFD‐fed and (M, N) HFD‐fed models (n = 3, mean ± SD, one‐way ANOVA, n.s.: no significance, * p < 0.05, ** p < 0.01, *** p < 0.001, **** p < 0.0001); O–R) Intratumoral CD36 and SCD1 mRNA levels of each group in (O, P) LFD‐fed and (Q, R) HFD‐fed models (n = 3, mean ± SD, one‐way ANOVA, n.s.: no significance, * p < 0.05, ** p < 0.01, *** p < 0.001, **** p < 0.0001).
Figure 7
Figure 7
In vivo lipid metabolism and safety study. A) Typical oil red O staining images of each group in LFD‐fed and HFD‐fed models and B,C) Statistical analysis (bars = 50 µm, n = 3, mean ± SD, one‐way ANOVA, n.s.: no significance, * p < 0.05, ** p < 0.01, *** p < 0.001, **** p < 0.0001); D–I) Statistic of differently expressed lipids, volcano plot data, and differential lipid classification heatmap in (D‐F) LFD‐fed model and (G‐I) HFD‐fed model, HA@CD36i‐TR@siSCD1 group versus PBS group (Group A: PBS group fed LFD, Group B: HA@CD36i‐TR@siSCD1 group fed LFD, Group C: PBS group fed HFD, Group D: HA@CD36i‐TR@siSCD1 group fed HFD, n = 4, p value < 0.05); J,K) Differential lipid bubble map in (J) LFD‐fed model and (K) HFD‐fed model, HA@CD36i‐TR@siSCD1 group versus PBS group (n = 4, p value < 0.05, values were expressed as log2 (FC)); L,M) Plasma ALT, AST, BUN and CREA levels of each group in (L) LFD‐fed model and (M) HFD‐fed model (n = 3).

Similar articles

Cited by

References

    1. Bray F., Laversanne M., Sung H., Ferlay J., Siegel R. L., Soerjomataram I., Jemal A., CA Cancer J. Clin. 2024, 74, 229. - PubMed
    1. Siegel R. L., Giaquinto A. N., Jemal A., CA Cancer J. Clin. 2024, 74, 12. - PubMed
    1. Khoshkar Y., Westerberg M., Adolfsson J., Bill‐Axelson A., Olsson H., Eklund M., Akre O., Garmo H., Aly M., BJUI Compass. 2021, 3, 173. - PMC - PubMed
    1. Maluf F. C., Pereira F. M. T., Silva A. G., Dettino A. L. A., Cardoso A. P. G., Sasse A. S., Soares A., Kann A. G., Herchenhorn D., Jardim D. L. F., Cortés D. E. L., Kater F. R., Morbeck I. A. P., Reolon J. F. N., Rinck J. A. J., Zarbá J. J., Sade J. P., da Trindade K. M., Costa L. A. G. A., Dos Santos L. V., Maia M. C., Siqueira M. B., Gillessen S., JCO Glob. Oncol. 2021, 7, 559. - PMC - PubMed
    1. Schaeffer E. M., Srinivas S., Adra N., An Y., Barocas D., Bitting R., Bryce A., Chapin B., Cheng H. H., D'Amico A. V., Desai N., Dorff T., Eastham J. A., Farrington T. A., Gao X., Gupta S., Guzzo T., Ippolito J. E., Kuettel M. R., Lang J. M., Lotan T., McKay R. R., Morgan T., Netto G., Pow‐Sang J. M., Reiter R., Roach M., Robin T., Rosenfeld S., Shabsigh A., et al., J. Natl. Compr. Canc. Netw. 2023, 21, 1067. - PubMed

MeSH terms

LinkOut - more resources