. 2025 Feb:92:102088.
doi: 10.1016/j.molmet.2024.102088. Epub 2024 Dec 28.

Enhanced dynorphin expression and secretion in pancreatic beta-cells under hyperglycemic conditions

Affiliations

Enhanced dynorphin expression and secretion in pancreatic beta-cells under hyperglycemic conditions

Miranda Movahed et al. Mol Metab. 2025 Feb.

Abstract

Objective: Dynorphin, an endogenous opioid peptide predominantly expressed in the central nervous system and involved in stress response, pain, and addiction, has intrigued researchers due to its expression in pancreatic β-cells. In this study, we aimed to characterize dynorphin expression in mouse and human islets and explore the mechanisms regulating its expression.

Methods: We used primary mouse and human islets with unbiased published datasets to examine how glucose and other nutrients regulate dynorphin expression and secretion in islets.

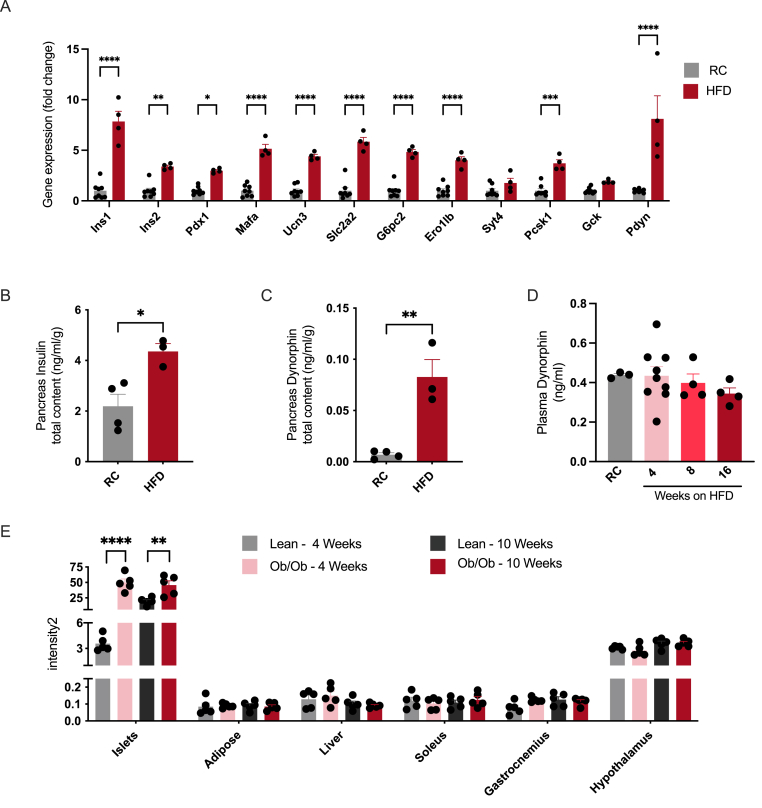
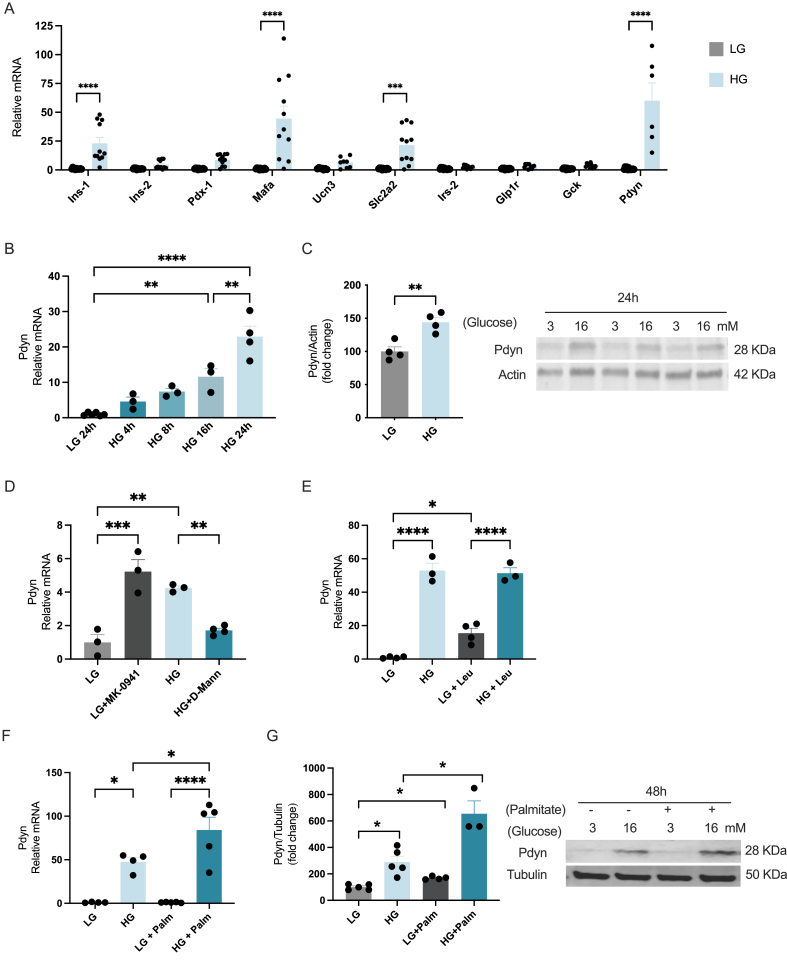
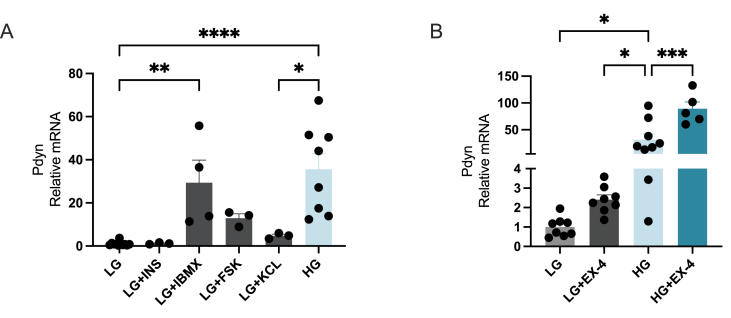
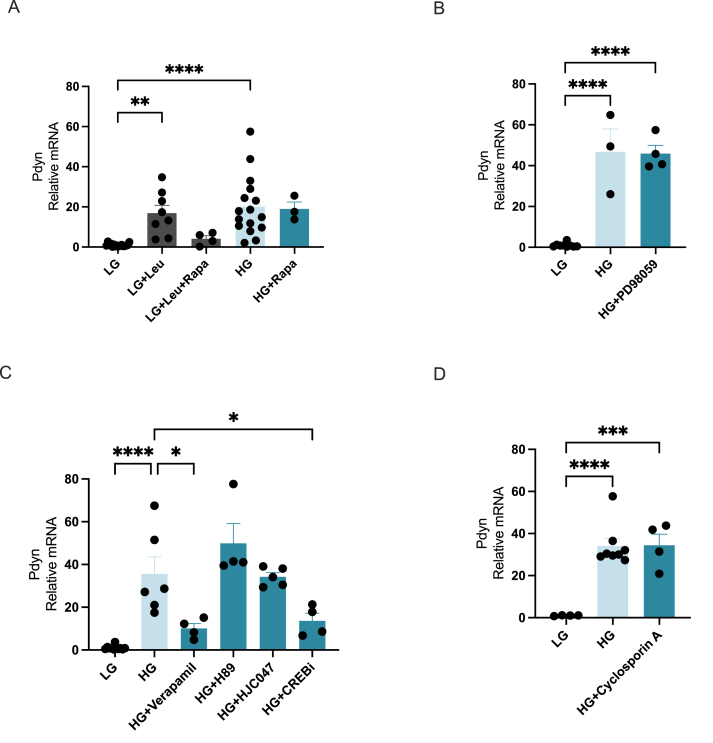
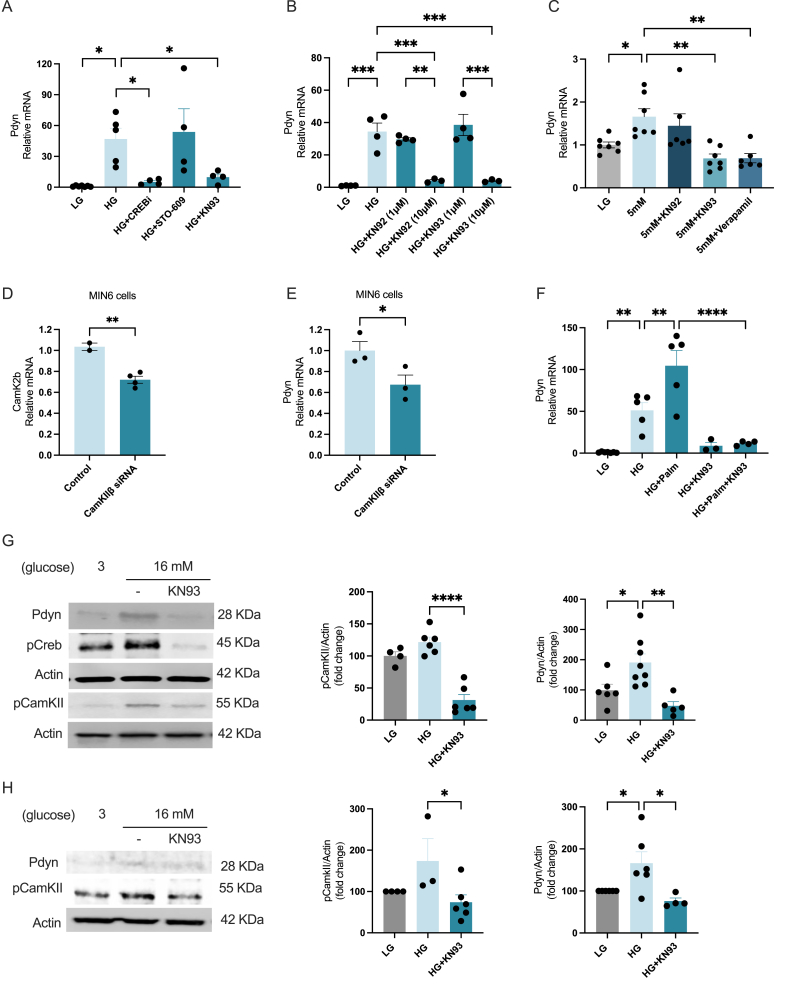
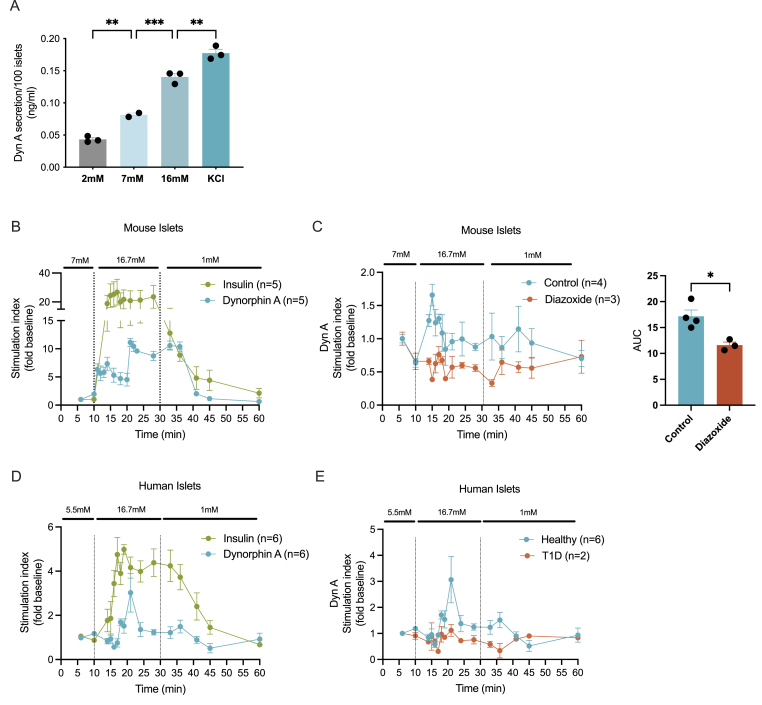
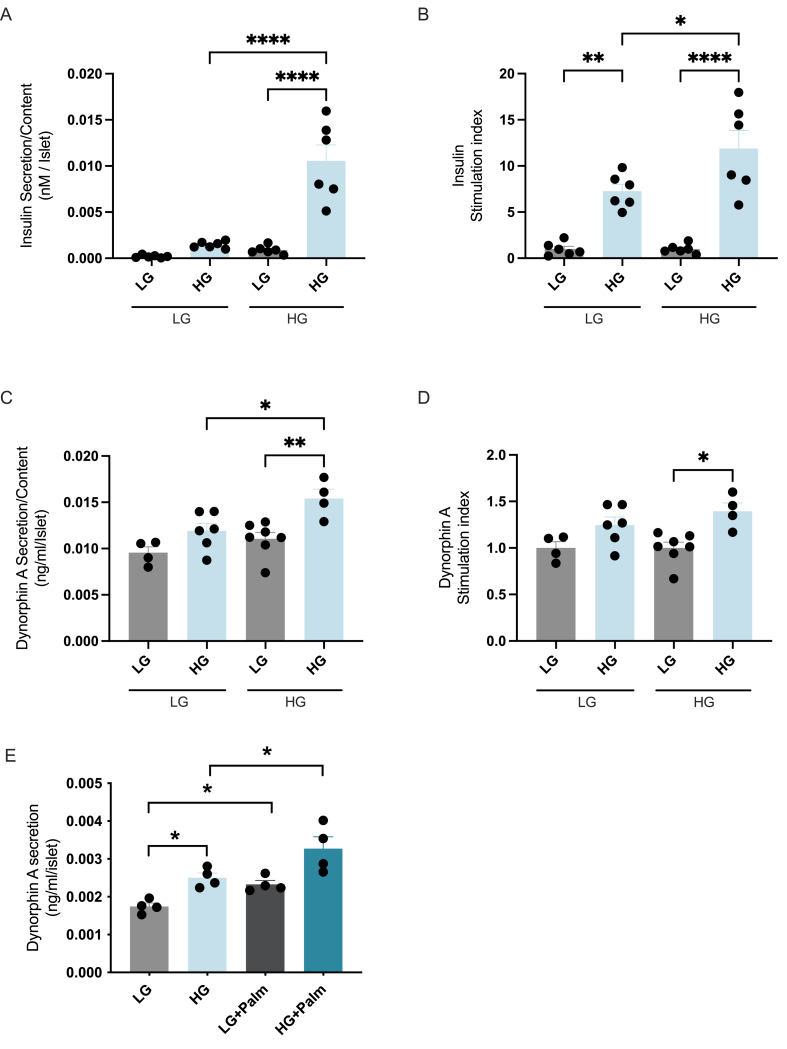
Results: The prodynorphin gene is significantly upregulated in β-cells under hyperglycemic conditions. In vitro studies revealed that increased glucose concentrations correlate with increased dynorphin expression, indicating a critical interplay involving Ca2+, CamKII, and CREB pathways in β-cells. Perifusion studies allowed us to measure the dynamic secretion of dynorphin in response to glucose from mouse and human islets for the first time. Furthermore, we confirmed that increased dynorphin content within the β-cells directly correlates with enhanced dynorphin secretion. Finally, our findings demonstrate a synergistic effect of palmitate in conjunction with high glucose, further amplifying dynorphin levels and secretion in pancreatic islets.

Conclusions: This study demonstrates that the opioid peptide prodynorphin is expressed in mouse and human β-cells. Prodynorphin levels are regulated in parallel with insulin in response to glucose, palmitate, and amino acids. Our findings elucidate the signaling pathways involved, with CamKII playing a key role in regulating prodynorphin levels in β-cells. Finally, our findings are the first to demonstrate active dynorphin secretion from mouse and human islets in response to glucose.

Keywords: Beta-cell; CamKII; Dynorphin; Islet.


Conflict of interest statement

Declaration of competing interest The authors declare the following financial interests/personal relationships which may be considered as potential competing interests: Manuel Blandino-Rosano reports financial support was provided by National Institute of Health (NIDDK). If there are other authors, they declare that they have no known competing financial interests or personal relationships that could have appeared to influence the work reported in this paper.

Figures

Figure 1
Figure 1
Pdyn levels are increased in diabetogenic conditions in mouse islets. (A) RNA-Seq datasets from RC- and HFD-fed mice (for 16 weeks) (n = 4) [33]. (B–C) Total pancreas insulin and Dyn A content detected by ELISA in RC- or HFD-fed mice for 16 weeks. (D) Plasma Dyn A levels measured by ELISA in plasma from RC- or HFD-fed mice for 4, 8 and 16 weeks. (E) Pdyn gene expression in six tissues (islet, adipose, liver, soleus, gastrocnemius and hypothalamus) as a function of genetic obesity (lean vs. OB/OB) and age (4 vs. 10 weeks) from the Diabetes Database from the Attie laboratory (http://diabetes.wisc.edu/) [34]. Data expressed as means ± s.e.m., ∗P < 0.05, ∗∗P < 0.01, ∗∗∗P < 0.001, ∗∗∗∗P < 0.0001.
Figure 2
Figure 2
High glucose, leucine and palmitate increases Pdyn levels in β-cells. (A) Expression of different genes mRNA level measured by RT-PCR in islets treated with low glucose (LG; 3 mM) or high glucose (HG; 16 mM) for 24 h. (B) Pdyn mRNA expression measured by RT-PCR in islets treated with LG or HG for 4, 8, 16 and 24 h. (C) Immunoblotting and quantification of Pdyn and Actin in mouse islets treated with HG for 24 h. (D) Pdyn expression at the mRNA level by RT-PCR in islets treated with LG, MK-0941 (10 μM) with LG, HG and d-Mannoheptulose (Mann; 10 μM) with HG for 6 h. Pdyn mRNA expression measured by RT-PCR in islets treated with (E) LG, HG, Leucine (Leu; 10 mM) with LG or HG; (F) palmitate (Palm; 0.4 mM) with LG or HG; (G) Immunoblotting and quantification of Pdyn and Tubulin in mouse treated with LG, HG and palmitate (0.4 mM) with LG or HG for 48 h. LG: grey bars and HG: blue bars. Data expressed as means ± s.e.m., ∗P < 0.05, ∗∗P < 0.01, ∗∗∗P < 0.001, ∗∗∗∗P < 0.0001. (For interpretation of the references to color in this figure legend, the reader is referred to the Web version of this article.)
Figure 3
Figure 3
cAMP and Ca2+ increase Pdyn levels in β-cells. Pdyn mRNA expression measured by RT-PCR in islets treated with (A) LG, Insulin (INS; 100 nM), IBMX (10 μM), Forskolin (FSK; 10 μM), KCl (30 mM) and HG, (B) LG, HG and Exendin-4 (Ex-4; 100 nM) with LG or HG for 24 h. LG: grey bars and HG: blue bars. Data expressed as means ± s.e.m., ∗P < 0.05, ∗∗P < 0.01, ∗∗∗P < 0.001, ∗∗∗∗P < 0.0001. (For interpretation of the references to color in this figure legend, the reader is referred to the Web version of this article.)
Figure 4
Figure 4
Inhibition of CREB decreases Pdyn levels. Pdyn mRNA expression measured by RT-PCR in islets treated with (A) LG, HG, and HG with Rapamycin (Rapa; 30 nM), LG with Leucine (Leu; 10 mM), and LG with Leu and Rapa, (B) LG and HG, and PD98059 (20 μM); (C) LG, HG, Verapamil (50 μM), H89 (10 μM), HJC047 (25 μM), and 666-15 (CREBi; 0.5 μM) with HG; (D) LG and HG, and Cyclosporin A (10 μM). LG: grey bars and HG: blue bars. Data expressed as means ± s.e.m., ∗P < 0.05, ∗∗P < 0.01, ∗∗∗P < 0.001, ∗∗∗∗P < 0.0001. (For interpretation of the references to color in this figure legend, the reader is referred to the Web version of this article.)
Figure 5
Figure 5
Inhibition of CamKII decreases Pdyn levels in mouse and human islets. Pdyn mRNA expression measured by RT-PCR in islets treated with (A) LG, HG, CREBi with HG, STO-609 (10 μM) with HG and KN93 (10 μM) with HG; (B) LG, HG, KN92 (1 and 10 μM) and KN93 (1 and 10 μM) with HG; (C) LG, 5 mM glucose, KN92 (10 μM) and KN93 (10 μM) and Verapamil (50 μM) with 5 mM glucose. (D–E) Camk2b and Pdyn expression at the mRNA level by RT-PCR in MIN6 cells transfected with Camk2b-siRNA for 72 h. (F) Pdyn expression at the mRNA level by RT-PCR in islets treated with LG, HG with or without palmitate (Palm; 0.4 mM) and KN93 with HG with or without palmitate for 24 h. Immunoblotting and quantification of pCreb, pCamKII, Pdyn and Actin in (G) mouse and (H) human islets treated with LG, HG and HG + KN93 for 24 h. LG: grey bars and HG: blue bars. Data expressed as means ± s.e.m., ∗P < 0.05, ∗∗P < 0.01, ∗∗∗P < 0.001, ∗∗∗∗P < 0.0001. (For interpretation of the references to color in this figure legend, the reader is referred to the Web version of this article.)
Figure 6
Figure 6
Dyn A is secreted in response to glucose and in a similar manner that insulin. (A) Dyn A secretion measured by ELISA of 100 mouse islets exposed to 2, 7, 16 mM of glucose and KCl for 1 h. LG: grey bars and HG: blue bars. Perifusion assays to measure (B) insulin and Dyn A secretion in response to glucose in islets from WT mice; (C) Dyn A secretion in islets from WT mice treated with or without diazoxide (200 μM), (D) insulin and Dyn A secretion in response to glucose in human islets from healthy donors; and (E) Dyn A secretion in response to glucose in human islets from healthy and T1D donors. Data expressed as means ± s.e.m., ∗P < 0.05, ∗∗P < 0.01, ∗∗∗P < 0.001. (For interpretation of the references to color in this figure legend, the reader is referred to the Web version of this article.)
Figure 7
Figure 7
High glucose and palmitate increase Dyn A secretion. (A–D) Insulin and Dynorphin A secretion and stimulation index (respect to LG) measured by ELISA of WT islets pre-incubated in LG and HG for 24 h following static incubation for 1 h. (E) Dynorphin A secretion measured by ELISA of WT islets exposed to LG, HG, and LG or HG with palmitate for 24 h. LG: grey bars and HG: blue bars. Data expressed as means ± s.e.m., ∗P < 0.05, ∗∗P < 0.01, ∗∗∗P < 0.001, ∗∗∗∗P < 0.0001. (For interpretation of the references to color in this figure legend, the reader is referred to the Web version of this article.)

Similar articles

References

    1. Schinner S., Scherbaum W.A., Bornstein S.R., Barthel A. Molecular mechanisms of insulin resistance. Diabet Med. 2005;22(6):674–682. - PubMed
    1. Bhattacharya S., Dey D., Roy S.S. Molecular mechanism of insulin resistance. J Biosci. 2007;32(2):405–413. - PubMed
    1. Wilcox G. Insulin and insulin resistance. Clin Biochem Rev. 2005;26(2):19–39. - PMC - PubMed
    1. American Diabetes, A. Economic costs of diabetes in the U.S. in 2012. Diabetes Care. 2013;36(4):1033–1046. - PMC - PubMed
    1. Prevention, C.f.D.C.a., About underlying cause of death 1999–2015. CDC WONDER database.