. 2024 Dec 30;30(1):283.
doi: 10.1186/s10020-024-01058-5.

Thioredoxin-interacting protein (TXNIP) inhibition promotes retinal ganglion cell survival and facilitates M1-like microglial transformation via the PI3K/Akt pathway in glaucoma

Affiliations

Thioredoxin-interacting protein (TXNIP) inhibition promotes retinal ganglion cell survival and facilitates M1-like microglial transformation via the PI3K/Akt pathway in glaucoma

Junjue Chen et al. Mol Med. .

Abstract

Background: Glaucoma is a group of heterogeneous neurodegenerative diseases with abnormal energy metabolism and imbalanced neuroinflammation in the retina. Thioredoxin-interacting protein (TXNIP) is involved in glucose and lipid metabolism, and associated with oxidative stress and inflammation, however, not known whether to be involved in glaucoma neuropathy and its underlying mechanisms.

Methods: To establish the chronic ocular hypertension (COH) mice model. Western blot, RT-PCR, immunofluorescence and F-VEP were used to detect neuroinflammation level, glial activation and RGCs survival in retina of wild type, TXNIP knockout and MCC950 treatment COH mice. Microglia high-pressure cultured model was constructed. Western blot, RT-PCR and immunofluorescence were used to investigate the proinflammatory cytokines secretion, glucose uptake and phenotype transformation in wild type, TXNIP knockout and overexpressed microglia combined with IL-17A treatment. Finally, we explored the possible underlying mechanisms using relevant pathway inhibitor interventions.

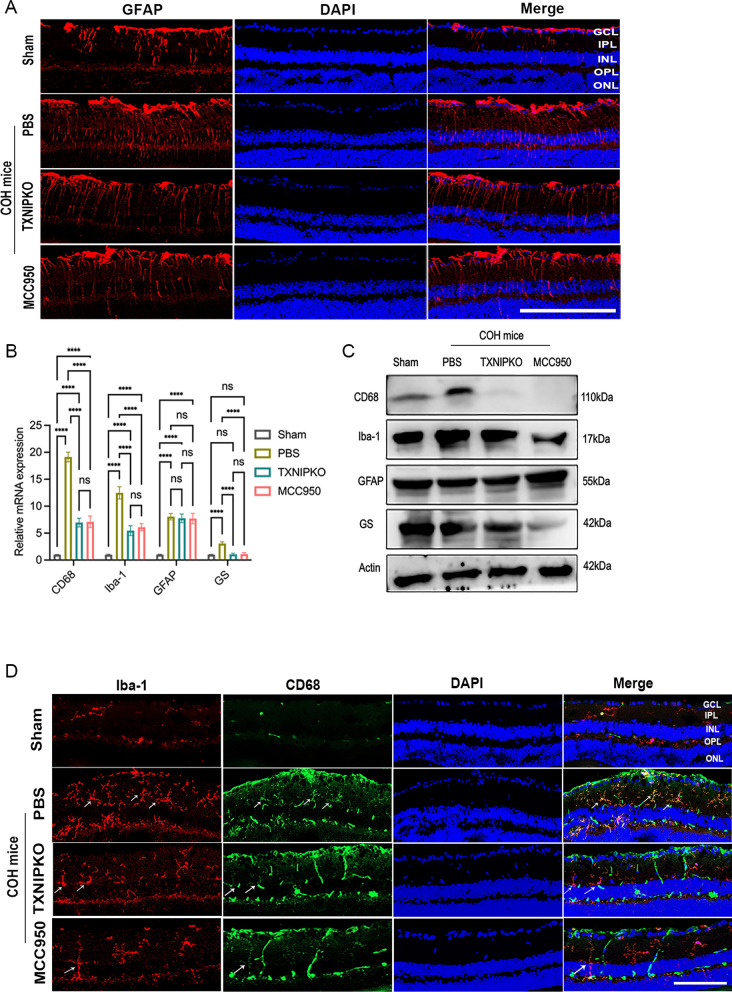
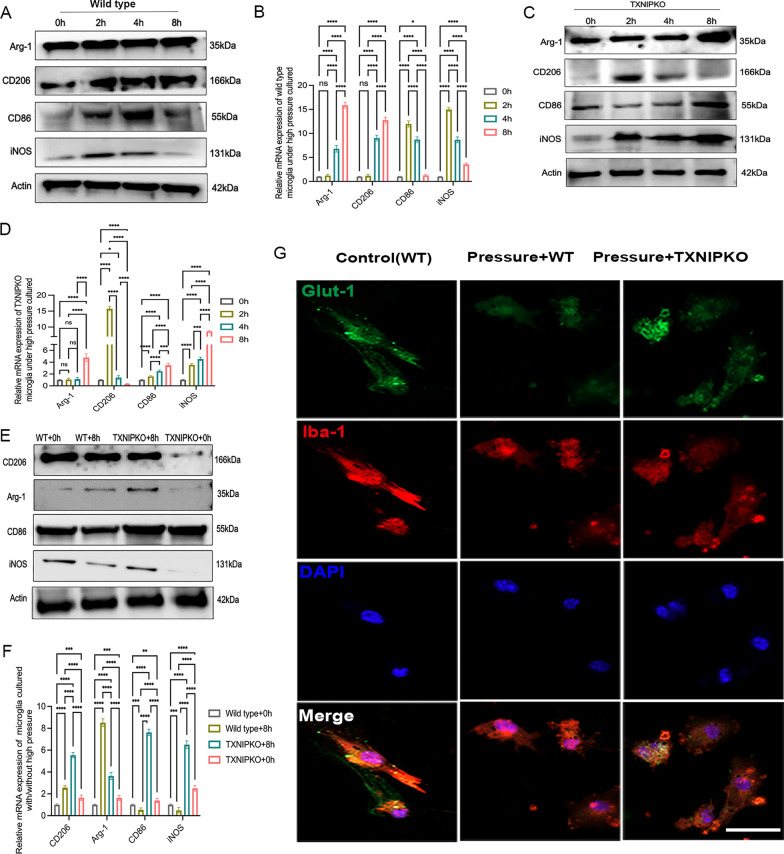
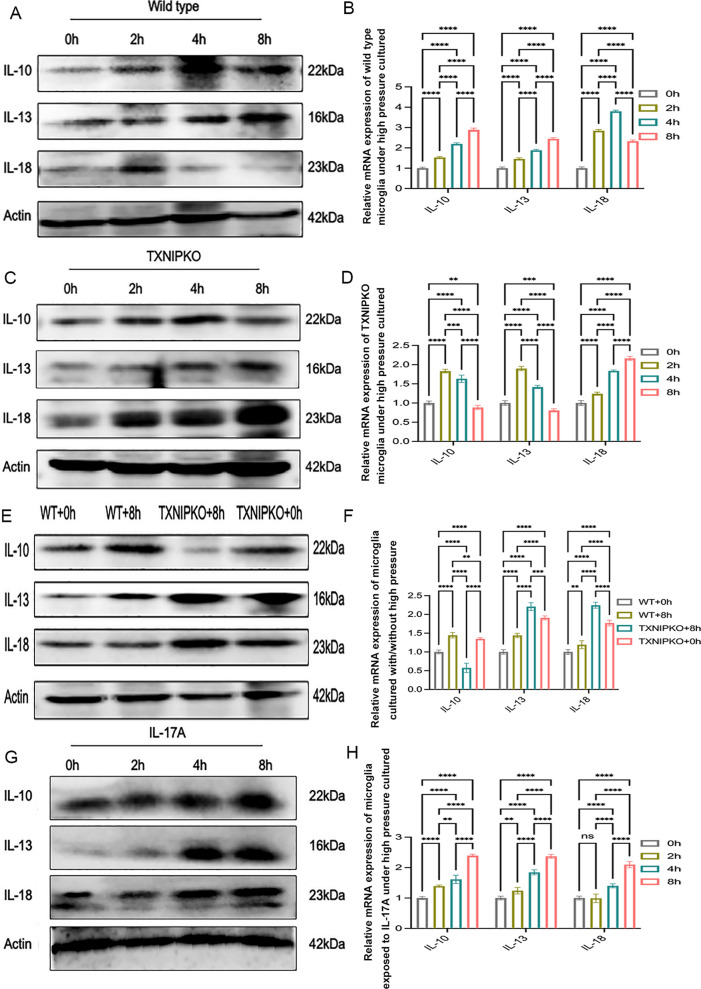
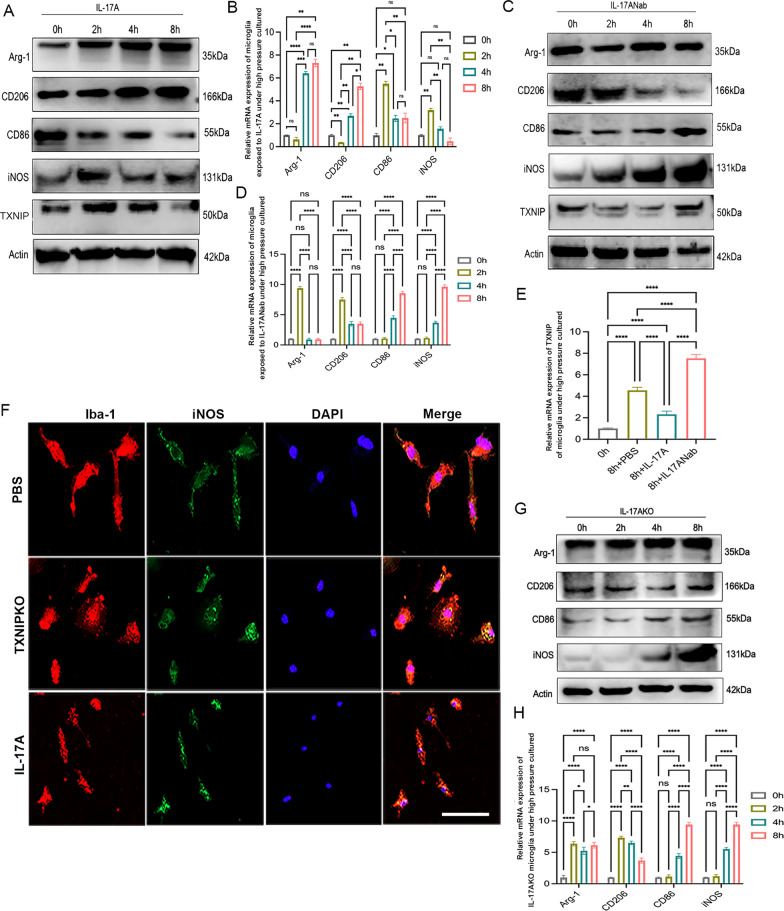
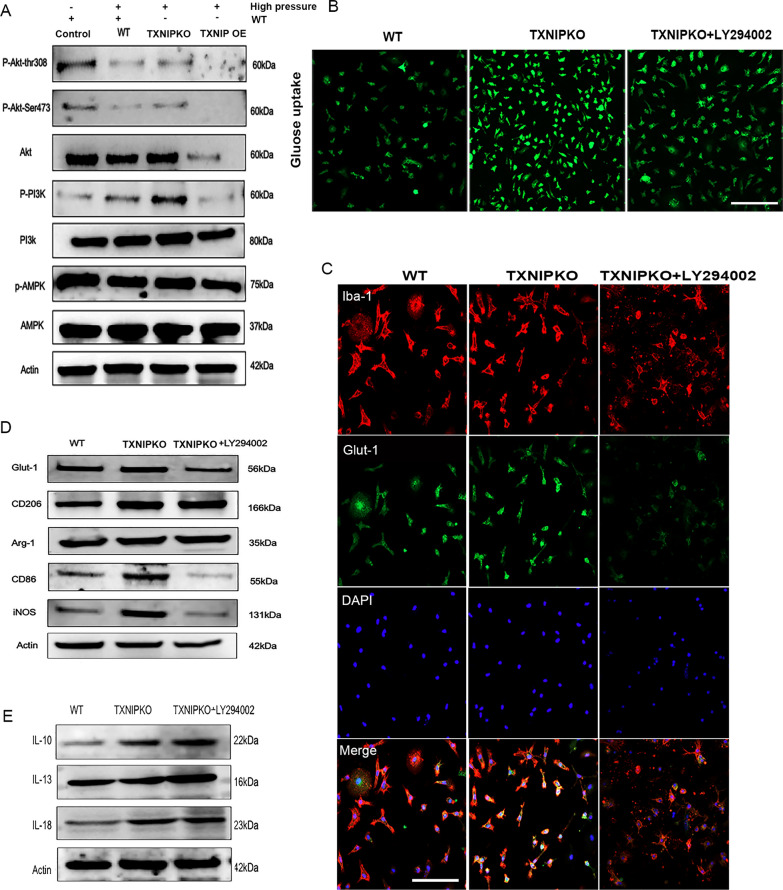
Results: In this study, for the first time we reported that TXNIP expression was remarkably increased in experimental glaucomatous retina of chronic ocular hypertension (COH) mice, and it was mainly expressed in the ganglion cells layer (GCL). In addition, we found that ablation of TXNIP promoted retinal ganglion cells (RGCs) survival and alleviated visual function impairment in experimental glaucoma. Then, we explored the spatiotemporal consistency between glial activation and retinal inflammation levels in COH mice respectively with TXNIP-deficiency and under treatment of a thermo-containing protein domain 3 (NLRP3) inhibitor MCC950, and the results indicated that TXNIP probably mediated neuroinflammation in glaucomatous retina by activating microglia. Furthermore, upregulation of TXNIP was found in pressure-stimulated microglia, whereas silencing TXNIP facilitated microglial polarization trending towards M1 type and reduced glucose transporter-1 (Glut-1) expression on microglia under high pressure in vitro. Moreover, IL-17A was found to play a role in acting synergistically with TXNIP upon the regulation of microglia polarity transformation. Finally, knockout of TXNIP was revealed to promote PI3K phosphorylation, whereas inhibition of PI3K by LY294002 effectively suppressed Glut-1 expression, glucose uptake, and M1-like transformation tendency in microglia obtained from TXNIP-deficiency mice under high pressure stimulation.

Conclusions: TXNIP is significantly involved in the inflammation-related neuropathy of experimental glaucoma and probably facilitates M1-like microglial transformation via PI3K/Akt pathway.

Keywords: Energy metabolism; Experimental glaucoma; Microglia; Neuroinflammation; PI3K/AKT; TXNIP.


Conflict of interest statement

Declarations. Ethics approval and consent to participate: The Animal Care and Use Committee of Ruijin Hospital, Shanghai Jiao Tong University School of Medicine approved all animal experimental protocols. Consent for publication: Not applicable. Competing interests: The authors declare that they have no competing interests.

Figures

Fig. 1
Fig. 1
TXNIP was involved in the neuropathy of experimental glaucoma. A, B Heat map and a volcano plot showed the fold-change in gene expression (log2 scale) and significance (− log10 scale) between the COH groups and control groups. Upregulated genes, red; downregulated genes, green. P values were adjusted based on Bonferroni correction. C, D Western blotting analysis and real-time RT-PCR analysis of TXNIP at 0, 2, 4, and 8 weeks of COH. E Immunofluorescent staining of TXNIP (green) in retinal slices at 0, 2, 4, and 8 weeks of COH (white arrows represent RGCs that expressing TXNIP). F F-VEP test at 4 weeks after COH modeling in different groups. G Immunofluorescent staining of Brn3a in retinal whole mounts at 4 weeks of COH mice in different groups. H. Immunofluorescent staining of NEFH in retinal whole mounts at 4 weeks of COH mice in different groups.(magnification 200 × , scale bar = 50 μm). n = 8 per group for immunofluorescent staining, real-time RT–PCR, Western blotting. n = 12 per group for the F-VEP test. One-way ANOVA was performed. *p < 0.05, **p < 0.01, ***p < 0·001 and ****p < 0.0001, ns, no significance. Bars represent the mean ± SD. NEFH, neurofilament heavy polypeptide. ONL, outer nuclear layer; OPL, outer plexiform layer; INL, inner nuclear layer; IPL, inner plexiform layer; GCL, ganglion cell layer. MCC950, PBS and TXNIPKO which means WT COH mice intravitreal injection with MCC950 or PBS,or TXNIPKO COH mice, respectively
Fig. 2
Fig. 2
TXNIP mediated neuroinflammation in retina by activating microglia. A Immunofluorescent staining of GFAP (red) in retinal slices at 4 weeks of COH mice in different groups. B, C Western blotting and real-time RT-PCR analysis of markers of three glial at 4 weeks of COH in different groups. D Double immunofluorescent staining of CD68 and Iba-1 in retinal slices of COH mice in different groups (white arrows represent microglia that expressing CD68 and Iba-1) (magnification 200 × , scale bar = 50 μm). n = 8 per group for immunofluorescent staining, real-time RT–PCR, Western blotting. One-way ANOVA was performed. *p < 0.05, **p < 0.01, ***p < 0.001 and ****p < 0·0001, ns, no significance. Bars represent the mean ± SD. ONL, outer nuclear layer; OPL, outer plexiform layer; INL, inner nuclear layer; IPL, inner plexiform layer; GCL, ganglion cell layer
Fig. 3
Fig. 3
TXNIP silence suppressed proinflammatory factors secretion and facilitated M1 polarization of pressurized microglia in vitro. A Immunofluorescent staining of GS (red) in retinal slices at 4 weeks of COH mice in different groups. B, C Western blotting and real-time RT-PCR analysis of proinflammatory factors and Brn3a at 4 weeks of COH in different groups. D, E Western blotting and real-time RT-PCR analysis of proinflammatory factors and cell markers in TXNIP-deficiency COH mice. FG Western blotting and real-time RT-PCR analysis of TXNIP in microglia cultured at 37.5 mmHg. H, I Western blotting and real-time RT-PCR analysis of proinflammatory factors in microglia of wild type and TXNIP-deficiency cultured at 37.5 mmHg for 8 h. J, K Western blotting and real-time RT-PCR analysis of the expression of Glut-1 in wild type or TXNIP-deficiency microglia cultured under normal or high pressure for 8 h. n = 8 per group for real-time RT–PCR and Western blotting. One-way ANOVA was performed. *p < 0.05, **p < 0.01, ***p < 0.001 and ****p < 0.0001, ns, no significance. Bars represent the mean ± SD
Fig. 4
Fig. 4
TXNIP silence facilitated M1 polarization of pressurized microglia in vitro (A). A, B Western blotting and real-time RT-PCR analysis of polarization markers of wild-type microglia cultured at 37.5 mmHg. C, D Western blotting and real-time RT-PCR analysis of polarization markers in TXNIP-deficiency microglia cultured at 37.5 mmHg. E, F Western blotting and real-time RT-PCR analysis of polarization markers of wild type and TXNIP-deficiency microglia cultured under normal pressure or at 37.5 mmHg for 8 h. G Immunofluorescent images showed the expression of Glut-1 in wild type or TXNIP-deficiency microglia cultured under normal or high pressure for 8 h (magnification 200 × , scale bar = 50 μm). n = 8 per group for immunofluorescent staining, real-time RT–PCR and Western blotting. One-way ANOVA was performed. *p < 0.05, **p < 0.01, ***p < 0.001 and ****p < 0.0001, ns, no significance. Bars represent the mean ± SD
Fig. 5
Fig. 5
TXNIP silence facilitated M1 polarization of pressurized microglia in vitro (B). A, B Western blotting and real-time RT-PCR analysis of IL-10, IL-13, IL-18 of wild-type microglia cultured at 37.5 mmHg. C, D Western blotting and real-time RT-PCR analysis of IL-10, IL-13, IL-18 in TXNIP-deficiency microglia cultured at 37.5 mmHg. E-F. Western blotting and real-time RT-PCR analysis of IL-10, IL-13,IL-18 of wild type and TXNIP-deficiency microglia cultured at 37.5 mmHg for 8 h. G, H Western blotting and real-time RT-PCR analysis of M1/M2 cellular markers of microglia pretreated with rmIL-17A cultured at 37.5 mmHg. n = 8 per group for real-time RT–PCR, Western blotting. One-way ANOVA was performed. *p < 0.05, **p < 0.01, ***p < 0.001 and ****p < 0.0001, ns, no significance. Bars represent the mean ± SD
Fig. 6
Fig. 6
TXNIP and IL-17A synergistically participated in the regulation of retinal microglial phenotype transformation. A, B Western blotting and real-time RT-PCR analysis of M1/M2 cellular markers and TXNIP of microglia pretreated with rmIL-17A cultured at 37.5 mmHg. C, D Western blotting and real-time RT-PCR analysis of M1/M2 cell markers and TXNIP of microglia pretreated with IL-17ANab cultured at 37.5 mmHg. E Real-time RT-PCR analysis of TXNIP in microglia cultured at 37.5 mmHg. F Double immunofluorescent staining of iNOS (green) and Iba-1(red) in wild type or TXNIP-deficiency microglia pretreated with rmIL-17A under normal pressure cultured (magnification 200 × , scale bar = 50μm). G, H Western blotting and real-time RT-PCR analysis of M1/M2 cellular markers in IL-17A-deficiency microglia cultured at 37.5 mmHg. n = 8 per group for immunofluorescent staining, real-time RT–PCR and Western blotting. One-way ANOVA was performed. *p < 0.05, **p < 0.01, ***p < 0.001 and ****p < 0.0001, ns, no significance. Bars represent the mean ± SD
Fig. 7
Fig. 7
TXNIP and IL-17A synergistically participated in the regulation of retinal M1/M2 microglial transformation. A, D Western blotting analysis and real-time RT-PCR analysis of expression of IL-10, IL-13 and IL-18 of microglia pretreated with IL-17ANab cultured at 37.5 mmHg. B Double immunofluorescent staining of Arg-1 (green) and Iba-1(red) in wild type or TXNIP-deficiency microglia pretreated with rmIL-17A under normal pressure cultured (magnification 200 × , scale bar = 50 μm). C, G Western blotting analysis and real-time RT-PCR analysis of IL-10, IL-13 and IL-18 in IL-17A-deficiency microglia cultured at 37.5 mmHg. E, H Western blotting analysis and real-time RT-PCR analysis of M1/M2 cellular markers in wild type or TXNIP-deficiency microglia pretreated with rmIL-17A under normal pressure cultured. F, I Western blotting analysis and real-time RT-PCR analysis of IL-10, IL-13 and IL-18 in wild type or TXNIP-deficiency microglia pretreated with rmIL-17A under normal pressure cultured. n = 8 per group for immunofluorescent staining, real-time RT–PCR, Western blotting. One-way ANOVA was performed. *p < 0.05, **p < 0.01, ***p < 0.001 and ****p < 0·0001, ns, no significance. Bars represent the mean ± SD
Fig. 8
Fig. 8
TXNIP regulated M1-like microglia transformation via the PI3K/Akt signaling pathway in experimental glaucoma. A Western blotting analysis of the expression of AMPK and PI3K/Akt signaling pathway proteins in microglia from wildtype or distinctive TXNIP-types cultured at 37.5 mmHg. B Glucose uptake of microglia cultured at 37.5 mmHg. C Double immunofluorescent staining of Glut-1 (green) and Iba-1(red) in TXNIP-deficiency microglia pretreated with or without LY294002 cultured at 37.5 mmHg (magnification 100 × , scale bar = 100 μm). D Western blotting analysis of the expression of Glut-1 and M1/M2 cellular markers in TXNIP-deficiency microglia pretreated with or without LY294002 cultured at 37.5 mmHg. E Western blotting analysis of the expression of IL-10, IL-13 and IL-18 in TXNIP-deficiency microglia pretreated with or without LY294002 cultured at 37.5 mmHg. n = 8 per group for immunofluorescent staining and Western blotting. One-way ANOVA was performed. *p < 0.05, **p < 0.01, ***p < 0.001 and ****p < 0.0001, ns, no significance. Bars represent the mean ± SD

Similar articles

Cited by

References

    1. Agarwal R, Agarwal P. Rodent models of glaucoma and their applicability for drug discovery. Expert Opin Drug Discov. 2017;12(3):261–70. - PubMed
    1. Ao H, Li H, Zhao X, Liu B, Lu L. TXNIP positively regulates the autophagy and apoptosis in the rat müller cell of diabetic retinopathy. Life Sci. 2021;267: 118988. - PubMed
    1. Baudouin C, Kolko M, Melik-Parsadaniantz S, Messmer EM. Inflammation in glaucoma: from the back to the front of the eye, and beyond. Prog Retin Eye Res. 2021;83: 100916. - PubMed
    1. Bordt EA, Polster BM. NADPH oxidase- and mitochondria-derived reactive oxygen species in proinflammatory microglial activation: a bipartisan affair? Free Radic Biol Med. 2014;76:34–46. - PMC - PubMed
    1. Campagno KE, Lu W, Jassim AH, Albalawi F, Cenaj A, Tso HY, et al. Rapid morphologic changes to microglial cells and upregulation of mixed microglial activation state markers induced by P2X7 receptor stimulation and increased intraocular pressure. J Neuroinflammation. 2021;18(1):217. - PMC - PubMed

MeSH terms

LinkOut - more resources