. 2024 Dec 30;25(1):28.
doi: 10.1186/s12860-024-00519-3.

Single-cell RNA sequencing identifies the expression of hemoglobin in chondrocyte cell subpopulations in osteoarthritis

Affiliations

Single-cell RNA sequencing identifies the expression of hemoglobin in chondrocyte cell subpopulations in osteoarthritis

Zhihao Zhang et al. BMC Mol Cell Biol. .

Abstract

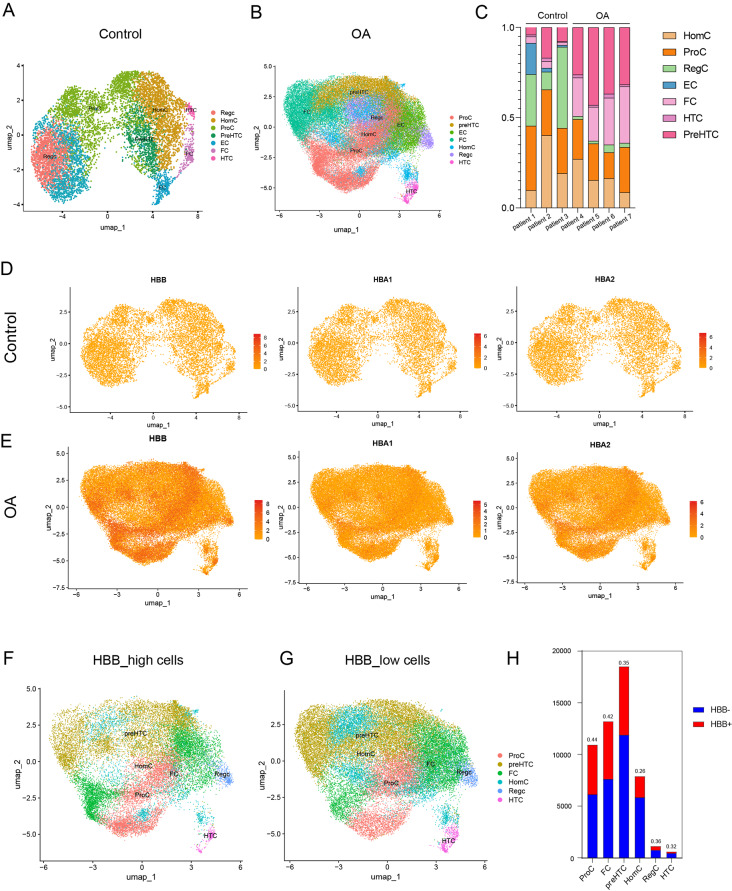
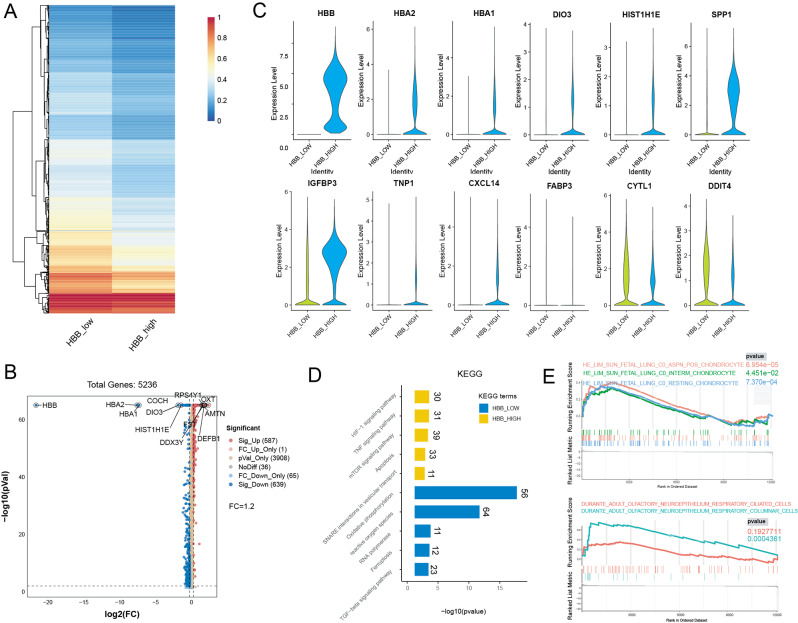
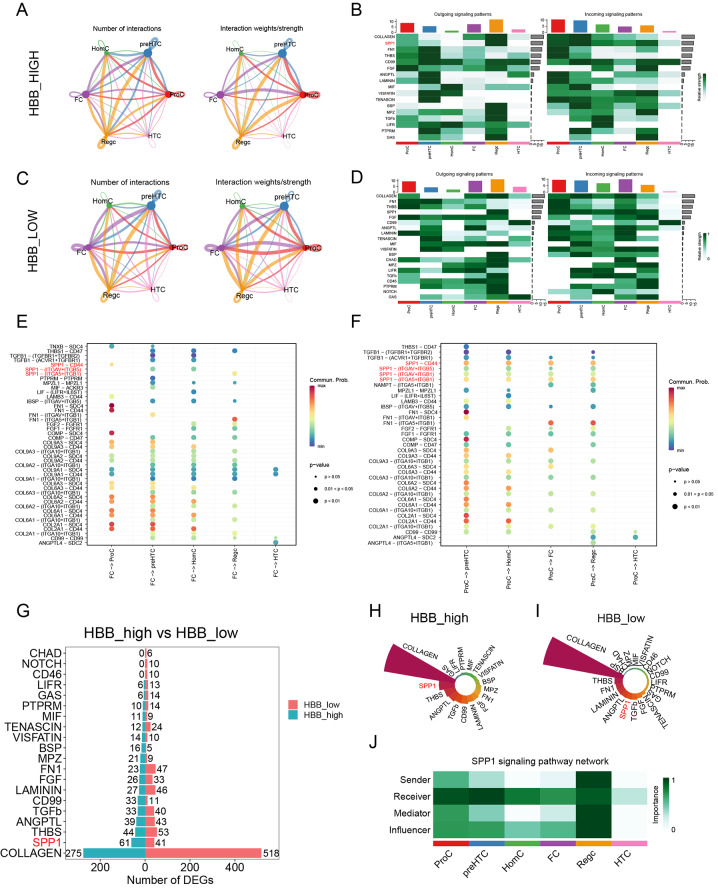
In recent years, chondrocytes have been found to contain hemoglobin, which might be an alternative strategy for adapting to the hypoxic environment, while the potential mechanisms of that is still unclear. Here, we report the expression characteristics and potential associated pathways of hemoglobin in chondrocytes using single-cell RNA sequencing (scRNA-seq). We downloaded data of normal people and patients with osteoarthritis (OA) from the Gene Expression Omnibus (GEO) database and cells are unbiased clustered based on gene expression pattern. We determined the expression levels of hemoglobin in various chondrocyte subpopulations. Meanwhile, we further explored the difference in the enriched signaling pathways and the cell-cell interaction in chondrocytes of the hemoglobin high-expression and low-expression groups. Specifically, we found that SPP1 was closely associated with the expression of hemoglobin in OA progression. Our findings provide new insights into the distribution characteristics of hemoglobin in chondrocytes and provide potential clues to the underlying role of hemoglobin in OA and the mechanisms related to that, providing potential new ideas for the treatment of OA.

Keywords: Chondrocyte; Hemoglobin; Osteoarthritis; Single-cell sequencing.


Conflict of interest statement

Declarations. Ethics approval and consent to participate: Animal procedures in this study were approved by the Northern Theater General Hospital Animal Medical Research Ethics Committee, and conducted according to the fundamental principles of the Basel Declaration and the ethical guidelines of the International Council for Laboratory Animal Science (ICLAS). Consent for publication: Not applicable. Competing interests: The authors declare no competing interests.

Figures

Fig. 1
Fig. 1
Single-cell RNA sequencing and identification of cell populations and gene signatures. A. The umap of human control and OA group chondrocyte monocyte transcriptome were visualized and colored according to the grouping obtained by undifferentiated cluster analysis. B. Distribution of patient samples in chondrocytes in control and OA groups. C. Visualization of umap colored according to cell types for human control and OA articular tissue single-cell transcriptomes. D. Dot plots showing the expression of indicated markers including SOX9, COMP, COL2A1, and ACAN for chondrocyte in control and OA articular tissue single-cell transcriptomes on the umap map. E. Dot plots showing the expression of indicated markers including HBB, HBA1, and HBA2 for hemoglobin in control and OA chondrocytes on umap map. The average cellular expression level of HBB, HBA1, and HBA2 in chondrocytes samples from different group (control, OA) is shown. Data is expressed as mean ± SD, *p < 0.05, **p < 0.01, ***p < 0.001
Fig. 2
Fig. 2
Subclustering of control and osteoarthritis (OA) group chondrocytes and characteristics of HBB expression in chondrocytes. A-B. Subclustering of control and OA chondrocytes further identified 7 distinct subtypes. Color-coded tsne plot is shown and each chondrocyte subcluster is defined on the right. RegC: regulatory chondrocyte, HomC: homeostatic chondrocyte, ProC: proliferative chondrocyte, preHTC: prehypertrophic chondrocyte, EC: effector chondrocyte, FC: fibrocartilage chondrocyte, HTC: hypertrophic chondrocyte. C. Cell proportions of chondrocytes subclusters in control and OA tissue. RegC subpopulation accounted for a greater proportion in control samples, and FC and preHTC subpopulations accounted for greater proportion in OA samples. D-E. Dot plots showing the expression of indicated markers including HBB, HBA1, and HBA2 for hemoglobin in OA chondrocytes is higher than that in control chondrocytes on the umap map. F-H. The proportions of 7 chondrocytes subpopulations in HBB high-expressing and HBB low-expressing cells, and HBB is highest expressed in ProC, FC and preHTC chondrocyte subgroups
Fig. 3
Fig. 3
Characteristics of HBB high-expressing chondrocytes in osteoarthritis (OA) tissue. A. Heatmap of differentially expressed genes between HBB low-expressing and HBB high-expressing chondrocytes. B. Volcano plot of differentially expressed genes in HBB low-expressing and high-expressing chondrocytes. C. Violin plots demonstrating the expression of representative genes in HBB low-expressing and HBB high-expressing chondrocytes chondrocytes. D. KEGG biological process enrichment analysis of differentially expressed genes between HBB low-expressing and HBB high-expressing chondrocytes. E. GSEA enrichment illustrating the difference of genes expression profile in HBB high-expressing and HBB low-expressing chondrocytes in pathways related with chondrocytes and respiration
Fig. 4
Fig. 4
Potential ligand–receptor interactions analysis in HBB high-expressing and HBB low-expressing chondrocytes. A-D. The quantity and intensity of interaction between different chondrocytes subpopulations and high outgoing and incoming signaling pattern in different chondrocytes subpopulations in HBB high-expressing chondrocytes (A-B) and HBB low-expressing (C-D) chondrocytes. E-F. The ligand–receptor pairs exhibit the major interaction pathways between FC (E) or ProC (F) chondrocyte subpopulation and any one of the chondrocyte subpopulations in HBB high-expressing chondrocytes. G-I. The expression of representative signaling pathways in HBB low-expressing and HBB high-expressing chondrocytes. The number of SPP1 associated differentially expressed genes (DEGs) is high HBB high-expressing chondrocytes (H) and HBB low-expressing chondrocytes (I), and in the comparison of HBB high-expressing and HBB low-expressing chondrocytes (G). J. Heatmap illustrating the roles of different cell subpopulations in the expression of the SPP1 associated pathway in HBB high-expressing chondrocytes, and SPP1 associated signals were mainly generated by RegC and received by all other kind of cell subpopulation
Fig. 5
Fig. 5
Characteristics of SPP1 high-expressing chondrocytes in control and osteoarthritis (OA) tissue. (A) The expressing pattern of SPP1 in chondrocytes in control and OA tissue. Dot plots showing the expression of SPP1 in OA chondrocytes is higher than that in control chondrocytes on the tsne map. (B) The proportions of SPP1 high-expressing cells in 7 subpopulations in OA tissue, and HBB is highest expressed in ProC, FC and preHTC chondrocyte subgroups. C-D. Heatmap and volcano plot of differentially expressed genes between SPP1 low-expressing and SPP1 high-expressing chondrocytes. E. Dot plots showing the expression of SPP1 in HBB high-expression chondrocytes is higher than that in HBB low-expressing chondrocytes on the tsne map. F. KEGG biological process enrichment analysis between SPP1 low-expressing and SPP1 high-expressing chondrocytes, and mTOR signaling pathway and insulin signaling pathway are enriched in SPP1 high-expressing chondrocytes. G. The expression level of representative genes including MTOR, IGFBP1 and EIF4EBP2 of mTOR pathway is significantly higher in SPP1 high-expressing chondrocytes compared with SPP1 low-expressing chondrocytes. H, J. The percent of hemoglobin positive chondrocytes is higher in OA chondrocytes compared with control chondrocytes. I, K. The percent of SPP1 positive chondrocytes is higher in OA chondrocytes compared with control chondrocytes. Data is expressed as mean ± SD, **p < 0.01, ****p < 0.0001. Scale bar: 50 μm

Similar articles

Cited by

References

    1. Bellelli A, Tame JRH. Hemoglobin allostery and pharmacology. Mol Aspects Med. 2022;84:101037. - PubMed
    1. Maes C, Carmeliet G, Schipani E. Hypoxia-driven pathways in bone development, regeneration and disease. Nat Rev Rheumatol. 2012;8(6):358–66. - PubMed
    1. Yao Q, et al. Suppressing mitochondrial respiration is critical for Hypoxia Tolerance in the fetal growth plate. Dev Cell. 2019;49(5):748–e7637. - PMC - PubMed
    1. Schipani E, et al. Hypoxia in cartilage: HIF-1alpha is essential for chondrocyte growth arrest and survival. Genes Dev. 2001;15(21):2865–76. - PMC - PubMed
    1. Gell DA. Structure and function of haemoglobins. Blood Cells Mol Dis. 2018;70:13–42. - PubMed