

Interpretable machine learning model for predicting clinically significant prostate cancer: integrating intratumoral and peritumoral radiomics with clinical and metabolic features
- PMID: 39736623
- PMCID: PMC11684284
- DOI: 10.1186/s12880-024-01548-2
Interpretable machine learning model for predicting clinically significant prostate cancer: integrating intratumoral and peritumoral radiomics with clinical and metabolic features
Abstract
Background: To develop and validate an interpretable machine learning model based on intratumoral and peritumoral radiomics combined with clinicoradiological features and metabolic information from magnetic resonance spectroscopy (MRS), to predict clinically significant prostate cancer (csPCa, Gleason score ≥ 3 + 4) and avoid unnecessary biopsies.
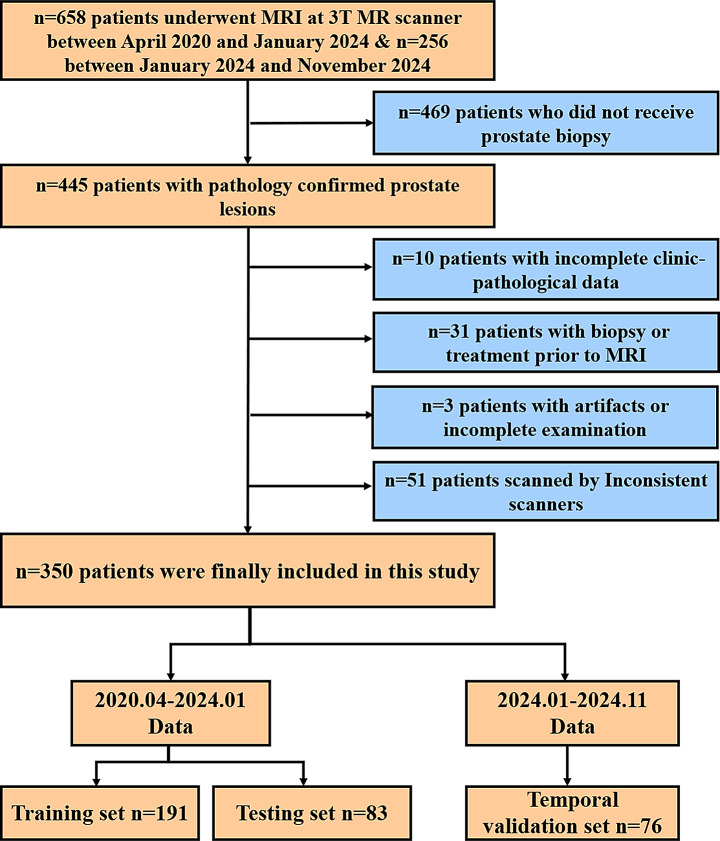
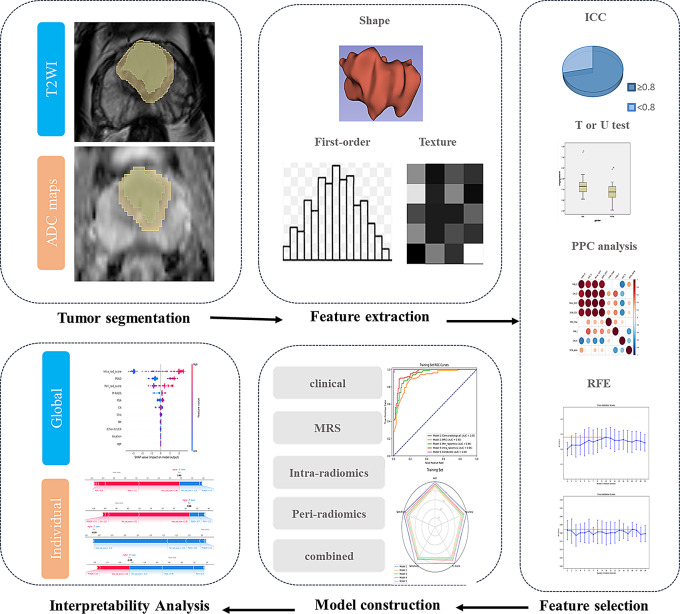
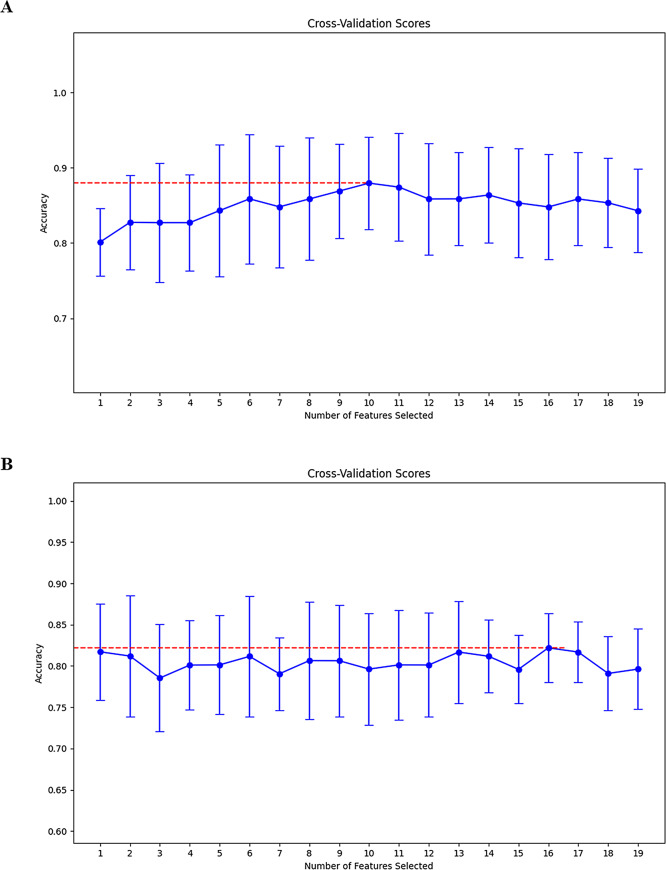
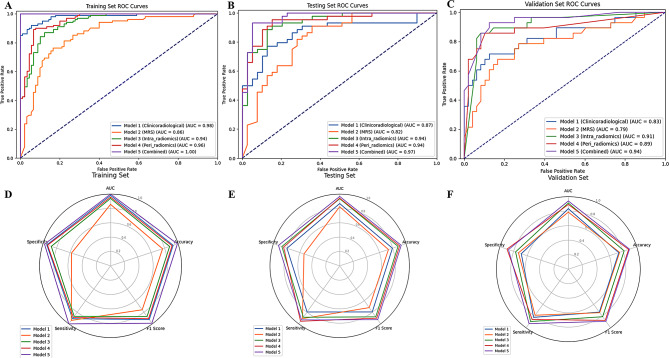
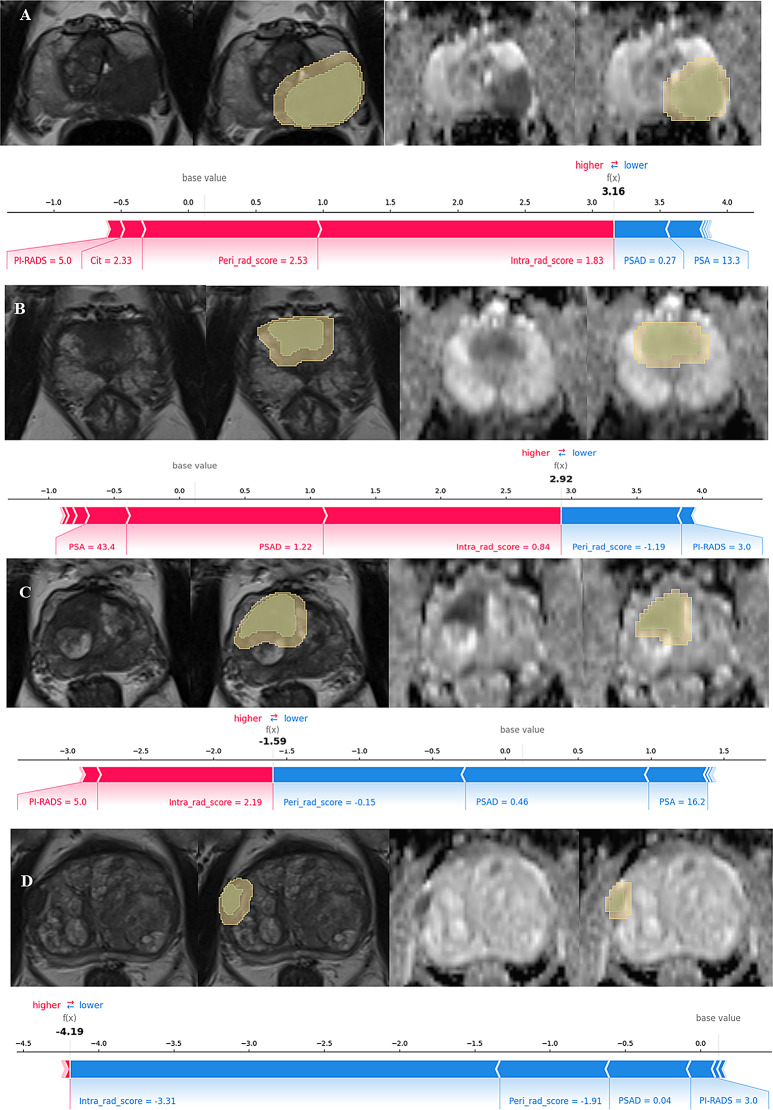
Methods: This study retrospectively analyzed 350 patients with suspicious prostate lesions from our institution who underwent 3.0 Tesla multiparametric magnetic resonance imaging (mpMRI) prior to biopsy (training set, n = 191, testing set, n = 83, and a temporal validation set, n = 76). Intratumoral and peritumoral volumes of interest (VOIintra, VOIperi)) were manually segmented by experienced radiologists on T2-weighted imaging (T2WI) and apparent diffusion coefficient (ADC) maps. Radiomic features were extracted separately from the VOIintra and VOIperi. After feature selection via the recursive feature elimination (RFE) algorithm, intratumoral radiomic score (intra-rad-score) and peritumoral radiomic score (peri-rad-score) were constructed. The clinical model, MRS model, and combined model integrating radiomic, clinicoradiological and metabolic features were constructed via the eXtreme Gradient Boosting (XGBoost) algorithm. The predictive performance of the models was evaluated in both the training and testing sets using receiver operating characteristic (ROC) curve analysis. SHapley Additive exPlanations (SHAP) analysis was applied to the combined model to visualize and interpret the prediction process.
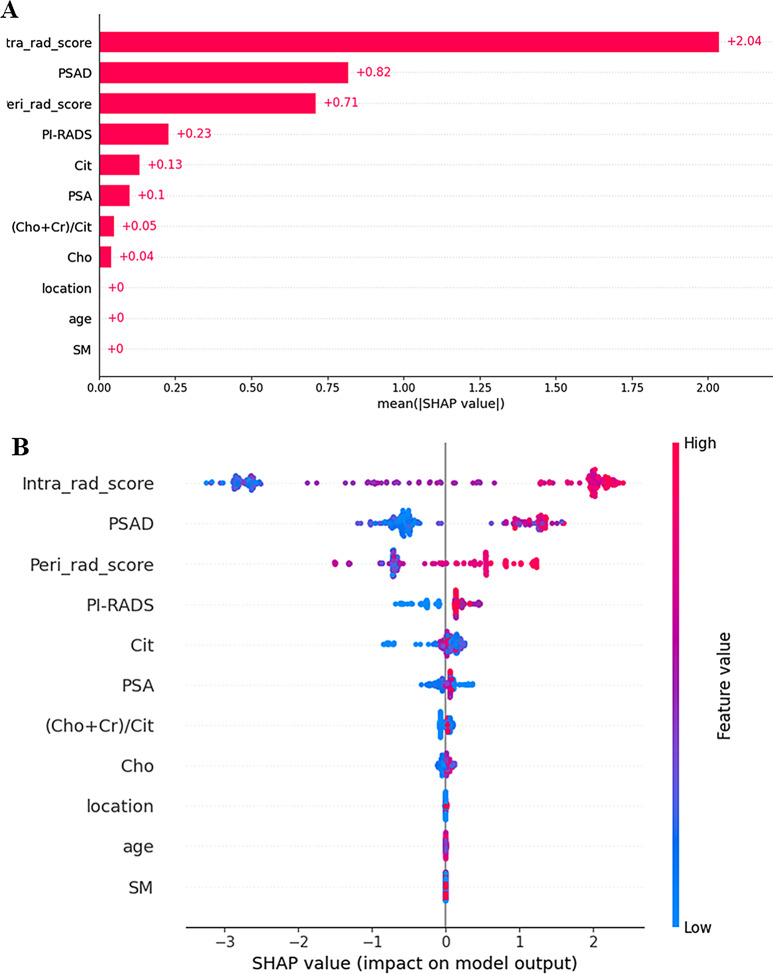
Results: A total of 350 patients were included, comprising 173 patients with csPCa (49.4%) and 177 patients with non-csPCa (50.6%). The intra-rad-score and peri-rad-score were constructed via 10 and 16 radiomic features. The combined model demonstrated the highest AUC, accuracy, F1 score, sensitivity, and specificity in the testing set (0.968, 0.928, 0.927, 0.932, and 0.923, respectively) and in the temporal validation set (0.940, 0.895, 0.890, 0.923, and 0.875, respectively). SHAP analysis revealed that the intra-rad-score, PSAD, peri-rad-score, and PI-RADS score were the most important predictors of the combined model.
Conclusion: We developed and validated a robust machine learning model incorporating intratumoral and peritumoral radiomic features, along with clinicoradiological and metabolic parameters, to accurately identify csPCa. The prediction process was visualized via SHAP analysis to facilitate clinical decision- making.
Keywords: Interpretability; Machine learning; Prostate cancer; Radiomics.
© 2024. The Author(s).
Conflict of interest statement
Declarations. Ethics approval and consent to participate: This study was approved by the institutional review board of Xinxiang Central Hospital (approval number, 2023 − 761). The informed consent was waived. Consent for publication: Not applicable. Competing interests: The authors declare no competing interests.
Figures
Similar articles
-
Integration of intratumoral and peritumoral CT radiomic features with machine learning algorithms for predicting induction therapy response in locally advanced non-small cell lung cancer.BMC Cancer. 2025 Mar 13;25(1):461. doi: 10.1186/s12885-025-13804-x. BMC Cancer. 2025. PMID: 40082786 Free PMC article.
-
Magnetic Resonance Imaging Radiomics-Based Machine Learning Prediction of Clinically Significant Prostate Cancer in Equivocal PI-RADS 3 Lesions.J Magn Reson Imaging. 2021 Nov;54(5):1466-1473. doi: 10.1002/jmri.27692. Epub 2021 May 10. J Magn Reson Imaging. 2021. PMID: 33970516
-
Combining multi-parametric MRI radiomics features with tumor abnormal protein to construct a machine learning-based predictive model for prostate cancer.Sci Rep. 2025 Jul 2;15(1):22816. doi: 10.1038/s41598-025-05718-2. Sci Rep. 2025. PMID: 40596249 Free PMC article.
-
Machine learning based radiomics approach for outcome prediction of meningioma - a systematic review.F1000Res. 2025 Mar 25;14:330. doi: 10.12688/f1000research.162306.1. eCollection 2025. F1000Res. 2025. PMID: 40206662 Free PMC article.
-
Predicting clinically significant prostate cancer in PI-RADS 3 lesions using MRI-based radiomics: a literature review of methodological variations and performance.Abdom Radiol (NY). 2025 Apr 2. doi: 10.1007/s00261-025-04914-y. Online ahead of print. Abdom Radiol (NY). 2025. PMID: 40172658 Review.
Cited by
-
Intralesional and perilesional radiomics strategy based on different machine learning for the prediction of international society of urological pathology grade group in prostate cancer.BMC Med Imaging. 2025 Jul 4;25(1):266. doi: 10.1186/s12880-025-01812-z. BMC Med Imaging. 2025. PMID: 40615943 Free PMC article.
-
Differentiating Lung Adenocarcinoma from Tuberculous Nodules in HIV/AIDS Patients Using Preoperative CT-Based Intratumoral and Peritumoral Radiomics Combined with Clinical Features.J Multidiscip Healthc. 2025 May 12;18:2693-2706. doi: 10.2147/JMDH.S524527. eCollection 2025. J Multidiscip Healthc. 2025. PMID: 40384812 Free PMC article.
References
-
- Sung H, Ferlay J, Siegel RL, Laversanne M, Soerjomataram I, Jemal A, et al. Global Cancer statistics 2020: GLOBOCAN estimates of incidence and Mortality Worldwide for 36 cancers in 185 countries. CA Cancer J Clin. 2021;71(3):209–49. - PubMed
-
- Epstein JI, Egevad L, Amin MB, Delahunt B, Srigley JR, Humphrey PA. The 2014 International Society of Urological Pathology (ISUP) Consensus Conference on Gleason Grading of Prostatic Carcinoma: definition of grading patterns and proposal for a New Grading System. Am J Surg Pathol. 2016;40(2):244–52. - PubMed
-
- Hamdy FC, Donovan JL, Lane JA, Mason M, Metcalfe C, Holding P, et al. 10-Year outcomes after monitoring, surgery, or Radiotherapy for localized prostate Cancer. N Engl J Med. 2016;375(15):1415–24. - PubMed
-
- Wilt TJ, Jones KM, Barry MJ, Andriole GL, Culkin D, Wheeler T, et al. Follow-up of Prostatectomy versus Observation for early prostate Cancer. N Engl J Med. 2017;377(2):132–42. - PubMed
MeSH terms
LinkOut - more resources
Full Text Sources
Medical
Research Materials
Miscellaneous
