

Cardiometabolic index and mortality risks: elevated cancer and reduced cardiovascular mortality risk in a large cohort
- PMID: 39736689
- PMCID: PMC11687173
- DOI: 10.1186/s12944-024-02415-3
Cardiometabolic index and mortality risks: elevated cancer and reduced cardiovascular mortality risk in a large cohort
Abstract
Background: With metabolic disorders on the rise globally, the cardiometabolic index (CMI) has emerged as a crucial predictor of mortality risks linked to cancer, cardiovascular disease, and diabetes. This novel index, which combines lipid metabolism and body composition, is the focus of this study, aimed at exploring its association with all-cause and specific mortality in an all-age adult population.
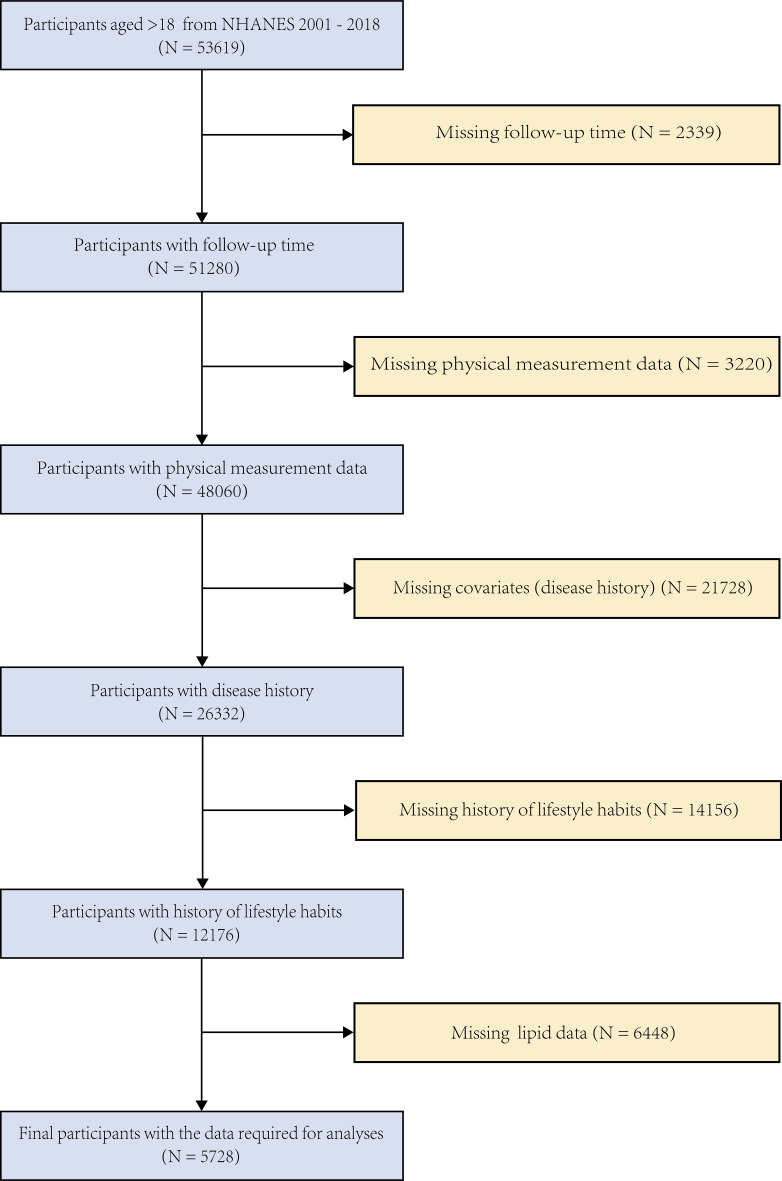
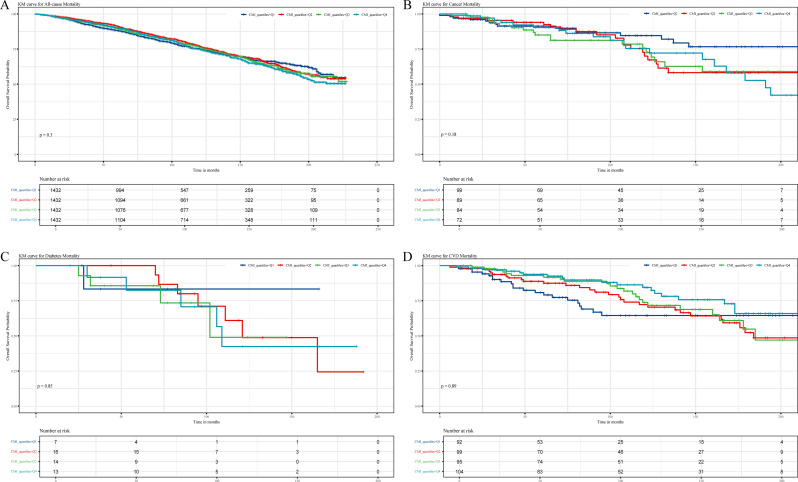
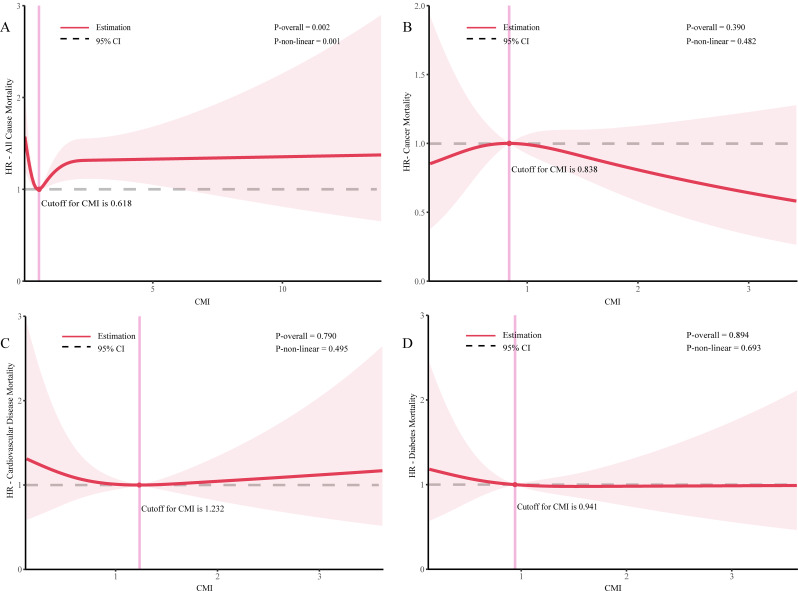
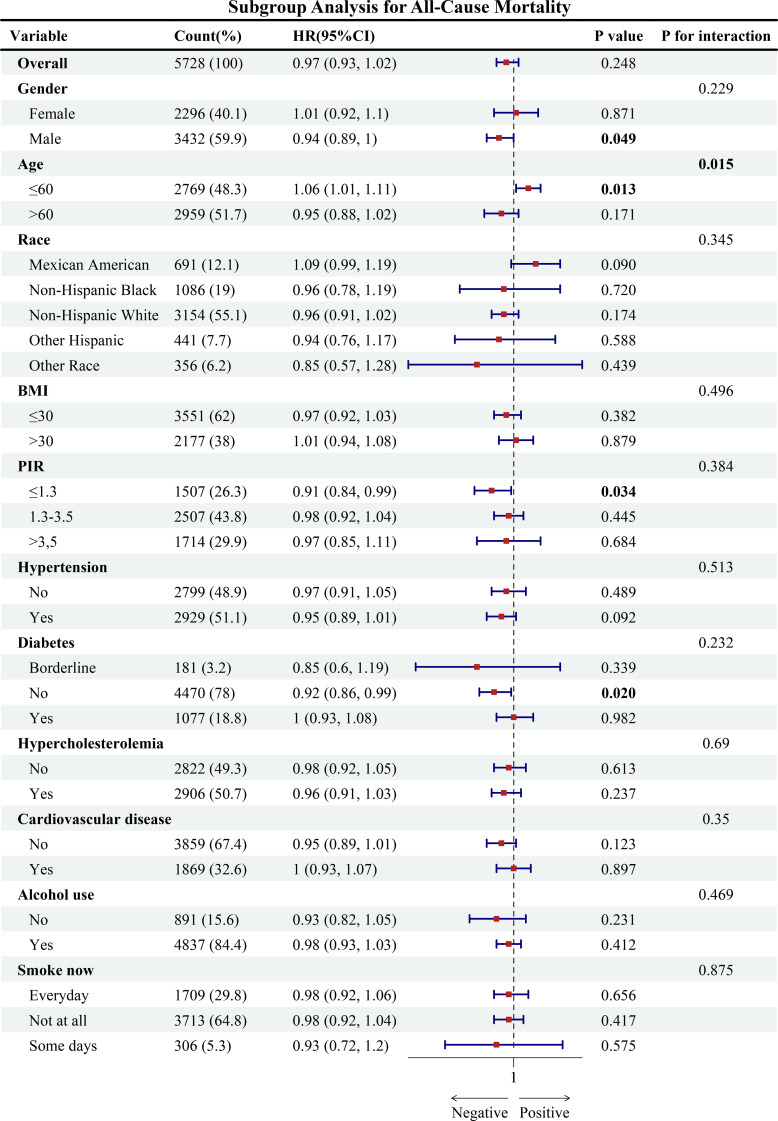
Methods: A longitudinal cohort study including 5,728 participants aged over 18 from nine cycles between 2001 and 2018 was enrolled and assessed. CMI served as the exposure variable, while outcomes included all-cause mortality and mortality due to cardiovascular disease, cancer, and diabetes. The Cox frailty model and average marginal effects were employed to evaluate the contribution of CMI to all-cause and specific mortality collectively. Restricted cubic spline analyses and stratified analyses were conducted to investigate potential nonlinear effects and interactions.
Results: The decreased participants exhibited considerably higher CMI than the alive's. A positive association was found between CMI and all-cause mortality (HR=1.05, 95% CI=1.01-1.10). Notably, CMI was linked to an increased risk of cancer mortality (HR=1.02) and a reduced risk of cardiovascular disease mortality (HR=0.85). Furthermore, the average marginal effect of CMI on diabetes mortality was the largest (AME=0.499). The RCS curves revealed that participants had the lowest risk of all-cause mortality at a CMI of 0.618. Sensitivity analyses further supported these findings.
Conclusion: This study represents the first comprehensive assessment on the contribution of CMI to mortality across an all-age adult population, providing some insights for the comprehensive assessment of health and disease states.
Keywords: All-cause and specific mortality; Average marginal effects; Cardiometabolic index; Cox Frailty model; Longitudinal cohort study.
© 2024. The Author(s).
Conflict of interest statement
Declarations. Ethics approval and consent to participate: The protocols of NHANES were approved by the institutional review board of the National Center for Health Statistics, CDC ( https://www.cdc.gov/nchs/nhanes/irba98.htm ). NHANES has obtained written informed consent from all participants. Consent for publication: Written informed consent for publication was obtained from all participants. Competing interests: The authors declare no competing interests.
Figures
References
-
- Carrera-Bastos P et al. Total adiponectin in indigenous melanesians on Kitava. Am J Hum Biol (2024). - PubMed
-
- Beasley JM et al. Dietary patterns in the mediators of Atherosclerosis in South asians living in America (MASALA) study: comparisons across methodologies. BMJ Nutr Prev Health (2024).
-
- Gao B et al. The triglyceride glucose index was nonlinearly associated with all-cause mortality in diabetic patients. Nutr Metab Cardiovasc Dis (2024). - PubMed
MeSH terms
LinkOut - more resources
Full Text Sources
Medical
