

Google trend analysis of the Indian population reveals a panel of seasonally sensitive comorbid symptoms with implications for monitoring the seasonally sensitive human population
- PMID: 39736745
- PMCID: PMC11686857
- DOI: 10.1186/s12963-024-00349-7
Google trend analysis of the Indian population reveals a panel of seasonally sensitive comorbid symptoms with implications for monitoring the seasonally sensitive human population
Abstract
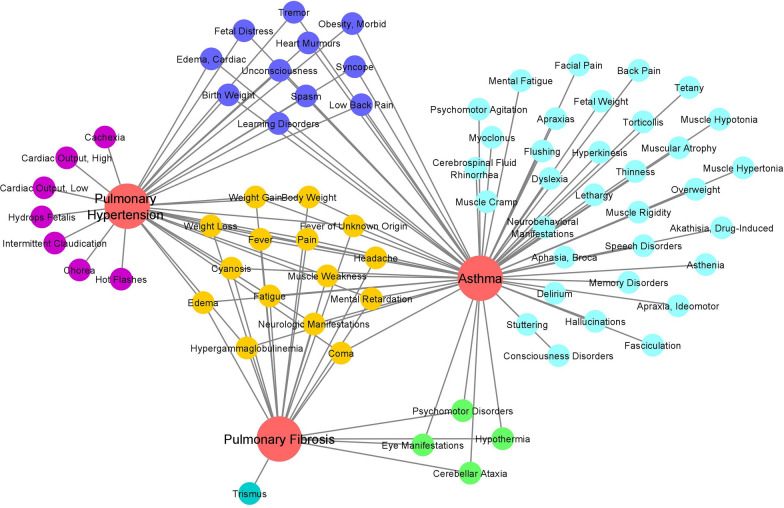
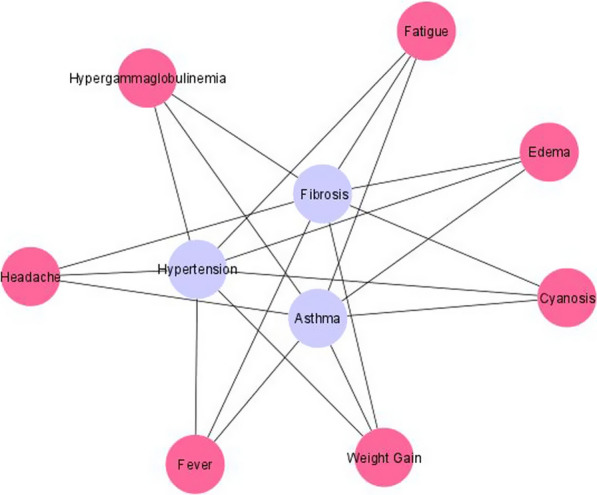
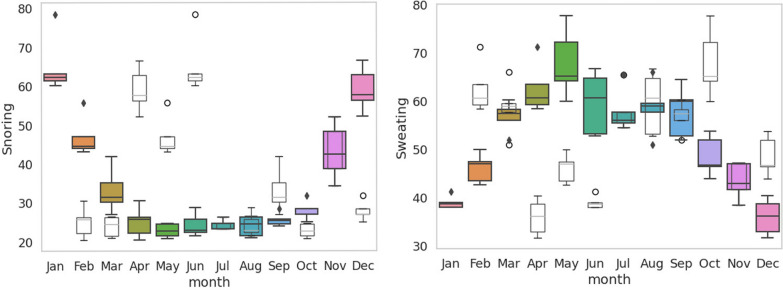
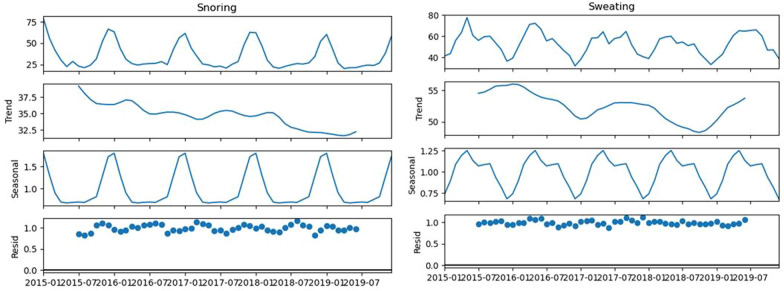
Seasonal variations in the environment induce observable changes in the human physiological system and manifest as various clinical symptoms in a specific human population. Our earlier studies predicted four global severe seasonal sensitive comorbid lifestyle diseases (SCLDs), namely, asthma, obesity, hypertension, and fibrosis. Our studies further indicated that the SCLD category of the human population may be maladapted or unacclimatized to seasonal changes. The current study aimed to explore the major seasonal symptoms associated with SCLD and evaluate their seasonal linkages via Google Trends (GT). We used the Human Disease Symptom Network (HSDN) to dissect common symptoms of SCLD. We then exploited medical databases and medical literature resources in consultation with medical practitioners to narrow down the clinical symptoms associated with four SCLDs, namely, pulmonary hypertension, pulmonary fibrosis, asthma, and obesity. Our study revealed a strong association of 12 clinical symptoms with SCLD. Each clinical symptom was further subjected to GT analysis to address its seasonal linkage. The GT search was carried out in the Indian population for the period from January 2015-December 2019. In the GT analysis, 11 clinical symptoms were strongly associated with Indian seasonal changes, with the exception of hypergammaglobulinemia, due to the lack of GT data in the Indian population. These 11 symptoms also presented sudden increases or decreases in search volume during the two major Indian seasonal transition months, namely, March and November. Moreover, in addition to SCLD, several seasonally associated clinical disorders share most of these 12 symptoms. In this regard, we named these 12 symptoms the "seasonal sensitive comorbid symptoms (SSC)" of the human population. Further clinical studies are needed to verify the utility of these symptoms in screening seasonally maladapted human populations. We also warrant that clinicians and researcher be well aware of the limitations and pitfalls of GT before correlating the clinical outcome of SSC symptoms with GT.
Keywords: Asthma; Obesity; Pulmonary fibrosis; Pulmonary hypertension; Seasonality; Seasonally sensitive population.
© 2024. The Author(s).
Conflict of interest statement
Declarations. Competing interests: The authors declare no competing interests.
Figures


Similar articles
-
Google trend analysis of climatic zone based Indian severe seasonal sensitive population.BMC Public Health. 2020 Mar 12;20(1):306. doi: 10.1186/s12889-020-8399-0. BMC Public Health. 2020. PMID: 32164654 Free PMC article.
-
Chronic lifestyle diseases display seasonal sensitive comorbid trend in human population evidence from Google Trends.PLoS One. 2018 Dec 12;13(12):e0207359. doi: 10.1371/journal.pone.0207359. eCollection 2018. PLoS One. 2018. PMID: 30540756 Free PMC article.
-
[Standard technical specifications for methacholine chloride (Methacholine) bronchial challenge test (2023)].Zhonghua Jie He He Hu Xi Za Zhi. 2024 Feb 12;47(2):101-119. doi: 10.3760/cma.j.cn112147-20231019-00247. Zhonghua Jie He He Hu Xi Za Zhi. 2024. PMID: 38309959 Chinese.
-
Seasonal variation in bronchial hyperreactivity (BHR) in allergic patients.Clin Rev Allergy Immunol. 1997 Summer;15(2):169-85. doi: 10.1007/BF02826585. Clin Rev Allergy Immunol. 1997. PMID: 9315410 Review.
-
Can we modulate asthma maintenance treatment level with disease seasonal variations?Eur Rev Med Pharmacol Sci. 2015;19(6):942-9. Eur Rev Med Pharmacol Sci. 2015. PMID: 25855917 Review.
References
-
- Arora VS, McKee M, Stuckler D. Google trends: opportunities and limitations in health and health policy research. Health Policy (Amsterdam, Netherlands). 2019;123(3):338–41. 10.1016/j.healthpol.2019.01.001. - PubMed
-
- Bhattacharyya M, Pal MS, Sharma YK, Majumdar D. Changes in sleep patterns during prolonged stays in Antarctica. Int J Biometeorol. 2008;52(8):869–79. 10.1007/s00484-008-0183-2. - PubMed
-
- Bommarito, E., & Bommarito, M. (2019). An Empirical Analysis of the Python Package Index (PyPI) (arXiv:1907.11073). arXiv. http://arxiv.org/abs/1907.11073
MeSH terms
LinkOut - more resources
Full Text Sources
Miscellaneous
