. 2024 Dec 31;15(1):504.
doi: 10.1186/s13287-024-04117-0.

Enhanced fetal hemoglobin production via dual-beneficial mutation editing of the HBG promoter in hematopoietic stem and progenitor cells for β-hemoglobinopathies

Affiliations

Enhanced fetal hemoglobin production via dual-beneficial mutation editing of the HBG promoter in hematopoietic stem and progenitor cells for β-hemoglobinopathies

Prathibha Babu Chandraprabha et al. Stem Cell Res Ther. .

Abstract

Background: Sickle cell disease (SCD) and β-thalassemia patients with elevated gamma globin (HBG1/G2) levels exhibit mild or no symptoms. To recapitulate this natural phenomenon, the most coveted gene therapy approach is to edit the regulatory sequences of HBG1/G2 to reactivate them. By editing more than one regulatory sequence in the HBG promoter, the production of fetal hemoglobin (HbF) can be significantly increased. However, achieving this goal requires precise nucleotide conversions in hematopoietic stem and progenitor cells (HSPCs) at therapeutic efficiency, which remains a challenge.

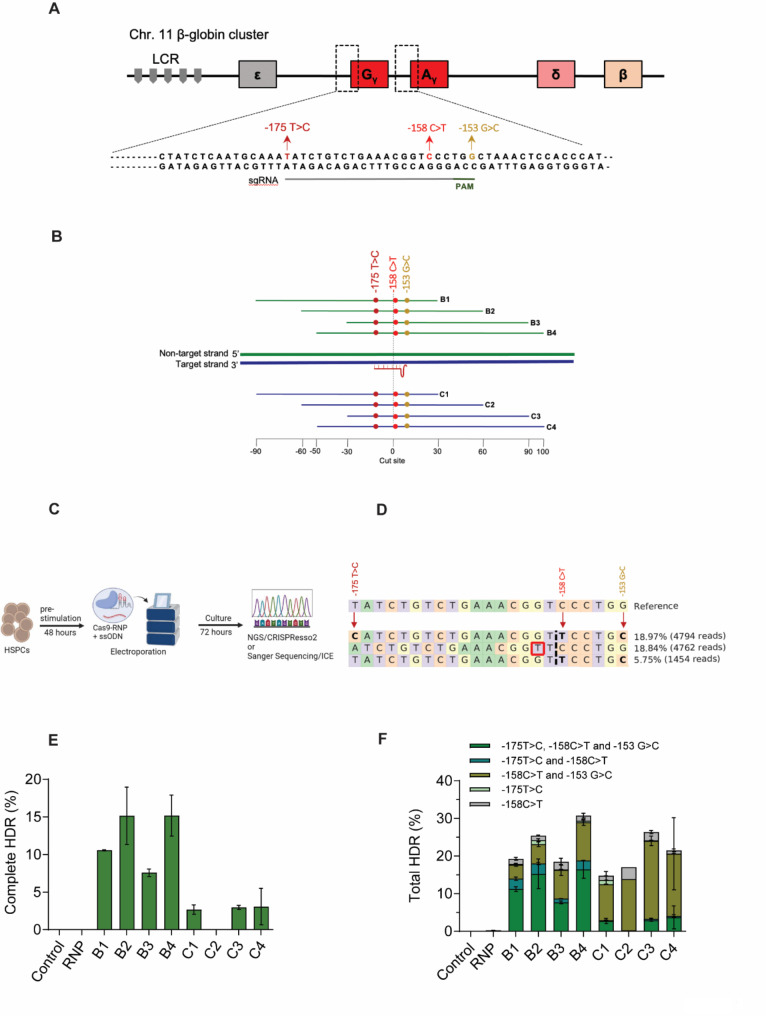
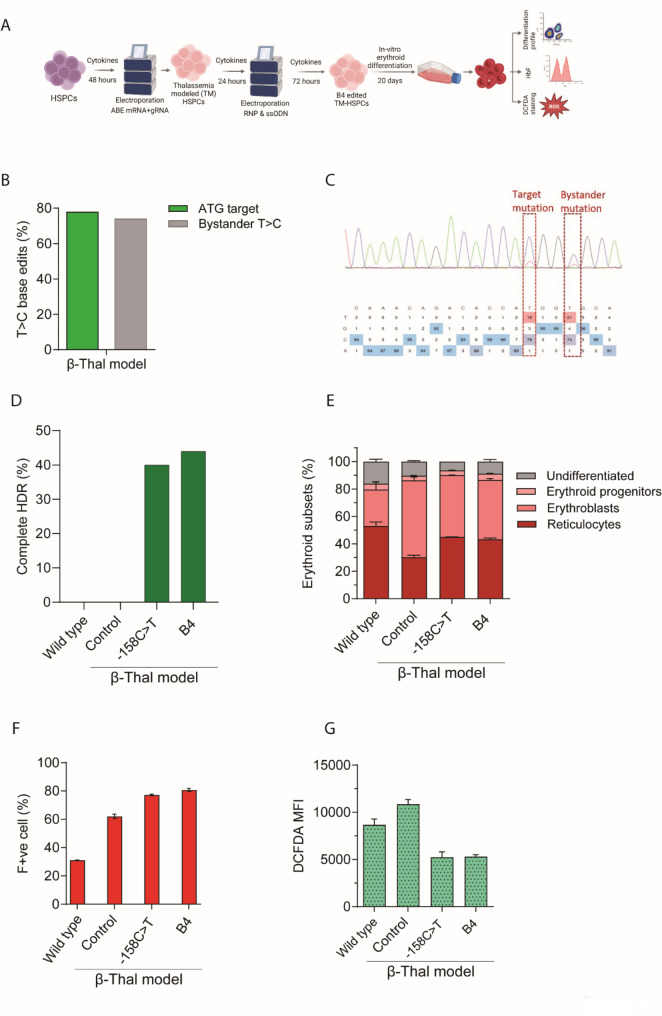
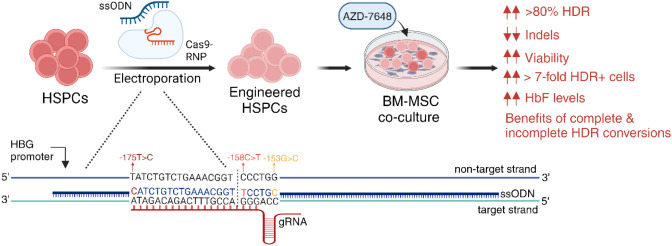
Methods: We employed Cas9 RNP-ssODN-mediated homology-directed repair (HDR) gene editing to mimic two naturally occurring HBG promoter point mutations; -175T > C, associated with high HbF levels, and -158 C > T, a common polymorphism in the Indian population that induces HbF under erythropoietic stress, in HSPCs.

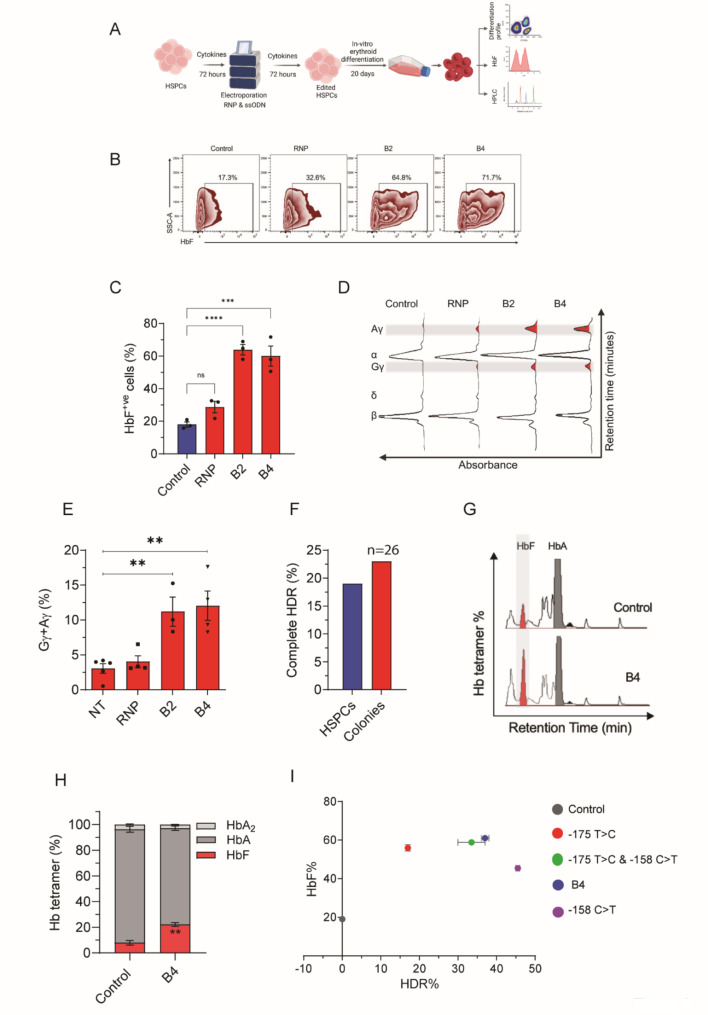
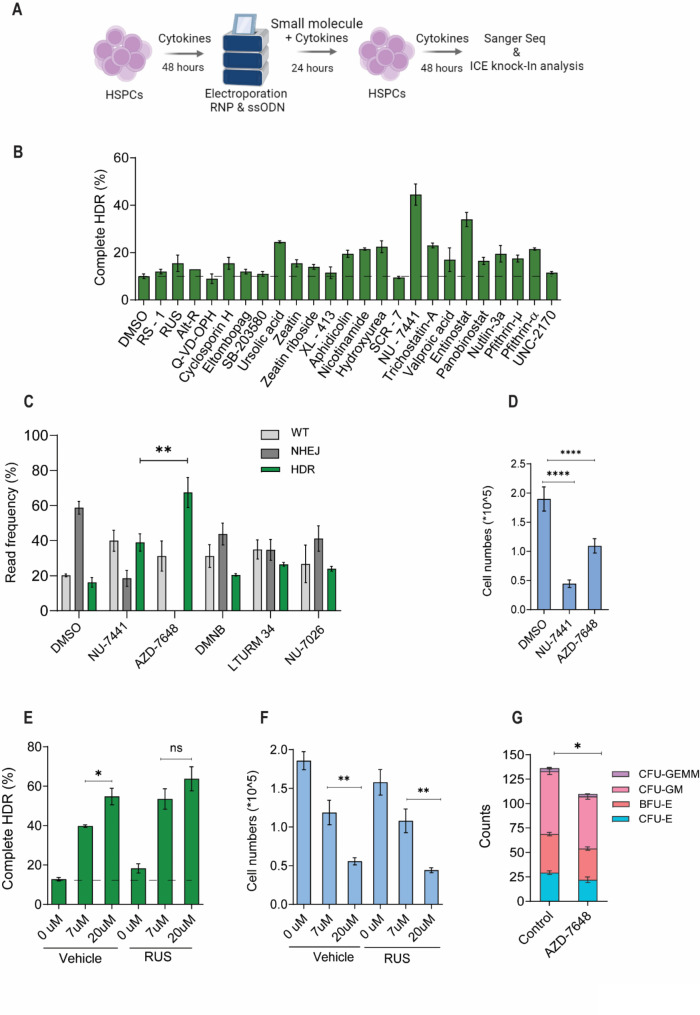
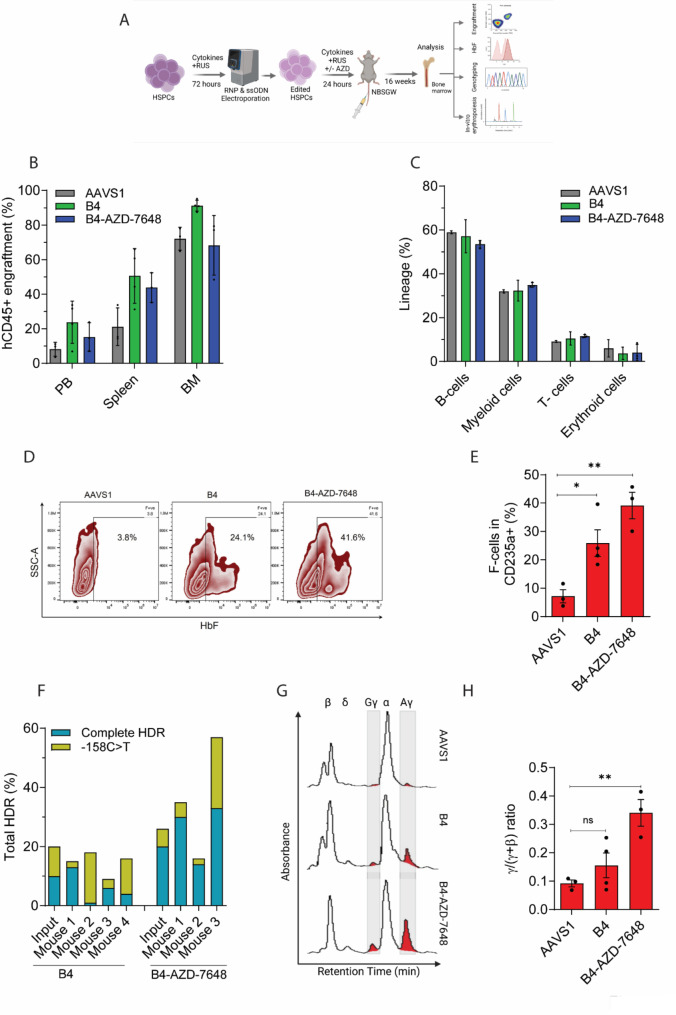
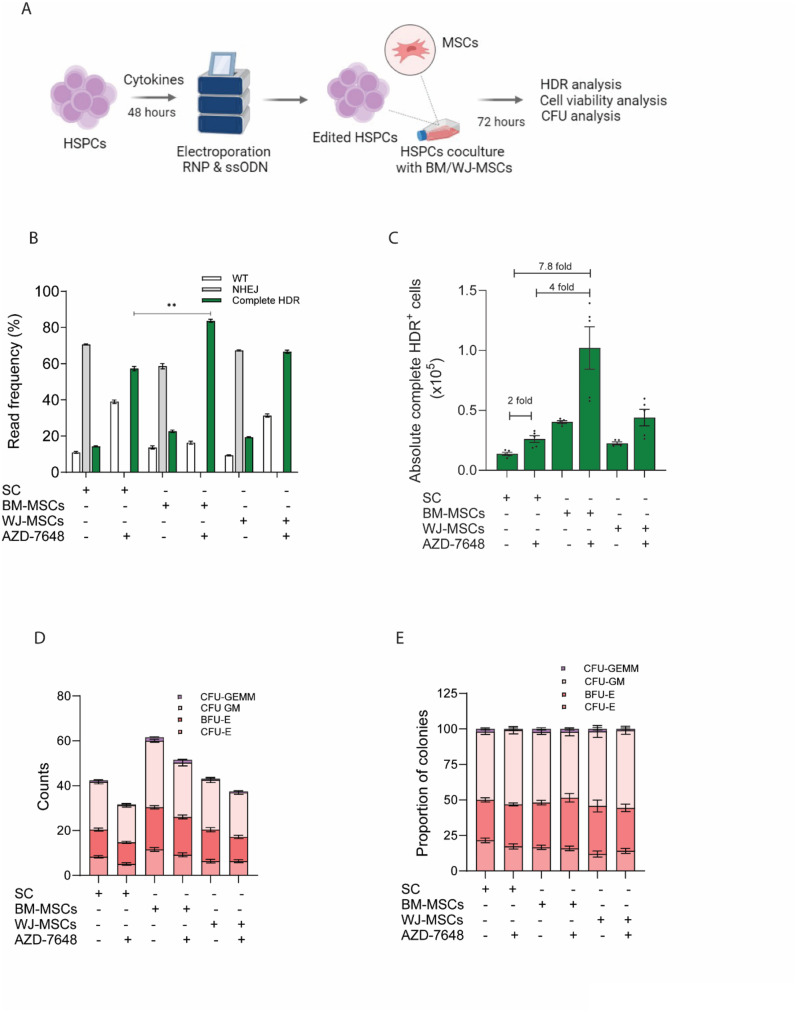
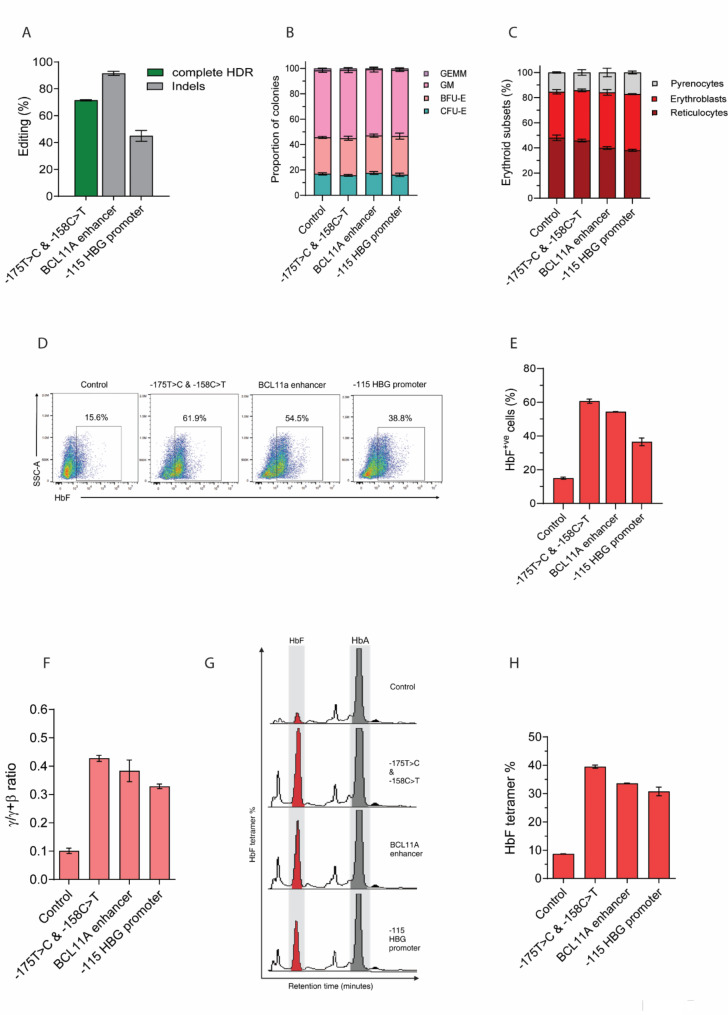
Results: Asymmetric, nontarget ssODN induced high rates of complete HDR conversions, with at least 15% of HSPCs exhibiting both the -175T > C and -158 C > T mutations. Optimized conditions and treatment with the small molecule AZD-7648 increased this rate, with up to 57% of long-term engrafting human HSPCs in NBSGW mice containing at least one beneficial mutation. Functionally, in vivo erythroblasts exhibited high levels of HbF, which was sufficient to reverse the cellular phenotype of β-thalassemia. Further support through bone marrow MSC co-culture boosted complete HDR conversion rates to exceed 80%, with minimal InDels, improved cell viability, and induced fetal hemoglobin levels similar to those of Cas9 RNP-mediated indels at BCL11A enhancer and HBG promoter.

Conclusions: Cas9 RNP-ssODN-based nucleotide conversion at the HBG promoter offers a promising gene therapy approach to ameliorate the phenotypes of β-thalassemia and SCD. The developed approach can simplify and broaden applications that require the cointroduction of multiple nucleotide modifications in HSPCs.

Keywords: Gene therapy; Hematopoietic stem cells; Homology-directed gene editing; Single-stranded oligonucleotides; β-hemoglobinopathies.


Conflict of interest statement

Declarations. Ethical approval: The study titled “ In vivo efficacy and safety studies of CSCR-ST04, the gene edited autologous hematopoietic stem cells for the gene therapy of -hemoglobinopathies” was approved by the IRB of the Christian Medical College Vellore, with the approval number “IRB: 11807 (other) dated: 30.01.2019” and, the animal experiments were approved by the IAEC (approval number: 01/2019). Consent for publication: Not applicable. Competing interests: The authors declare that they have no competing interests.

Figures

Fig. 1
Fig. 1
Asymmetric, nontarget ssODN contributes to improved HDR at HBG promoter in HSPCs. (A) Schematic view of the target depicting the β-like globin gene cluster, encompassing the locus control region (LCR) (gray bars), followed by the HBE1 (gray box), HBG2 and HBG1 (red boxes), HBD (pink box) and HBB (beige box) genes sequentially from the 5’ to 3’ direction. Expanded view of HBG1/2 promoters detailing the gRNA target sequence (underlined in gray), protospacer adjacent motif (underlined in green), and the position of intended nucleotide conversions, -175T > C, -158 C > T and − 153G > C (PAM shield), are indicated. (Image made with GraphPad-Prism). (B) Graphic representation of ssODN oligo designs screened for HDR editing of HBG1/2 promoters. The target/gRNA binding strand is depicted in blue, and the nontarget/nongRNA binding strand, in green. The ssODNs - B series (green) and C series (blue), are colored according to their homologous derivative strand. Three desired mutations are marked as colored circles: -175T > C (maroon), -158 C > T (red), and − 153G > C (yellow). The dotted line denotes the Cas9 cut site, and the length scale is provided in base pairs. (C) Schematic workflow describing the steps for screening and validation of ssODNs (1B) for HDR editing of HSPCs. (Created with BioRender.com). (D) Representative NGS reads from CRISPresso2 output of edited samples showing alleles around the cut site. The three desired nucleotide conversions are indicated in colors (as described in 1 A, 1B). (E) The complete HDR frequency, i.e., the fraction of reads with conversions of all 3 nucleotides resulting from screened ssODN designs obtained from deep sequencing reads analyzed using CRISPResso2 (results displayed with the mean ± SEM for n = 2). (F) Deep sequencing results of edited samples showing total cumulative frequencies of all beneficial HDR conversions at the HBG1/2 promoters, analyzed using CRISPResso2 (n = 2; n = 1 for C2 due to low cell yield post editing in one replicate). (mean ± SEM)
Fig. 2
Fig. 2
HBG promoters with − 175T > C and − 158 C > T dual conversions expresses HbF in in vitro differentiated erythroblasts. (A) Schematic of the workflow followed for erythroid differentiation and analysis of edited cells (Created with BioRender). (B) Representative flow cytometry plots for globin expression analysis by intracellular HbF staining of differentiated erythroblasts in vitro. (C) Percentage of HbF+ ve mature erythroblasts observed on day 20 of erythroid differentiation from n = 3 samples (mean ± SEM; ****p < 0.0001, *** p < 0.001; one-way ANOVA (Dunnett’s multiple comparisons test)). (D) RP-HPLC analysis of traces of globin chains detected in erythroid protein lysates of control and edited samples on day 20 of differentiation. The areas under the Aγ and Gγ peaks are shaded in red. (E) Percentage of total γ globin chains (Aγ + Gγ) detected by RP-HPLC in control and edited samples. n = 3 to 5 (mean ± SEM; ** p < 0.01; one-way ANOVA (Dunnett’s multiple comparisons test). (F) Complete HDR frequency (reads containing all 3 mutations) in the edited HSPC pool and the CFU colonies generated from the HSPC edited pool. The HDR editing was analysed by Sanger sequencing, followed by Synthego ICE knock-in analysis. n = 26 CFU colonies. (G) Representative HPLC traces for hemoglobin tetramer variant analysis of protein lysates from day 20 erythroblasts. The areas under HbF and HbA are shaded red and gray, respectively. (H) Proportion of hemoglobin (Hb) tetramers detected by HPLC analysis (mean ± SEM for n = 3; ** p < 0.01; unpaired t-test). (I) Comparison of HDR conversion frequency at each desired nucleotide location with respect to HbF levels detected by flow cytometry in edited samples (mean ± SEM for n = 2)
Fig. 3
Fig. 3
Transient DNA-PK inhibition using AZD-7648 amplifies HDR editing in HSPCs. (A) Schematic of the experimental workflow for small molecule screening to enhance HBG promoter-targeted HDR conversion in HSPCs. (Created with BioRender.com). (B) Complete HDR conversion (reads with all 3 mutations) frequency in edited HSPCs treated with indicated small molecules and genotyped on day 3 postelectroporation by Sanger sequencing and Synthego ICE knock-in analysis (mean ± SEM for n = 4). (C) Complete HDR, NHEJ, and WT read frequencies observed on day 3 postelectroporation after transient exposure to various DNA-PK inhibitors (mean ± SEM for n = 4; **p < 0.01; two-way ANOVA (Dunnett’s multiple comparison test)). (D) HSPCs cell numbers after transient treatment with the DNA-PK inhibitors NU-7441 and AZD-7648 and the DMSO control on day 3 postelectroporation (mean ± SEM for n = 4; ****p < 0.0001; one-way ANOVA (Dunnett’s multiple comparison test)). (E) The frequency of complete HDR after treatment with different doses (0, 7, or 20 µM) of AZD-7648 with and without RUS supplementation in HSPC culture media. The data were analyzed using Sanger sequencing and ICE knock-in. The baseline HDR from the vehicle control is marked with a dotted line. (Mean ± SEM for n = 4; * p < 0.05; unpaired student t-test). (F) Cell numbers observed after treatment with different concentrations (0, 7, or 20 µM) of AZD-7648 with or without RUS supplementation on day 3 postelectroporation (mean + SEM for n = 2; ** p < 0.01; ordinary one-way ANOVA (Dunnett’s multiple comparison test)). (G) No. of CFU-E-, BFU-E-, CFU-GM- and CFU-GEMM colonies formed from HSPCs that are cultured with RUS and treated with DMSO or 7 µM AZD-7648- for 24 h post gene editing with Cas9 RNP and B4-ssODN (mean + SEM for n = 2; * p < 0.05; unpaired student t-test)
Fig. 4
Fig. 4
HDR-edited HSPCs engraft long-term in NBSGW mice and recapitulate HbF in vivo. (A) Schematic of the experimental plan for xenotransplantation assay of -175T > C- and − 158 C > T-HDR-edited HSPCs into NBSGW mice and subsequent analysis. (Created with BioRender.com). (B) The frequency of human cell (hCD45+) engraftment in the peripheral blood, spleen and bone marrow was detected at 16 weeks post infusion by flow cytometry. (n = 3–4; mean ± SEM). (C) Sixteen-week multilineage repopulation output of edited cells detected by staining for B cells (CD19), myeloid cells (CD33), and T cells (CD3) gated within the hCD45 + population and erythroid cells (CD235a) gated directly from the bone marrow P1 population (n = 3–4; mean ± SEM). (D) Representative flow cytometry zebra plots for intracellular HbF staining of sorted CD235a + erythroblasts in 16th week bone marrow. (E) Frequency of HbF+ ve cells among CD235a + erythroblasts sorted from bone marrow. (n = 3–4; mean ± SEM; *p < 0.05, ** p < 0.01; ordinary one-way ANOVA (Dunnett’s multiple comparison test)). (F) Total beneficial HDR frequencies at HBG1/2 promoters consisting of complete HDR (reads with all 3 conversions) and individual − 158 C > T conversions detected by genotyping 16th week bone marrow cells. The data are shown for individual animals analyzed in each edited group. (G) Reverse-phase high-performance liquid chromatography (HPLC) trace files of protein lysates from 16 th week NBSGW bone marrow cells differentiated in vitro. A representative chromatogram of a single animal from each treatment group is shown. The Gγ and Aγ peaks are shaded in red. (H) Globin chain ratio of β-like globins in in vitro differentiated long term engrafted bone marrow cells [γ/(γ + β)] (mean ± SEM for n = 3–4 technical replicates for 1 biological replicate; ** p < 0.01; ordinary one-way ANOVA (Dunnett’s multiple comparison test))
Fig. 5
Fig. 5
Dual-beneficial conversions at HBG promoters reverses the phenotype of in vitro generated β-thalassemia model. (A) Schematic of the experimental workflow for generating thalassemia-modeled HSPCs (β-thal-HSPCs) via ABE base editing and further reversal of the phenotype via HBG1/2 editing. β-thal-HSPCs are generated by targeting the HBB initiation codon. The ABE base edited cells were subsequently electroporated with Cas9 RNP and ssODN. The cells were further differentiated into erythroid lineages for downstream analysis (Created with BioRender.com). (B) Frequency of base edits at the HBB gRNA target site. The intended ATG target and bystander T > C conversions were obtained by genotyping the DNA collected on day 10 post RNP + B4 electroporation via Sanger sequencing and analyzing the ab1 reads via EditR software (n = 1). (C) EditR sequence analysis output of the base-edited sample. The locations of T nucleotide conversions are highlighted by red dotted lines. The heatmap shows the observed nucleotide frequencies of all 4 bases spanning the 20-base pair long sgRNA target. (D) HDR frequency for base-edited samples electroporated with − 158-PAM and B4 (all 3 mutations) ssODNs. (E) Fraction of erythroid subsets observed on the 20th day of differentiation analyzed by flow cytometry using CD235a and CD71 staining. Populations were distinguished as reticulocytes (CD235a + CD71-), erythroblasts (CD235a + CD71+), erythroid progenitors (CD235a-CD71+) and undifferentiated cells (CD235a-CD71-) (n = 2 technical replicates analyzed per treatment). (F) Flow cytometry analysis of F + ve cell staining in day 20-derived erythroblasts from unedited control, β-thal-HSPC control and HDR-edited TM-HSPCs (n = 2 technical replicates analyzed per treatment). (G) The mean fluorescence intensity of DCFDA + staining was used to detect reactive oxygen species (ROS) in erythroblasts on the 12th day of differentiation. (n = 2 technical replicates analyzed per treatment)
Fig. 6
Fig. 6
Coculture of electroporated HSPCs with MSCs mitigates HDR editing-associated toxicity. (A) Schematic of the experimental workflow for evaluating the efficacy of postelectroporation coculture of HSPCs with bone marrow and Wharton’s jelly derived mesenchymal stem cells (MSCs) in preventing cell toxicity. (Created with BioRender.com). (B) Frequency of reads corresponding to complete HDR (all 3 conversions), NHEJ indels, and wild-type sequences in edited samples genotyped by Sanger sequencing and Synthego ICE knock-in analysis. The standard condition (SC) refers to only cytokine culture (details in methods). Mesenchymal stem cells (MSCs) are derived from either bone marrow (BM-MSCs) or Wharton’s jelly (WJ-MSCs). All conditions were tested with and without AZD-7648. BM-MSCs and WJ-MSCs were also cultured in HSPC media supplemented with cytokines, both with and without AZD-7648. (mean ± SEM for n = 5; ** p < 0.01; unpaired student t-test). (C) Absolute number of complete HDR edited cells on day 3 postelectroporation. The fold increase for samples with respect to the control (SC) is indicated above the respective bars. (D) The number of colonies with different CFUs from 200 cells seeded in Methocult medium for 14 days was determined by microscopy (n = 3 per sample for 2 treatments performed per condition). (E) Proportion of CFU colonies obtained for different treatments on the 14th day. (Data are shown for n = 3 per sample for 2 treatments performed per condition.)
Fig. 7
Fig. 7
HBG promoter with − 175T > C and − 158 C > T mutations generate functional outcome comparable to existing Indel-based gene editing approaches for HbF reactivation. (A) Genotype analysis to evaluate complete HDR (reads with all 3 mutations) and indel frequency in electroporated HSPCs by Sanger sequencing and Synthego ICE knock-in analysis (mean + SEM for n = 2). (B) Proportion of CFU-E-, BFU-E-, CFU-GM- and CFU-GEMM colonies formed from HSPCs edited for different targets (mean + SEM for n = 2). (C) Proportion of erythroid subsets day 20 of differentiation. The populations are gated as reticulocytes (CD235a + Hoechst-), erythroblasts (CD235a + Hoechst+), and pyrenocytes (CD235a-Hoechst+). (mean + SEM for n = 2). (D) Representative flow cytometry plots for HbF + ve cells analysis for different conditions. (E) Percentage of HbF + ve cells in different editing conditions (mean + SEM for n = 2). (F) Ratio of γ-globin chains to β-like globins observed in RP-HPLC chain analysis (mean + SEM for n = 2). (G) Representative variant HPLC chromatogram traces for hemoglobin tetramer variant analysis of day 20 erythroblasts. The areas under HbF and HbA are shaded red and gray, respectively. (H) Percentage of HbF tetramers detected by HPLC analysis (mean + SEM for n = 2)
Fig. 8
Fig. 8
Graphical abstract of the work. The HSPCs were electroporated with Cas9-RNP and ssODN to introduce two naturally occurring beneficial mutations (-175T > C and − 158 C > T) and a PAM shield mutation (-153G > C). The electroporated HSPCs were then co-cultured with BM-MSCs and AZD-7648 small molecule. This process resulted in HBG promoter activation, with over 70% of HSPCs containing all three conversions, minimal indels, and no compromise on cell viability. The erythroblasts from the edited HSPCs had high HbF levels

Similar articles

Cited by

References

    1. Piel FB, Steinberg MH, Rees DC. Sickle cell disease. N Engl J Med. 2017;376(16):1561–73. - PubMed
    1. Taher AT, Musallam KM, Cappellini MD. β-Thalassemias. N Engl J Med. 2021;384(8):727–43. - PubMed
    1. Williams TN, Weatherall DJ. World distribution, population genetics, and health burden of the hemoglobinopathies. Cold Spring Harb Perspect Med. 2012;2(9):a011692. - PMC - PubMed
    1. Locatelli F, Cavazzana M, Frangoul H, Fuente J, de la, Algeri M, Meisel R. Autologous gene therapy for hemoglobinopathies: from bench to Patient’s Bedside. Mol Ther. 2024;32(5):1202–18. - PMC - PubMed
    1. Locatelli F, Thompson AA, Kwiatkowski JL, Porter JB, Thrasher AJ, Hongeng S, et al. Betibeglogene Autotemcel Gene Therapy for Non–β 0 /β 0 genotype β-Thalassemia. N Engl J Med. 2022;386(5):415–27. - PubMed

MeSH terms

LinkOut - more resources