. 2024 Dec 30;22(1):1158.
doi: 10.1186/s12967-024-06020-x.

Taltirelin induces TH expression by regulating TRHR and RARα in medium spiny neurons

Affiliations

Taltirelin induces TH expression by regulating TRHR and RARα in medium spiny neurons

Kedong Zhu et al. J Transl Med. .

Abstract

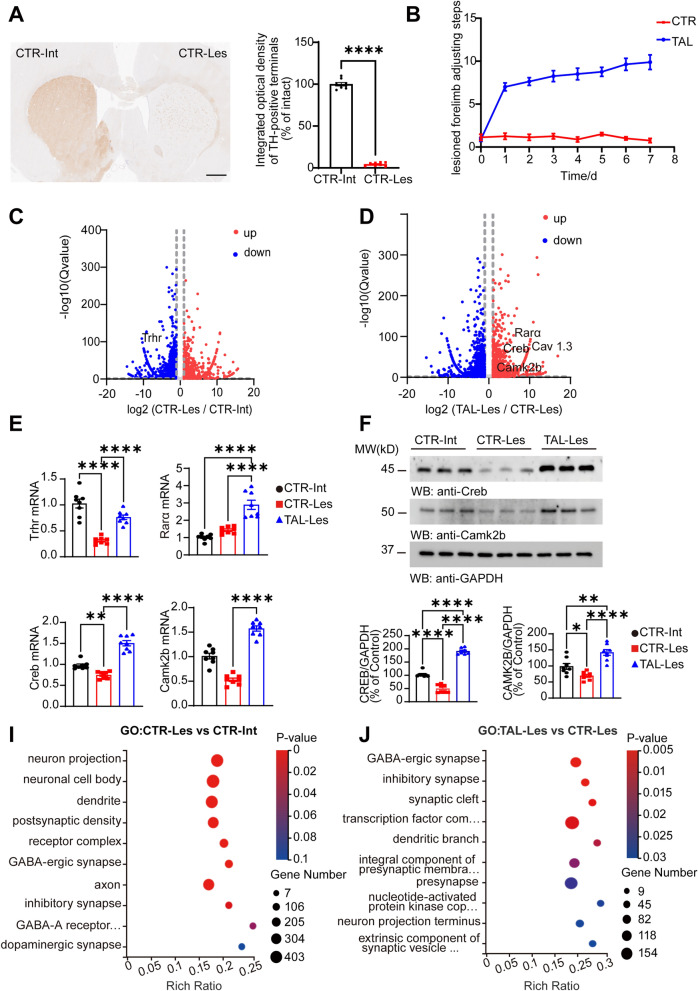
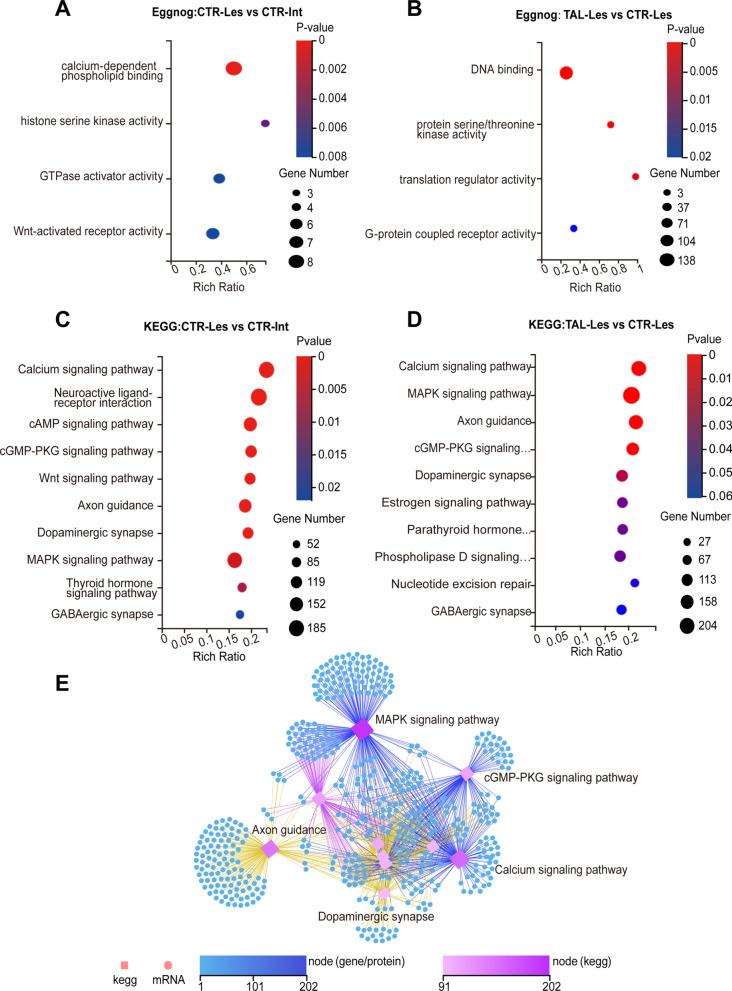
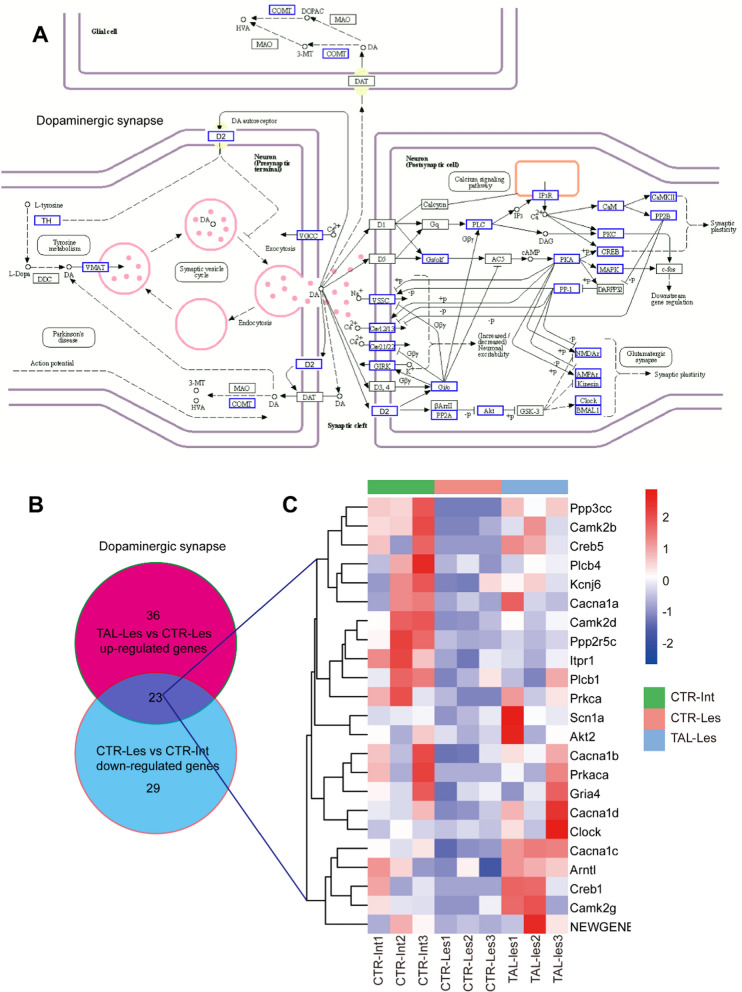
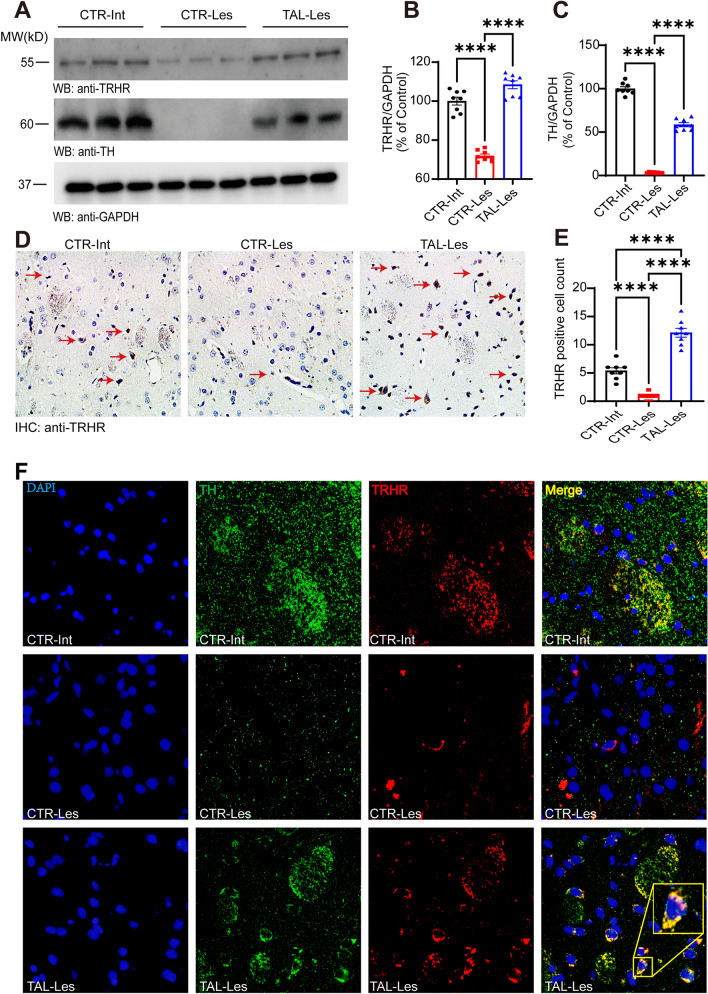
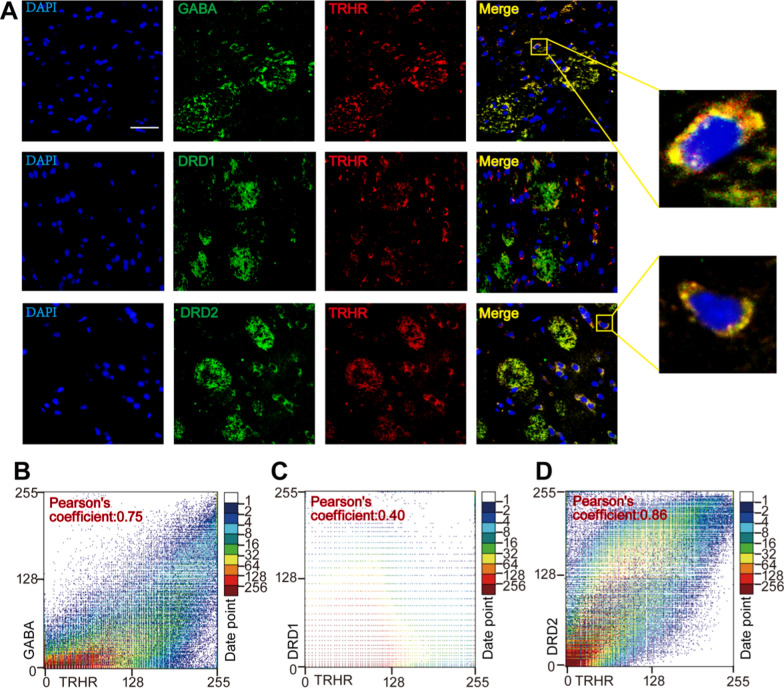
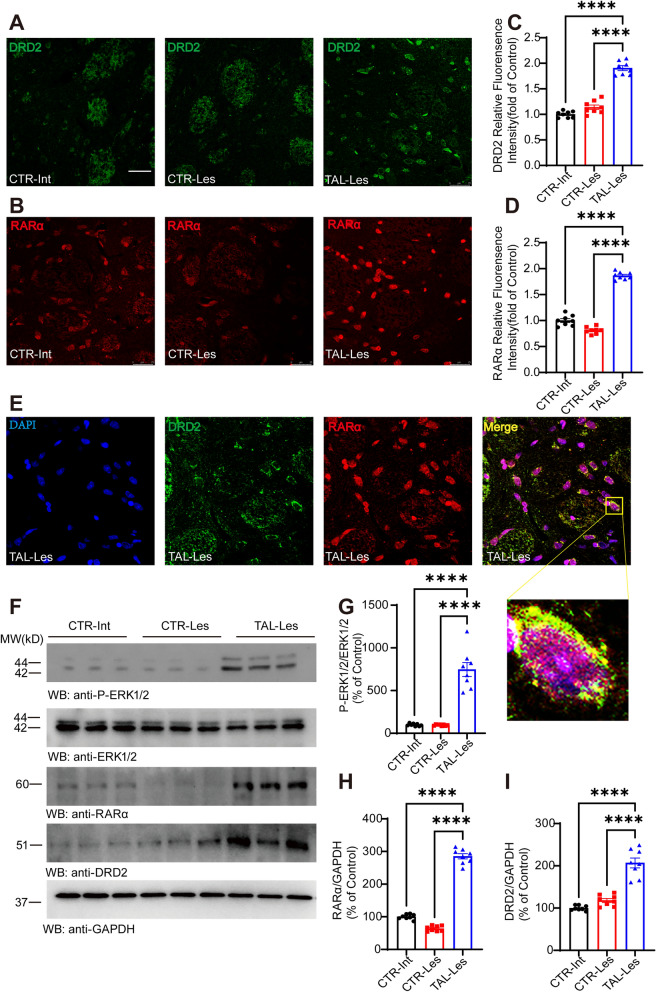
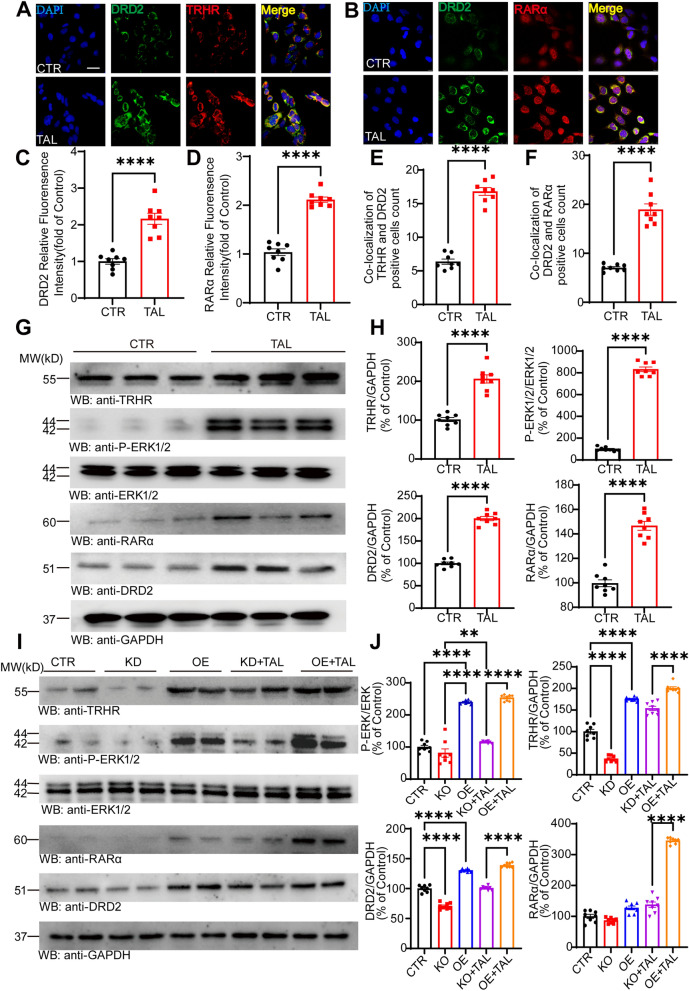
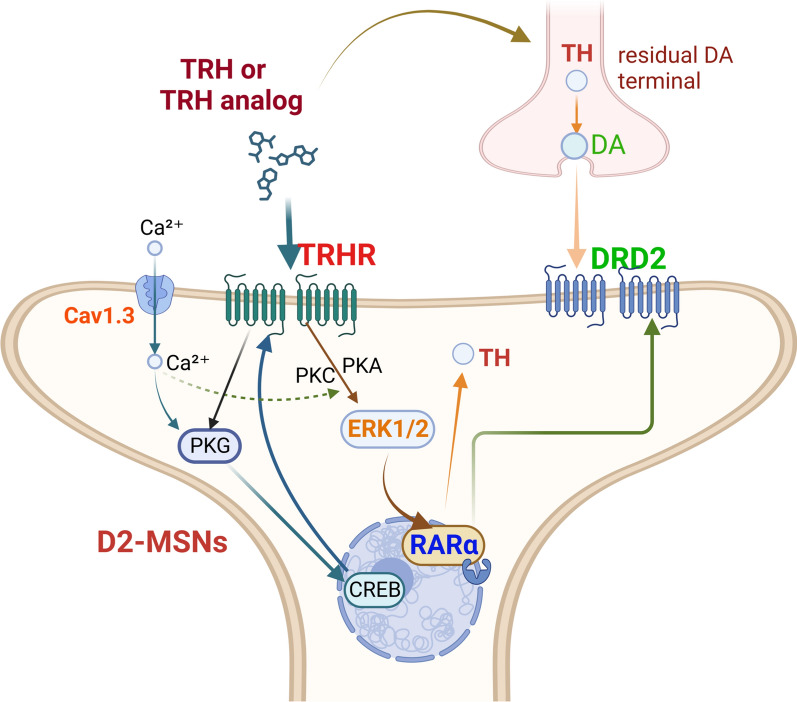
Taltirelin, an orally effective thyrotropin-releasing hormone analog, significantly improves motor impairments in rat models of Parkinson's disease (PD) and enhances dopamine release within the striatum. However, the underlying mechanism remains unclear. In this study, a variety of in vivo and in vitro methods, including transcriptomic analysis, were employed to elucidate the effects of Taltirelin on cellular composition and signaling pathways in the striatum of hemi-PD rats. We demonstrated that Taltirelin upregulates the expression of TRHR on striatal GABAergic neurons, which is accompanied by activation of the TRHR-MAPK-RARα-DRD2 pathway. Consequently, Taltirelin induces medium spiny neurons in the striatum to express TH. This discovery provides valuable insights into the potential application of Taltirelin in neurological disorders and offers new directions for drug development.

Keywords: Dopamine receptor D2; Taltirelin; Thyrotropin-releasing hormone receptor; Tyrosine hydroxylase.


Conflict of interest statement

Declarations. Competing interests: The authors declare no competing financial interests.

Figures

Fig. 1
Fig. 1
Transcriptomic analysis of the striatal in Hemi-PD Rats following TAL treatment. A Immunostaining of TH in the striatum of Hemi-PD rats (Scale bar: 1000 μm, N = 8/group, mean ± SEM). Statistical significance: ****P < 0.0001, Student’s t-test. B Adjusting step tests of Hemi-PD Rats treated with saline or TAL (5 mg/kg, i.p.). N = 8. C, D Volcano plots of DEGs. Comparison of gene expression changes between the lesioned side of the control group (CTR-Les) and the intact side of the control group (CTR-Int), the lesioned side of the TAL-treated group (TAL-Les) and the CTR-Les group. Blue dots represent downregulated DEGs, and red dots represent upregulated DEGs (q-value < 0.05, |log2FC |≥ 2). E RT-PCR analysis shows the expression levels of trhr, rarα, creb and camk2b mRNA in the striatum (N = 8/group, mean ± SEM). Statistical significance: **P < 0.01, ****P < 0.0001, one-way ANOVA followed by Tukey's test. F Western blot analysis of CREB and CAMK2B levels in the striatum of different groups of rats (N = 8/group; error bars represent SEM). Statistical significance: *P < 0.05, **P < 0.01, ****P < 0.0001, one-way ANOVA followed by Tukey's test. I, J Gene Ontology (GO) enrichment analysis of transcripts. The X-axis represents the enrichment ratio, the Y-axis represents the GO cellular component term, and the size of the bubbles indicates the number of DEGs annotated to a particular term. The color represents the P-value of enrichment, with a smaller P-value indicated by a redder color
Fig. 2
Fig. 2
TAL modulates intracellular signaling pathways. A, B Functional annotation of the striatal transcriptome using Eggnog. C, D KEGG enrichment analysis of transcripts. DEGs are divided into 10 KEGG pathway terms along the y-axis. E Ranking of KEGG pathways based on the number of genes associated with selected genes. The top 10 pathways with the highest gene count are displayed. Squares represent KEGG pathways, circles represent mRNAs, and the color and size indicate the number of transcripts connected to each node
Fig. 3
Fig. 3
TAL modulates the dopaminergic synapse signaling pathway. A KEGG Pathway Map (04728). In the classical dopaminergic synapse signaling pathway, the differential signals induced by TAL are highlighted in blue. B The number of common genes in opposite trends between TAL-Les vs. CTR-Les and CTR-Les vs. CTR-Int (q-value < 0.05, |log2FC|≥ 2). C The shared genes resulting from the comparison depicted in (B). In the heatmap, the red and blue colors correspond to high-expression and low expression levels, respectively
Fig. 4
Fig. 4
TAL regulates the expression of both TRHR and TH in the striatum. A, B, C Western blot analysis of TRHR and TH levels in the striatum of different groups of rats.Differential analysis of TRHR B and TH C in the striatum of different groups (N = 8/group; error bars represent SEM). Statistical significance: ****P < 0.0001, one-way ANOVA followed by Tukey's test. D Immunohistochemical images of TRHR in the striatum of different groups of rats (CTR-Int, CTR-Les, TAL-Les). Scale bar: 200 µm. E Differential analysis of TRHR-positive cell counts in the striatum of different groups (N = 8/group; error bars represent SEM). Statistical significance: ****P < 0.0001, one-way ANOVA followed by Tukey's test. F Immunofluorescence staining and colocalization of TH and TRHR in the striatum of various animal groups. Scale bar: 20 µm
Fig. 5
Fig. 5
TRHR and TH mainly colocalize GABAergic neurons. A Immunofluorescence colocalization of TRHR with DRD1 and DRD2 in the Lesioned striatum of TAL-treated Hemi-PD rats. Scale bar: 20 μm. B, C, D Scatter plots and Pearson correlation coefficients of colocalization
Fig. 6
Fig. 6
TAL enhances the expression of RARα and DRD2 in the striatum. A, B Immunofluorescence staining of TRHR and RARα in the striatum of different groups of rats (CTR-Int, CTR-Les, TAL-Les). Scale bar: 25 μm. C, D Analysis of relative fluorescence intensity (N = 8/group; error bars represent SEM). Statistical significance: ****P < 0.0001, one-way ANOVA followed by Tukey's test. E Immunofluorescence colocalization of DRD2 and RARα in the striatum. F Western blotting analysis of P-ERK1/2, ERK1/2, RARα, and DRD2 levels in the striatum of different groups of rats. G, H, I Differential analysis of P-ERK1/2, RARα, and DRD2 in the striatum of different groups (N = 8/group; error bars represent SEM). Statistical significance: ****P < 0.0001, one-way ANOVA followed by Tukey's test
Fig. 7
Fig. 7
TAL enhances the expression of TRHR and DRD2 in SH-SY5Y cells. A, B Immunofluorescence colocalization of DRD2 with TRHR and RARα in SH-SHY5Y cells of the CTR and TAL groups. Scale bar: 25 μm. C, D Analysis of the relative fluorescence density of DRD2 and RARα in cells from the CTR and TAL groups (N = 8/group; error bars represent SEM). Statistical significance: ****P < 0.0001, Student’s t-test. E, F Analysis of the count of colocalized positive cells of DRD2 with TRHR and RARα in different groups of cells (N = 8/group; error bars represent SEM). Statistical significance: ****P < 0.0001, Student’s t-testt. G, H Western blotting analysis of TRHR, P-ERK1/2, ERK1/2, RARα, and DRD2 levels in the SH-SY5Y of CTR and TAL group (N = 8/group; error bars represent SEM). Statistical significance: ****P < 0.0001, Student’s t-test. I, J After knockdown and overexpression of TRHR, Western blotting analysis of TRHR, P-ERK1/2, ERK1/2, RARα, and DRD2 levels in each group of SH-SY5Y cells (N = 8/group; error bars represent SEM). Statistical significance: **P < 0.01, ****P < 0.0001, one-way ANOVA followed by Tukey's test
Fig. 8
Fig. 8
The mechanism of TAL in PD models. Our results demonstrated that TAL administration in hemi-PD rats led to increased expression of TH in the remaining dopaminergic axonal terminals within the striatum. Furthermore, TAL binds to TRHR, which is primarily expressed on GABAergic neurons such as D2-MSNs. Upon TRHR activation, various potential signaling pathways are initiated, leading to increased CREB and p-ERK1/2 activity. This activation further promotes the upregulation of TRHR and RARα expression. RARα, in turn, regulates DRD2 expression. As a result, TAL induces MSNs to express TH

Similar articles

References

    1. Daimon CM, Chirdon P, Maudsley S, Martin B. The role of thyrotropin releasing hormone in aging and neurodegenerative diseases. Am J Alzheimers Dis. 2013. 10.7726/ajad.2013.1003. - PMC - PubMed
    1. Shimizu T, Tsutsumi R, Shimizu K, Tominaga N, Nagai M, Ugawa Y, et al. Differential effects of thyrotropin releasing hormone (TRH) on motor execution and motor adaptation process in patients with spinocerebellar degeneration. J Neurol Sci. 2020;415: 116927. - PubMed
    1. Kelly JA, Boyle NT, Cole N, Slator GR, Colivicchi MA, Stefanini C, et al. First-in-class thyrotropin-releasing hormone (TRH)-based compound binds to a pharmacologically distinct TRH receptor subtype in human brain and is effective in neurodegenerative models. Neuropharmacology. 2015;89:193–203. - PubMed
    1. Duval F, Mokrani M-C, Erb A, Danila V, Lopera FG, Foucher JR, et al. Thyroid axis activity and dopamine function in depression. Psychoneuroendocrinology. 2021;128: 105219. - PubMed
    1. Alvarez-Salas E, García-Luna C, de Gortari P. New efforts to demonstrate the successful use of TRH as a therapeutic agent. Int J Mol Sci. 2023;24:11047. - PMC - PubMed

MeSH terms

Substances

LinkOut - more resources