. 2024 Dec 30;17(1):547.
doi: 10.1186/s13071-024-06599-6.

Identification of serum biomarkers for cystic echinococcosis in sheep through untargeted metabolomic analysis using LC-MS/MS technology

Affiliations

Identification of serum biomarkers for cystic echinococcosis in sheep through untargeted metabolomic analysis using LC-MS/MS technology

Xiao-Xia Wu et al. Parasit Vectors. .

Abstract

Background: Echinococcosis is a zoonotic disease caused by an Echinococcus tapeworm infection. While diagnostic methods for humans often rely on ultrasound imaging and immunodiagnostic techniques, diagnosis in intermediate hosts typically has no widely used diagnostic markers, hampering disease control efforts.

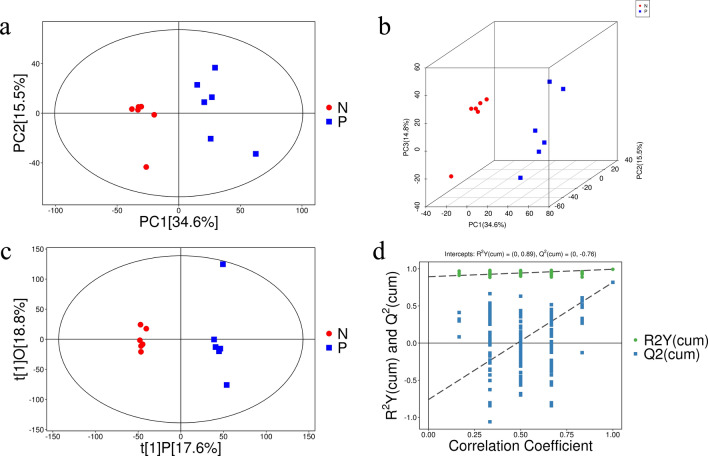
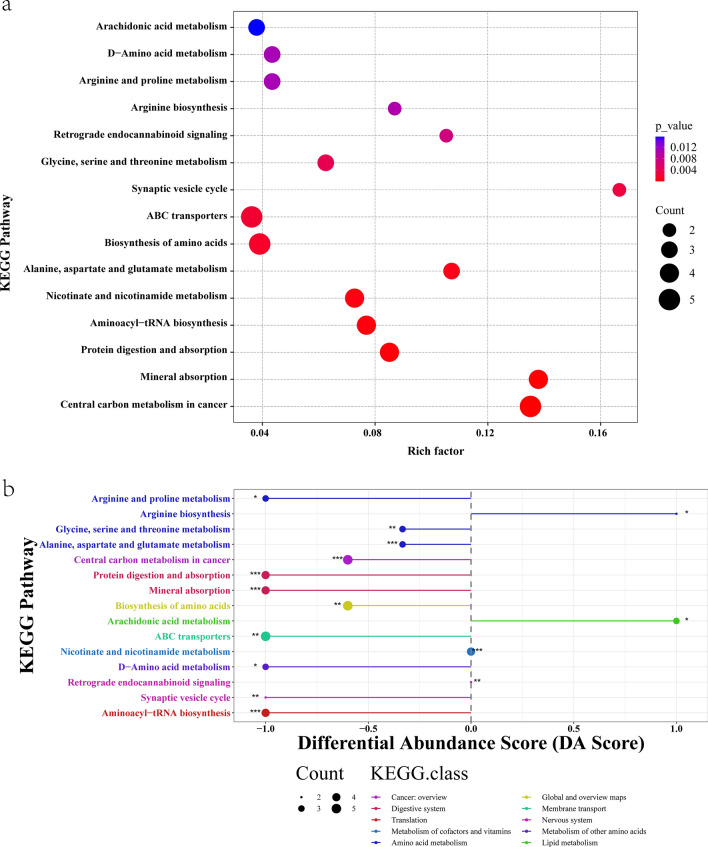
Methods: The differences in serum metabolites of sheep infected with Echinococcus granulosus and a control group were analyzed using ultrahigh-performance liquid chromatography (UHPLC) separation with tandem mass spectrometry (MS/MS) detection. This provided a basis for the early diagnosis and pathogenetic study of cystic echinococcosis (CE) in intermediate hosts at the metabolomics level. Orthogonal projections to latent structures-discriminant analysis (OPLS-DA) were used to analyze different metabolites in the serum of the two groups. The differentially abundant metabolites were entered into the MetaboAnalyst 5.0 online analysis website for processing, and the top-15-ranked metabolic pathways were set to produce bubble plots and differential abundance score plots, with a significant difference of P < 0.05 and a false discovery rate (FDR) < 0.1 as the screening conditions.

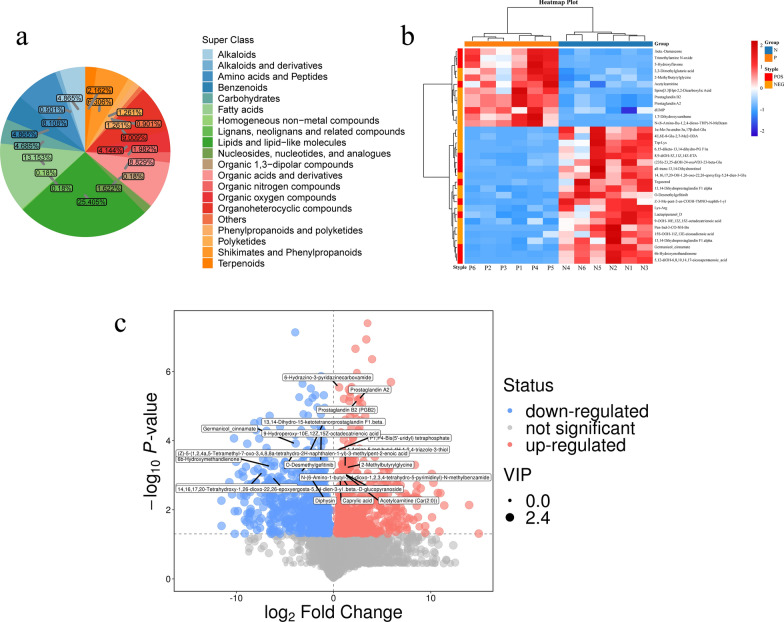
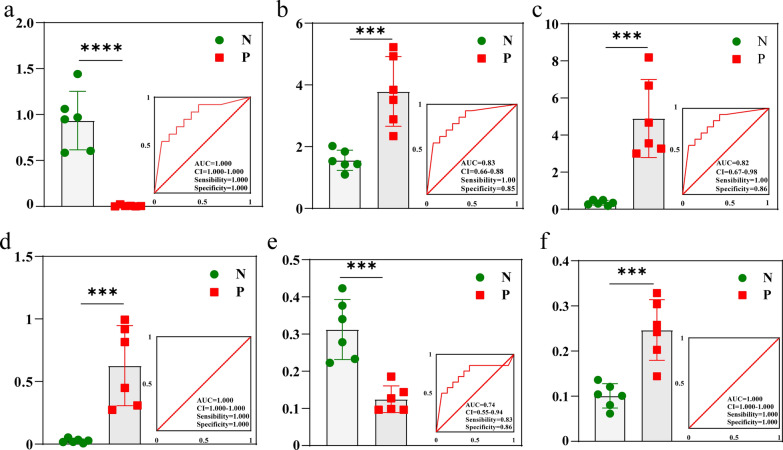
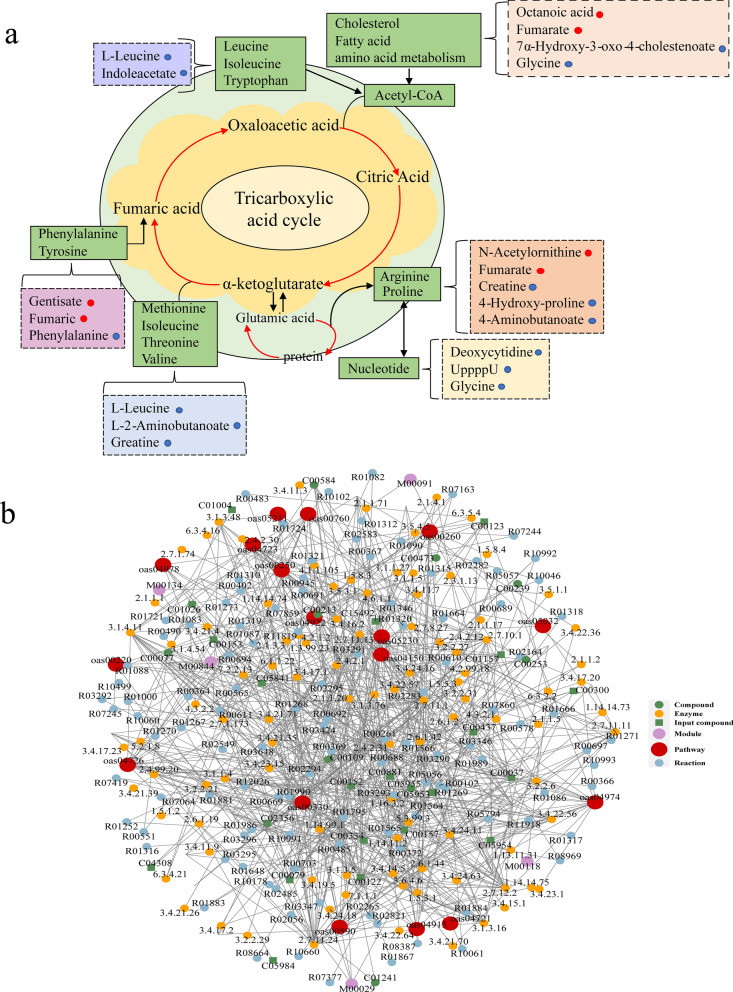
Results: Data analyses of serum samples from both groups identified a total of 1905 significantly different metabolites, where 841 metabolites were upregulated and 1064 metabolites were downregulated. Twelve metabolites were significantly upregulated and 21 metabolites were significantly downregulated in the experimental group. Then, the 1,7-dihydroxyxanthone, 2-methylbutyrylglycine, 3,3-dimethylglutaric acid, 5,12-dihydroxy-6,8,10,14,17-eicosapentaenoic acid, 9-hydroperoxy-10E,12Z,15Z-octadecatrienoic acid, and trimethylamine N-oxide 6 metabolites were selected as diagnostically valuable candidate biomarkers (area under the curve [AUC] > 0.7). These differential metabolites are involved in various metabolic pathways, including amino acid metabolites (arginine, L-isoleucine, L-valine) and fatty acid metabolism (fenugreek, arachidonic acid, linolenic acid). Compared with the control group, sheep in the CE group had increased serum levels of fenugreek acid, while all other metabolites such as glycine showed significantly reduced serum levels (P < 0.01).

Conclusions: Through non-targeted metabolomic analysis of the serum of CE-infected sheep, differential metabolites closely related to amino acid metabolism and the fatty acid metabolism pathway were identified. These differentially abundant metabolites can serve as biomarkers for diagnosing CE infection in intermediate sheep hosts.

Keywords: Echinococcus granulosus; Biomarkers; LC–MS/MS; Non-targeted metabolomics; Serum.


Conflict of interest statement

Declarations. Ethics approval and consent to participate: This study has been approved by the Institutional Animal Care and Use Committee of Jilin University, China. The approval was granted on September 20, 2022, and this study was registered under the number KT202103004. The current study complies with all relevant laws and international ethics guidelines. Consent for publication: Not applicable. Competing interests: The authors declare no competing interests.

Figures

Fig. 1
Fig. 1
Pathological sections of hepatic cystic echinococcosis. Histopathological appearance: Hydatid cyst with protoscolex within the liver, demonstrated by Masson staining. Histopathological appearance: Hydatid cyst with protoscolex within the liver, visualized using hematoxylin–eosin (H&E) staining
Fig. 2
Fig. 2
PCA diagram of sheep and OPLS-DA model 200 response ranking test. a PCA score plots of CE group and control group. b Three-dimensional (3D) PCA score plots of CE group and control group. The blue scatter points represent the CE model group, and the red represent the healthy control sample. The horizontal axis PC1 and the vertical axis PC2 represent the first- and second-ranked principal component scores, respectively. c Score scatter plot of OPLS-DA model for CE group and control group. The horizontal coordinate t[1]P represents the predicted principal component score of the first principal component, showing differences between sample groups; the ordinate t[1]O represents the orthogonal principal component score, showing differences within sample groups. d The OPLS-DA permutation plot of the serum for sheep infected with CE and control groups in intercept mode with R2Y(cum) = (0, 0.89), Q2(cum) = (0, −0.76), and correlation coefficient (0.25–0.9)
Fig. 3
Fig. 3
Multivariate statistical analysis of differential metabolites. a Donut plot of metabolite classification and proportions. Different color blocks represent different taxonomic categories, and percentages represent the percentage of metabolites belonging to that type in the total number of metabolites identified. b Heatmap of differentially abundant metabolites between the control and CE groups. The horizontal axis represents the names of the serum samples from the CE group and healthy control group, and the vertical axis represents the different metabolites. Red indicates that the substance is highly expressed in the group where it is located, blue indicates that the substance is low in the group where it is located, and the depth indicates the degree of influence. c Volcano map of differentially abundant metabolite screening results. Significantly upregulated metabolites are shown in red, significantly downregulated metabolites are shown in blue, and non-significantly differentiated metabolites are shown in gray
Fig. 4
Fig. 4
ROC analysis of potential biomarkers and determination of the predictive power of differentially abundant metabolites. a 2-Methylbutyrylglycine, b 3,3-dimethylglutaric acid, c 1,7-dihydroxyxanthone, d trimethylamine N-oxide, e 9-hydroperoxy-10E,12Z,15Z-octadecatrienoic acid, f 5,12-dihydroxy-6,8,10,14,17-eicosapentaenoic acid. AUC values closer to 1 indicate improved diagnostic effectiveness, while an AUC of 0.5 signifies complete ineffectiveness and lack of diagnostic value
Fig. 5
Fig. 5
Bubble diagram of metabolic pathway enrichment of differentially abundant metabolites and differential abundance (DA) scores of metabolic pathways associated with different metabolites. a The vertical axis is the name of the metabolic pathway, and the horizontal axis is the enrichment factor. The greater the enrichment factor, the greater the enrichment degree. The larger the dot diameter, the greater the number of metabolites, and the P-value is the value of the hypergeometric test. b The horizontal coordinate represents the DA score, and the vertical coordinate represents the KEGG metabolic pathway name. The DA score reflects the overall change in all metabolites in the metabolic pathway; a score of 1 indicates a trend toward upregulation of the expression of all the annotated differentially abundant metabolites in the pathway, a score of −1 indicates a trend toward downregulation of the expression of all the annotated differentially abundant metabolites in the pathway, and the length of the line segment represents the absolute value of the DA score. The size of the dots indicates the number of annotated differentially abundant metabolites in the pathway, and larger dots indicate more differentially abundant metabolites in the pathway. The larger the dots, the greater the number of different metabolites in the pathway. The longer the distribution of the dots on the right side of the center axis, the more upregulated the overall expression of the pathway; the longer the distribution of the dots on the left side of the center axis, the more downregulated the overall expression of the pathway
Fig. 6
Fig. 6
Correlation analysis of differentially abundant metabolites and network analysis for the CE and control groups. a Visual representation of metabolite abundance utilizes a color-coded system, where metabolites are depicted as dots. Bright red dots signify significantly upregulated metabolites, while bright blue dots indicate significantly downregulated metabolites. Additionally, metabolic pathways are outlined by green boxes, and directional flow of metabolic reactions is illustrated by connecting lines. b Red dots represent a metabolic pathway, yellow dots represent information on a substance-associated regulatory enzyme, green dots illustrate a background substance for a metabolic pathway, purple dots represent information on the molecular modules of a class of substances, blue dots show chemical interactions of a substance, and green squares represent differential substances obtained from this comparison

Similar articles

References

    1. Borhani M, Mohammadi MA, Entezami M, Baneshi MR, Nasibi S, Prada JM, et al. Reinfection of farm dogs following praziquantel treatment in an endemic region of cystic echinococcosis in southeastern Iran. PLoS Negl Trop Dis. 2024. 10.1371/journal.pntd.0011939. - PMC - PubMed
    1. Casulli A, Abela-Ridder B, Petrone D, Fabiani M, Bobić B, Carmena D, et al. Unveiling the incidences and trends of the neglected zoonosis cystic echinococcosis in Europe: a systematic review from the MEmE project. Lancet Infect Dis. 2023. 10.1016/s1473-3099(22)00638-7. - PubMed
    1. Borhani M, Fathi S, Darabi E, Jalousian F, Simsek S, Ahmed H, et al. Echinococcoses in Iran, Turkey, and Pakistan: old diseases in the new millennium. Clin Microbiol Rev. 2021. 10.1128/cmr.00290-20. - PMC - PubMed
    1. Thompson RC. Biology and systematics of echinococcus. Adv Parasitol. 2017. 10.1016/bs.apar.2016.07.001. - PubMed
    1. Torgerson PR, Robertson LJ, Enemark HL, Foehr J, van der Giessen JWB, Kapel CMO, et al. Source attribution of human echinococcosis: a systematic review and meta-analysis. PLoS Negl Trop Dis. 2020. 10.1371/journal.pntd.0008382. - PMC - PubMed

LinkOut - more resources