. 2025 Feb 5;33(2):615-630.
doi: 10.1016/j.ymthe.2024.12.037. Epub 2024 Dec 30.

Functional screening identifies miRNAs with a novel function inhibiting vascular smooth muscle cell proliferation

Affiliations

Functional screening identifies miRNAs with a novel function inhibiting vascular smooth muscle cell proliferation

Julie Rodor et al. Mol Ther. .

Abstract

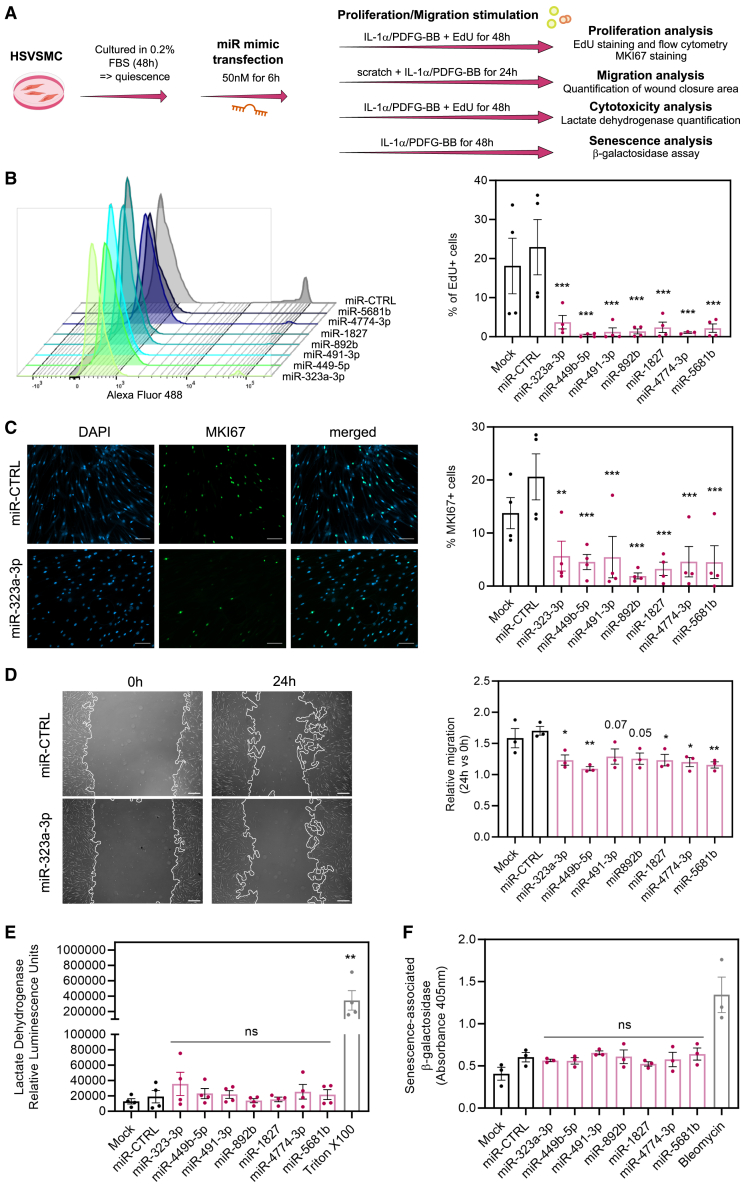
Proliferation of vascular smooth muscle cells (vSMCs) is a crucial contributor to pathological vascular remodeling. MicroRNAs (miRNAs) are powerful gene regulators and attractive therapeutic agents. Here, we aimed to systematically identify and characterize miRNAs with therapeutic potential in targeting vSMC proliferation. Using high-throughput screening, we assessed the impact of 2,042 human miRNA mimics on vSMC proliferation and identified seven miRNAs with novel vSMC anti-proliferative function: miR-323a-3p, miR-449b-5p, miR-491-3p, miR-892b, miR-1827, miR-4774-3p, and miR-5681b. miRNA-mimic treatment affects proliferation of vSMCs from different vascular beds. Focusing on vein graft failure, where miRNA-based therapeutics can be applied to the graft ex vivo, we showed that these miRNAs reduced human saphenous vein smooth muscle cell (HSVSMC) proliferation without toxic effect. HSVSMC transcriptomics revealed a distinct set of targets for each miRNA, leading to the common downregulation of a cell-cycle gene network for all miRNAs. For miR-449b-5p, we showed that its candidate target, CCND1, contributes to HSVSMC proliferation. In contrast to HSVSMCs, miRNA overexpression in endothelial cells led to a limited response in terms of proliferation and transcriptomics. In an ex vivo vein organ model, overexpression of miR-323a-3p and miR-449b-5p reduced medial proliferation. Collectively, the results of our study show the therapeutic potential of seven miRNAs to target pathological vascular remodeling.

Keywords: miRNA therapeutics; microRNA; migration; proliferation; vascular smooth muscle cell; vein graft failure.


Conflict of interest statement

Declaration of interests The authors declare the following financial interests/personal relationships that may be considered potential competing interests: A.H.B., M.G., and S.Z. are named inventors on a patent application related to this work (PCT/GB2023/052170).

Figures

None
Graphical abstract
Figure 1
Figure 1
High-throughput miRNA screen identifies novel miRNAs regulating vSMC proliferation (A) Schematic of high-throughput miRNA screen design in vSMCs. (B) Scatterplot of viability (expressed as median Z score of Hoechst 33342+ cells) and proliferation (expressed as log2 fold change of %EdU+ cells versus miR-CTRL) changes for each mimic-mediated miRNA overexpression (n = 1). (C) Representative images of HPASMCs stained with Hoechst 33342 (blue) and EdU (green) following treatment with miR-323a-3p mimic and miR-CTRL. Scale bars, 200 μm. (D–F) Percentage of EdU+ cells based on high-throughput microscopy imaging quantification in (D) HPASMCs (n = 4), (E) HCASMCs (n = 3), and (F) HUVSMCs (n = 3) transfected with seven candidate miRNA mimics or miR-CTRL, as well as the “mock” transfection control (lipofectamine-treated cells). Statistical analyses were performed using Iman and Conover non-parametric ranking followed by a repeated-measures ANOVA, and the p value was calculated for the comparison between miRNA-mimic treatment and miR-CTRL using Dunnett’s test for multiple comparisons. On the graphs, error bars correspond to standard error of the mean and ∗p < 0.05, ∗∗p < 0.01, and ∗∗∗p < 0.001, and ns, non-significant. n corresponds to distinct biological replicates.
Figure 2
Figure 2
The overexpression of seven candidate miRNAs affects HSVSMC proliferation and migration in vitro (A) Schematic of the experimental design for assessing the effect of miRNA overexpression on IL-1α/PDGF-BB-treated HSVSMCs. (B) Flow cytometric quantification of EdU incorporation in IL-1α/PDGF-BB-stimulated HSVSMCs transfected with the seven miRNA mimics versus miR-CTRL and lipofectamine-treated cells (mock). On the left, representative EdU plot, and on the right, bar graph quantification (n = 4, except n = 3 for miR-4774-3p). Statistical analyses were done using a mixed-effects model. (C) Percentage of MKI67-positive cells in IL-1α/PDGF-BB-stimulated HSVSMCs transfected with the seven miRNA mimics or miR-CTRL, as well as the mock transfection control (n = 4). On the left, representative images (DAPI, EdU, and combined) for miR-CTRL and miR-323a-3p (scale bars, 100 μm). On the right, bar graph quantification. Statistical analyses were done using Iman-Conover non-parametric ranking followed by repeated-measures ANOVA. (D) Wound healing assay of IL-1α/PDGF-BB-stimulated HSVSMCs transfected with the seven miRNA mimics or miR-CTRL, as well as the mock transfection control. On the left, representative images from the scratch assay at 0 and 24 h for miR-CTRL and miR-323a-3p. Scale bars, 500 μm. On the right, quantification of wound healing (24 h area versus 0 h area) via the ImageJ MRI wound healing tool (n = 3). Statistical analyses were done using Iman-Conover non-parametric ranking followed by repeated-measures ANOVA. (E) Lactate dehydrogenase activity in IL-1α/PDGF-BB-stimulated HSVSMCs transfected with the seven miRNA mimics or miR-CTRL, as well as the mock transfection control (n = 4). HSVSMCs treated with Triton X-100 were used as a positive control for cytotoxicity induction. Statistical analyses were done using Iman-Conover non-parametric ranking followed by repeated-measures ANOVA. (F) Quantification of senescence-associated (SA) β-galactosidase activity (absorbance measured at 405 nm) in IL-1α/PDGF-BB-stimulated HSVSMCs transfected with the seven miRNA mimics or miR-CTRL, as well as the mock transfection control (n = 3). Bleomycin (1 μg/mL) was used as a positive control for senescence induction. Statistical analyses were done using Iman-Conover non-parametric ranking followed by repeated-measures ANOVA. p values for the comparison between miRNA-mimic treatment and miR-CTRL treatment obtained after Dunnett’s test for multiple corrections are included on the graphs: ∗p < 0.05, ∗∗p < 0.01, ∗∗∗p < 0.001, and ns, non-significant. Error bars correspond to standard error of the mean. n corresponds to distinct biological replicates.
Figure 3
Figure 3
Transcriptomic changes upon overexpression of the seven candidate miRNAs in HSVSMCs (A) Principal component analysis plot of HSVSMC RNA-seq after removal of batch effect (removal of patient effect). (B) Volcano plot showing the fold change and p value for all expressed genes for the comparison of miR-323a-3p mimic versus miR-CTRL (based on DESeq2 analysis with p values obtained using the Wald test followed by the Benjamini and Hochberg method for multiple correction). Significant changes were identified using a threshold of absolute fold change ≥2 and adjusted p < 0.01. Cell-cycle genes MKI67, TOP2A, BUB1B, AURKB, and CENPF are highlighted. (C) Top 10 enriched GO terms (biological process) for genes differentially expressed upon miR-323a-3p overexpression based on gene set enrichment analysis. (D) Number of significantly differentially expressed genes for each miRNA overexpression versus miR-CTRL based on an absolute fold change ≥2, adjusted p = 0.01, and minimum expression of 2 FPKM in at least two of the miR-CTRL/miR-mimic samples. The number of genes commonly regulated by all miRNAs is indicated below. (E) Top 10 enriched GO terms (biological process) for the 125 genes commonly downregulated by all seven miRNAs.
Figure 4
Figure 4
The seven candidate miRNAs regulate distinct targets in HSVSMCs (A) Approach to identify miRNA targets based on downregulation in RNA-seq upon mimic treatment and a combination of prediction tools. (B) Number of downregulated genes, predicted targets, and candidate targets for each miRNA. (C) Heatmap (expression displayed as column Z score of log2(FPKM + 1)) of all candidate targets for the seven miRNAs in the HSVSMC RNA-seq with a separation between unique and shared targets. (D) Validation of candidate target IGF2BP3 (n = 4–5), GJA1 (n = 5), and CCND1 (n = 5) expression changes upon miRNA overexpression by RT-qPCR. Statistical analyses were done using a mixed-effects model for IGF2BP3 and a repeated-measures ANOVA for GJA1 and CCND1. p values for the comparison between miRNA-mimic treatment and miR-CTRL treatment obtained after Dunnett’s test for multiple corrections are included on the graphs: ∗p < 0.05, ∗∗p < 0.01, ∗∗∗p < 0.001, and ns, non-significant. (E) Percentage of EdU-positive HSVSMCs upon siRNA-mediated candidate target knockdown (n = 3–5). Statistical analyses were done using a mixed-effects model. p values for the comparison between each target knockdown treatment and siRNA control (siCTRL) treatment obtained after Dunnett’s test for multiple corrections are included on the graph: ∗∗∗p < 0.001 and ns, non-significant. Error bars correspond to standard error of the mean. n corresponds to distinct biological replicates.
Figure 5
Figure 5
Proliferation and transcriptomic changes upon overexpression of the seven candidate miRNAs in HSVECs (A) Schematic of experimental design for assessing the effect of miRNA overexpression on HSVEC proliferation, cytotoxicity, and transcriptome. (B) Flow cytometric quantification of EdU incorporation in HSVECs transfected with the seven miRNA mimics versus miR-CTRL and lipofectamine-treated cells (mock) (n = 3). Statistical analyses were done using Iman-Conover non-parametric ranking followed by repeated-measures ANOVA. The p value was calculated for the comparison between miRNA-mimic treatment and miR-CTRL using Dunnett’s test for multiple comparisons. On the graph, ∗p < 0.05 and ns, non-significant. (C) Lactate dehydrogenase activity in HSVECs transfected with the seven miRNA mimics or miR-CTRL, as well as the mock transfection control (n = 3). Statistical analyses were done using Iman-Conover non-parametric ranking followed by repeated-measures ANOVA. (D) Number of significantly differentially expressed genes for each miRNA overexpression versus miR-CTRL based on RNA-seq in HSVECs. The number of genes commonly regulated by all miRNAs is indicated below. Hatched areas show the proportion of genes also regulated in HSVSMCs. (E) HSVEC expression profile (displayed as row Z score) of the cell-cycle genes commonly downregulated by all seven miRNAs in HSVSMCs. Ninety-six of the 102 genes were detected in HSVECs. Error bars on the graphs correspond to standard error of the mean. n corresponds to distinct biological replicates.
Figure 6
Figure 6
Reduced medial proliferation in human saphenous vein organ culture upon miR-323a-3p and miR-449b-5p overexpression (A) Schematic of the miRNA-mimic treatment of the human saphenous vein. The remodeling is induced by mechanical stress followed by organ culture for 7 days. (B) Percentage of EdU-positive cells in the medial layer of human saphenous vein upon miRNA-mimic treatment after 7 days (n = 4). Statistical analyses were done using Iman-Conover non-parametric ranking followed by repeated-measures ANOVA. The p value was calculated for the comparison between miRNA-mimic treatment and miR-CTRL using Dunnett’s test for multiple comparisons. On the graph, error bars correspond to standard error of the mean and ∗∗p < 0.01, ∗∗∗p < 0.001, and ns, non-significant. n correspond to distinct biological replicates. (C) Representative images of EdU, MYH11, and DAPI staining after miR-CTRL or miRNA-mimic treatment in the vein organ culture. Scale bars, 100 μm.

References

    1. Lyle A.N., Taylor W.R. The pathophysiological basis of vascular disease. Lab. Invest. 2019;99:284–289. doi: 10.1038/s41374-019-0192-2. - DOI - PubMed
    1. Gaudino M., Antoniades C., Benedetto U., Deb S., Di Franco A., Di Giammarco G., Fremes S., Glineur D., Grau J., He G.-W., et al. Mechanisms, Consequences, and Prevention of Coronary Graft Failure. Circulation. 2017;136:1749–1764. doi: 10.1161/circulationaha.117.027597. - DOI - PubMed
    1. Bacakova L., Travnickova M., Filova E., Matějka R., Stepanovska J., Musilkova J., Zarubova J., Molitor M. In: Muscle Cell and Tissue. Sakuma K., editor. InTech; 2018. The role of vascular smooth muscle cells in the physiology and pathophysiology of blood vessels; pp. 229–257. - DOI
    1. Bochaton-Piallat M.L., Bäck M. Novel concepts for the role of smooth muscle cells in vascular disease: towards a new smooth muscle cell classification. Cardiovasc. Res. 2018;114:477–480. doi: 10.1093/cvr/cvy031. - DOI - PubMed
    1. Wang D., Uhrin P., Mocan A., Waltenberger B., Breuss J.M., Tewari D., Mihaly-Bison J., Huminiecki Ł., Starzyński R.R., Tzvetkov N.T., et al. Vascular smooth muscle cell proliferation as a therapeutic target. Part 1: molecular targets and pathways. Biotechnol. Adv. 2018;36:1586–1607. doi: 10.1016/j.biotechadv.2018.04.006. - DOI - PubMed

MeSH terms

LinkOut - more resources