. 2024 Nov 19:11:60-72.
doi: 10.1016/j.ncrna.2024.11.003. eCollection 2025 Apr.

MiR-192-5p targets cell cycle regulation in diabetic kidney disease via cyclin-dependent kinase inhibitor 3

Affiliations

MiR-192-5p targets cell cycle regulation in diabetic kidney disease via cyclin-dependent kinase inhibitor 3

Biswajit Sahoo et al. Noncoding RNA Res. .

Abstract

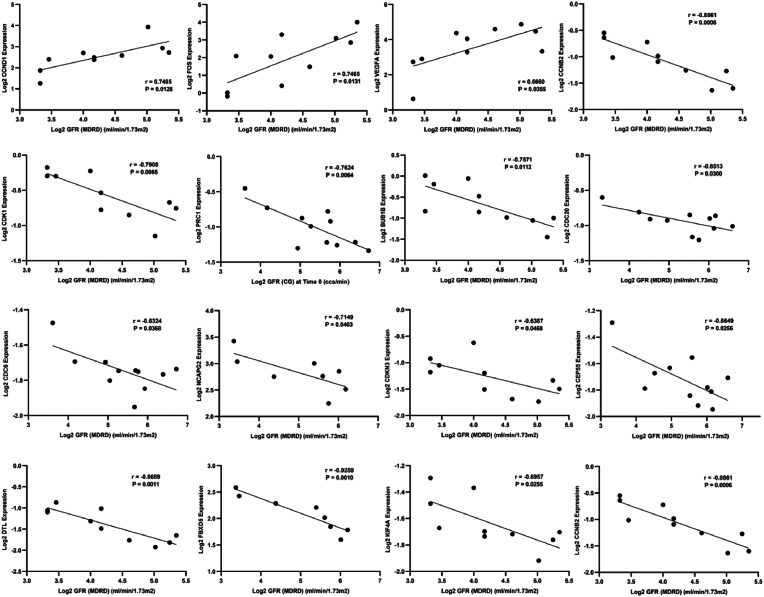
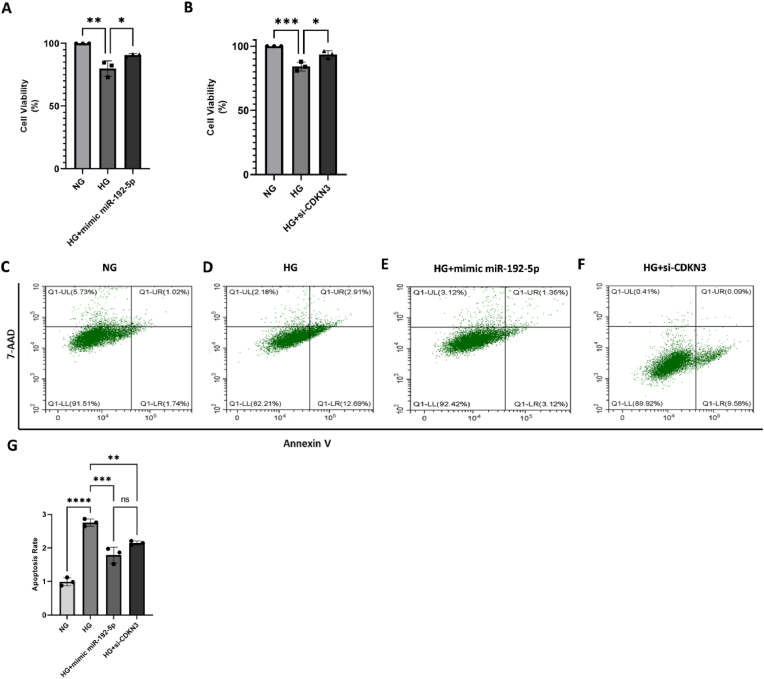
Diabetic kidney disease (DKD), a.k.a diabetic nephropathy, is a leading cause of end-stage renal disease. However, in a fair percentage of patients with type-2 diabetes, renal involvement also occurs due to non-diabetic reasons (non-diabetic kidney disease, NDKD). In this study, we identified miRNA-mRNA regulatory networks specific to human DKD pathogenesis. miRNA profiling of the renal biopsy from cases (DKD, n = 5), disease controls (T2DM with NDKD, n = 6), and non-diabetic, non-CKD controls (patients undergoing nephrectomy for renal cancer, n = 3) revealed 68 DKD-specific miRNA regulation. Sixteen target mRNAs of these DKD-miRNAs were found to have a negative association with the estimated glomerular filtration rate (eGFR) in patients with DKD. The renal gene expression and eGFR data of DKD patients (n = 10-18) in the NephroSeq database were used. Based on these findings, 11 miRNA-mRNA regulatory networks were constructed for human DKD pathogenesis. Of these, in-vitro validation of miR-192-5p- CDKN3 (Cell cycle-dependent kinase inhibitor 3) network was done as miR-192-5p exhibited a maximum number of target genes in the identified DKD regulatory networks, and CDKN3 appeared as a novel target of miR-192-5p in our study. We demonstrated that miR-192-5p overexpression or knockdown of CDKN3 attenuated high glucose-induced apoptosis, fibrotic gene expression, cell hypertrophy, and cell cycle dysregulation and improved viability of proximal tubular cells. Moreover, miR-192-5p overexpression significantly inhibited CDKN3 mRNA and protein expression in proximal tubular cells. Overall, 11 miRNA-mRNA regulatory networks were predicted for human DKD pathogenesis; among these, the association of miR-192-5p- CDKN3 network DKD pathogenesis was confirmed in proximal tubular cell culture.

Keywords: Cell cycle-dependent kinase inhibitor; Diabetic kidney disease; Diabetic nephropathy; High glucose; miRNA-mRNA regulatory networks.


Conflict of interest statement

The authors declare that they have no known competing financial interests or personal relationships that could have appeared to influence the work reported in this paper.

Figures

Fig. 1
Fig. 1
Diabetic kidney disease-specific miRNAs in human kidneys (A) Venn diagram showing the number of miRNAs regulated in renal biopsies in T2DM patients with diabetic kidney disease (DKD, n = 5) or disease control (NDKD, n = 6), relative to non-CKD controls (n = 3). The intersection shows miRNAs specific to DKD biopsies. (B) Heat maps showing hierarchical clustering of 68 miRNAs differentially expressed only in DKD biopsies. Red represents the upregulated miRNA, and blue represents the downregulated miRNA.
Fig. 2
Fig. 2
Regulation of diabetic kidney disease-associated hub genes in human renal biopsies. Scatter dot plot with line at mean with SD showing log2 gene expression of predicted hub genes in the renal biopsies collected from diabetic kidney disease (DKD) patients and non-CKD control biopsies in the NephroSeq database. Each dot in the scatter plot represents individual gene expression data. p∗< 0.05, ∗∗< 0.01 were considered significant by the t-test.
Fig. 3
Fig. 3
Association of target hub genes with renal function impairment. Correlation of hub gene expression in the kidney tissue with estimated GFR (eGFR) in patients with diabetic kidney disease in the Nephroseq database. Pearson correlation coefficient ‘r’ is given with its respective p-value; p < 0.05 was considered significant.
Fig. 4
Fig. 4
miRNA-mRNA regulatory networks specific to diabetic kidney disease. Eleven DN-specific miRNA-mRNA regulatory networks show sixteen selected hub genes out of 9951 target genes. Pink represents miRNAs, blue represents the targeted mRNAs, and the line represents their interaction. The triangle shape and v shape represent upregulation and downregulation, respectively.
Fig. 5
Fig. 5
miR-192–5p expression in human kidney. Bar graph with scatter shows miR-192–5p expression in (A) renal biopsies in patients with DKD compared to non-CKD controls, and (B) proximal tubular cells (HK-2 cells) treated with high glucose (HG) compared to cells exposed in normal glucose (NG) media. Each dot in the scatter plot represents data from an individual patient's sample. The expression was analyzed by qPCR. ∗p < 0.05 by unpaired t-test.
Fig. 6
Fig. 6
MiR-192–5p overexpression attenuated high-glucose induced cell hypertrophy and fibrotic gene expression in HK-2 cells Micrographs showing proximal tubular cell hypertrophy by F-actin staining (green) after treatment with (A) normal glucose (NG) or (B) high glucose (HG) media or (C) Cells transfected with miR-192–5p mimic cultured in HG media (HG + mimic miR-192–5p). (D) The bar with scatter plot shows the quantification of the cell size of HK-2 cells using ImageJ. Bar and scatter plots show (E) TGF –β, (F) Col IV mRNA expression (by qPCR) in the HK-2 cells cultured in normal glucose (NG), high glucose (HG) media, or miR-192–5p mimic transfected cells cultured in HG media (HG + mimic miR-192–5p). Each cell culture experiment was repeated three times. Each dot in the scatter plot represents data from an individual experiment.
Fig. 7
Fig. 7
Overexpression of miR-192–5p prevented high-glucose induced cell cycle dysregulation in HK-2 cells DNA Histograms showing proximal tubular cells are detected in the G0/G1, S, or M/G2 phase of the cell cycle after treatment (A) normal glucose (NG) or (B) high glucose (HG) media or (C) Cells transfected with miR-192–5p mimic cultured in HG media (HG + mimic miR-192–5p) generated through Flow cytometric analysis. The bar and scatter plot shows the qualification of cells detected in the G0/G1 phase (D), S phase (E), or M/G2 phase (F) of the cell cycle. Each cell culture experiment was repeated three times. Each dot in the scatter plot represents data from an individual experiment.∗p < 0.05 by one-way ANOVA followed by multiple comparisons by Tukey's multiple comparisons test.
Fig. 8
Fig. 8
miR-192–5p directly targets CDKN3, resulting in a decrease in its expression levels Bar and scatter plots show CDKN3 mRNA expression (by qPCR) in the proximal tubular cells, (A) transfected with miR-192–5p mimic or control mimic (NC), or (B) cultured in normal glucose (NG), high glucose (HG) media or miR-192–5p mimic transfected cells cultured in HG media (HG + mimic miR-192–5p). (C) Representative immunoblot showing CDKN3 protein expression in the HK-2 cells of the three groups NG, HG, or HG + mimic miR-192–5p. Bar and scatter plots show (D) densitometric summary of the immunoblots (n = 2 p = 0.0022).∗p < 0.05 by t-test. Each dot in the scatter plot represents average data from an individual experiment.∗p < 0.05 one-way ANOVA followed by multiple comparison test by Tukey's multiple comparisons test.
Fig. 9
Fig. 9
CDKN3 knockdown prevented high-glucose induced cell cycle dysregulation in HK-2 cells DNA Histograms showing proximal tubular cells are detected in the G0/G1, S, or M/G2 phase of the cell cycle after treatment (A) normal glucose (NG) or (B) high glucose (HG) media or (C) Cells transfected with si-CDKN3 cultured in HG media (HG + si-CDKN3) generated through Flow cytometric analysis. The bar and scatter plot shows the qualification of cells detected in the G0/G1 phase (D), S phase (E), or M/G2 phase (F) of the cell cycle. Each cell culture experiment was repeated three times. Each dot in the scatter plot represents data from an individual experiment.∗p < 0.05 by one-way ANOVA followed by multiple comparison test by Tukey's multiple comparisons test.
Fig. 10
Fig. 10
miR-192–5p overexpression or CDKN3 knockdown improved cell viability, and attenuated apoptosis in high-glucose exposed HK-2 cells Bar and scatter plots show the effect of (A) miR-192-5poverexpression or (B) si-CDKN3 treatment on cell viability. Figures (C–F) show representative images of scatter plots generated during flow cytometric analysis for apoptosis rate using 7-AAD/Annexin V assay. Cells were cultured in (C) normal glucose media (NG); (D) high glucose media (HG); (E) cells transfected with miR-192–5p mimic in HG media (HG + mimic miR-192–5p) or (F) si-CDKN3 treated cells in HG media (HG + si-CDKN3). (G) number of Annexin-positive cells. Each dot in the scatter plot represents average data from an individual experiment.).∗p < 0.05 by one-way ANOVA followed by multiple comparisons by Tukey's multiple comparisons test.

Similar articles

References

    1. Umanath K., Lewis J.B. Update on diabetic nephropathy: core curriculum 2018. Am. J. Kidney Dis. 2018;71:884–895. doi: 10.1053/j.ajkd.2017.10.026. - DOI - PubMed
    1. Olsen S., Mogensen C.E. How often is NIDDM complicated with non-diabetic renal disease? An analysis of renal biopsies and the literature. Diabetologia. 1996;39:1638–1645. doi: 10.1007/s001250050628. - DOI - PubMed
    1. Nzerue C.M., Hewan-Lowe K., Harvey P., Mohammed D., Furlong B., Oster R. Prevalence of non-diabetic renal disease among African-American patients with type II diabetes mellitus. Scand. J. Urol. Nephrol. 2000;34:331–335. doi: 10.1080/003655900750048378. - DOI - PubMed
    1. Zhuo L., Zou G., Li W., Lu J., Ren W. Prevalence of diabetic nephropathy complicating non-diabetic renal disease among Chinese patients with type 2 diabetes mellitus. Eur. J. Med. Res. 2013;18:4. doi: 10.1186/2047-783X-18-4. - DOI - PMC - PubMed
    1. Erdogmus S., Kiremitci S., Celebi Z.K., Akturk S., Duman N., Ates K., Erturk S., Nergizoglu G., Kutlay S., Sengul S., Ensari A., Keven K. Non-diabetic kidney disease in type 2 diabetic patients: prevalence, clinical predictors and outcomes. Kidney Blood Press. Res. 2017;42:886–893. doi: 10.1159/000484538. - DOI - PubMed

LinkOut - more resources