

Construction and validation of a nomogram model for predicting diabetic peripheral neuropathy
- PMID: 39736870
- PMCID: PMC11682957
- DOI: 10.3389/fendo.2024.1419115
Construction and validation of a nomogram model for predicting diabetic peripheral neuropathy
Abstract
Objective: Diabetic peripheral neuropathy (DPN) is a chronic complication of diabetes that can potentially escalate into ulceration, amputation and other severe consequences. The aim of this study was to construct and validate a predictive nomogram model for assessing the risk of DPN development among diabetic patients, thereby facilitating the early identification of high-risk DPN individuals and mitigating the incidence of severe outcomes.
Methods: 1185 patients were included in this study from June 2020 to June 2023. All patients underwent peripheral nerve function assessments, of which 801 were diagnosed with DPN. Patients were randomly divided into a training set (n =711) and a validation set (n = 474) with a ratio of 6:4. The least absolute shrinkage and selection operator (LASSO) logistic regression analysis was performed to identify independent risk factors and develop a simple nomogram. Subsequently, the discrimination and clinical value of the nomogram was extensively validated using receiver operating characteristic (ROC) curves, calibration curves and clinical decision curve analyses (DCA).
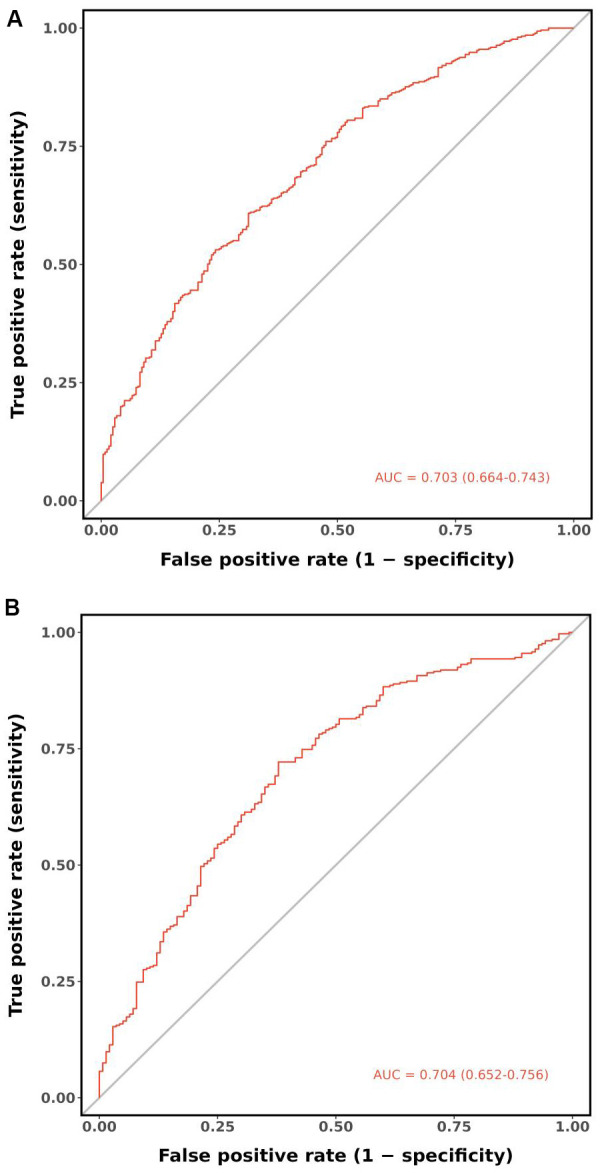
Results: Following LASSO regression analysis, a nomogram model for predicting the risk of DPN was eventually established based on 7 factors: age (OR = 1.02, 95%CI: 1.01 - 1.03), hip circumference (HC, OR = 0.94, 95%CI: 0.92 - 0.97), fasting plasma glucose (FPG, OR = 1.06, 95%CI: 1.01 - 1.11), fasting C-peptide (FCP, OR = 0.66, 95%CI: 0.56 - 0.77), 2 hour postprandial C-peptide (PCP, OR = 0.78, 95%CI: 0.72 - 0.84), albumin (ALB, OR = 0.90, 95%CI: 0.87 - 0.94) and blood urea nitrogen (BUN, OR = 1.08, 95%CI: 1.01 - 1.17). The areas under the curves (AUC) of the nomogram were 0.703 (95% CI 0.664-0.743) and 0.704 (95% CI 0.652-0.756) in the training and validation sets, respectively. The Hosmer-Lemeshow test and calibration curves revealed high consistency between the predicted and actual results of the nomogram. DCA demonstrated that the nomogram was valuable in clinical practice.
Conclusions: The DPN nomogram prediction model, containing 7 significant variables, has exhibited excellent performance. Its generalization to clinical practice could potentially help in the early detection and prompt intervention for high-risk DPN patients.
Keywords: C-peptide; age; albumin; blood urea nitrogen; diabetic peripheral neuropathy; fasting plasma glucose; hip circumference; nomogram.
Copyright © 2024 Liu, Liu, Chen, Lu and Feng.
Conflict of interest statement
The authors declare that the research was conducted in the absence of any commercial or financial relationships that could be construed as a potential conflict of interest.
Figures


References
Publication types
MeSH terms
LinkOut - more resources
Full Text Sources
Medical
Miscellaneous