

The impact of atrial voltage and conduction velocity phenotypes on atrial fibrillation recurrence
- PMID: 39736879
- PMCID: PMC11683111
- DOI: 10.3389/fcvm.2024.1427841
The impact of atrial voltage and conduction velocity phenotypes on atrial fibrillation recurrence
Abstract
Introduction: Low atrial voltage and slow conduction velocity (CV) have been associated with atrial fibrillation (AF); however, their interaction and relative importance as early disease markers remain incompletely understood. We aimed to elucidate the relationship between atrial voltage and CV using high-density electroanatomic (HDE) maps of patients with AF.
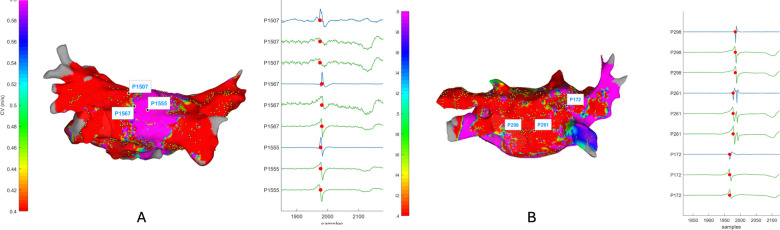
Methods: HDE maps obtained during sinus rhythm in 52 patients with AF and five healthy controls were analysed. Atrial voltage and CV maps were generated, and their correlations were assessed. Subgroup analyses were performed based on clinically relevant factors such as AF type, CV, and voltage levels. Finally, cluster analysis was conducted to identify distinct phenotypes within the population, reflecting different patterns of conduction and voltage.
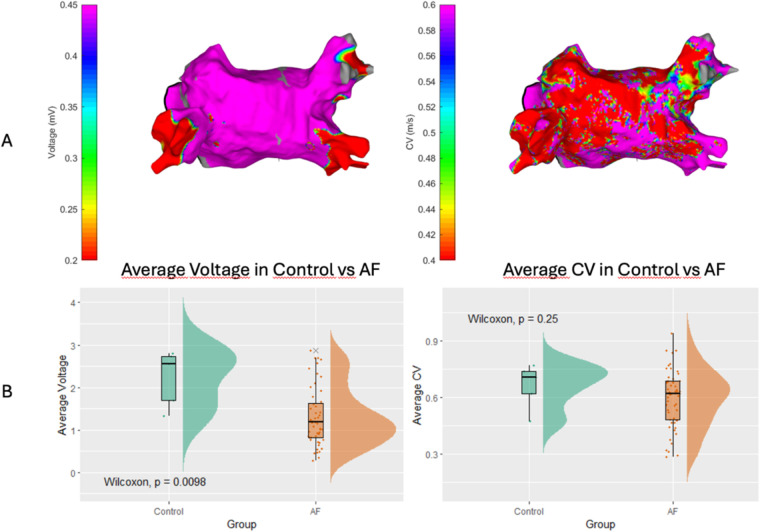
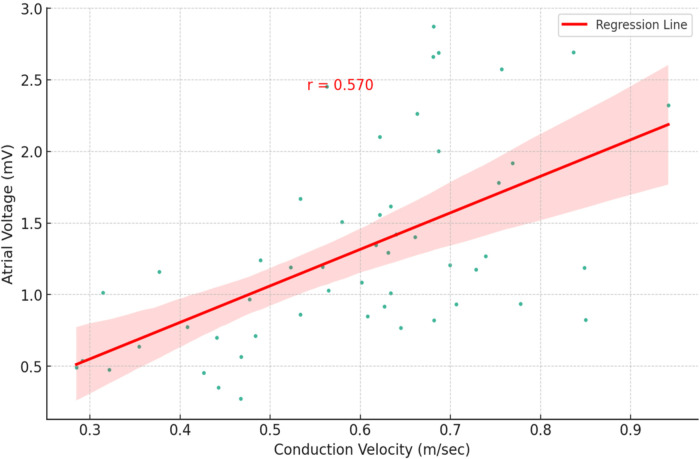
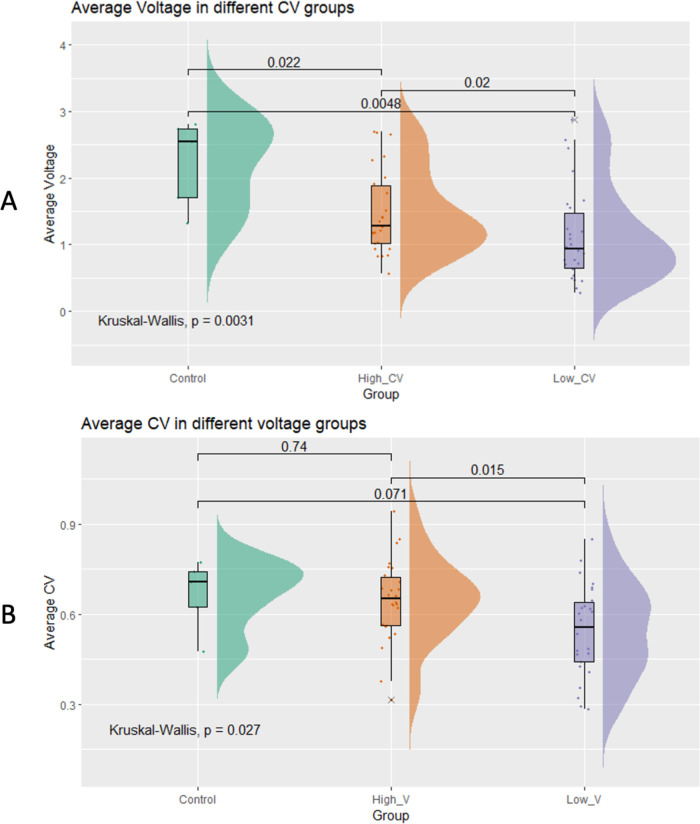
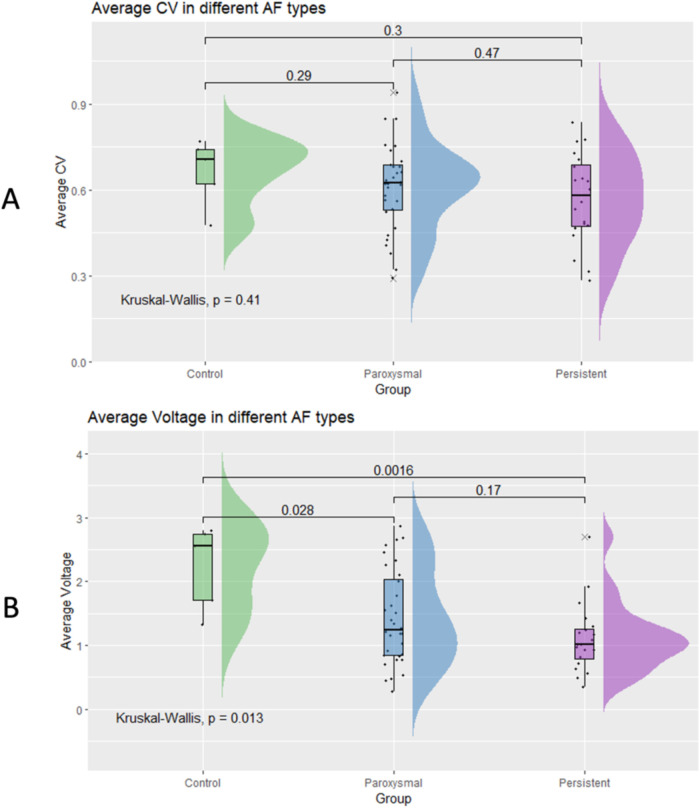
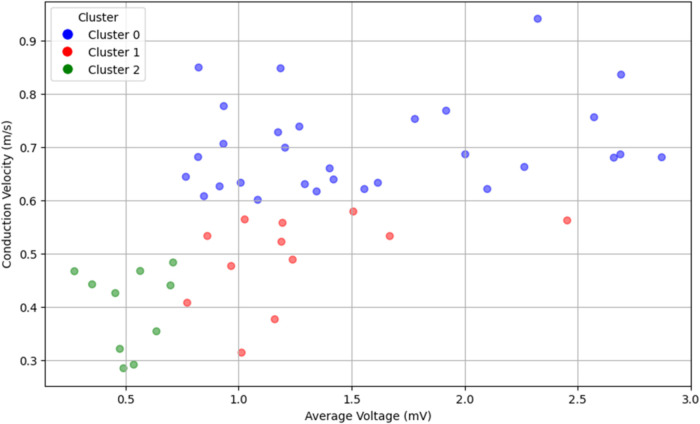
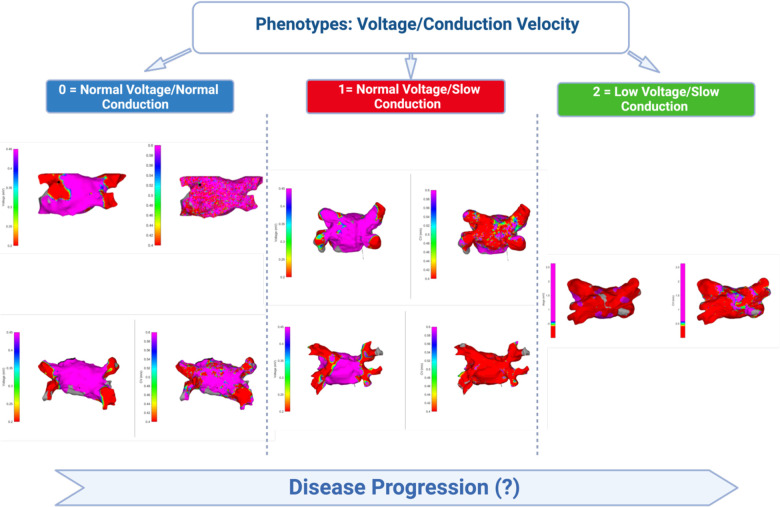
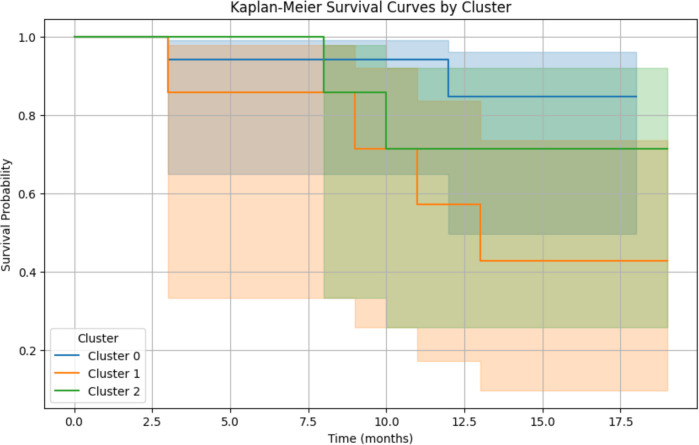
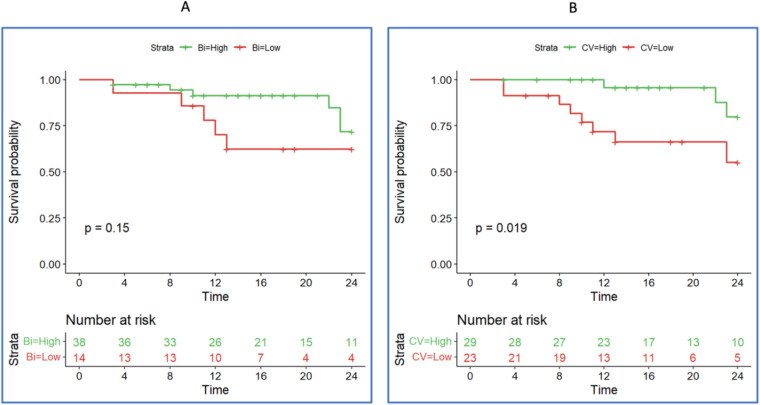
Results: A moderate positive correlation was found between the mean atrial voltage and CV (r = 0.570). Subgroup analysis revealed differences in voltage (p = 0.0044) but not in global CV (p = 0.42), with no significant differences between AF types. Three distinct phenotypes emerged: normal voltage/normal CV, normal voltage/low CV, and low voltage/low CV, with distinct recurrence rates, suggesting different disease progression paths. Slower atrial CV was identified as a significant predictor of arrhythmia recurrence at 12 and 24 months after AF ablation, surpassing the predictive potential of atrial voltage.
Conclusion: Atrial voltage and CV analyses revealed distinct phenotypes. Lower atrial CV emerged as a significant predictor of AF recurrence, exceeding the predictive significance of atrial voltage. These findings emphasise the importance of considering CV and voltage in managing AF and offer potential insights for personalised strategies.
Keywords: ablation & electrophysiology; atrial conduction velocity; atrial fibrillation; atrial myopathy; voltage.
© 2024 Silva Cunha, Laranjo, Monteiro, Portugal, Guerra, Rocha, Pereira, Ferreira, Heijman and Oliveira.
Conflict of interest statement
AR and MP are employees of Biosense Webster. The remaining authors declare that the research was conducted in the absence of any commercial or financial relationships that could be construed as a potential conflict of interest.
Figures
Similar articles
-
Regional left atrial conduction velocity in the anterior wall is associated with clinical recurrence of atrial fibrillation after catheter ablation: efficacy in combination with the ipsilateral low voltage area.BMC Cardiovasc Disord. 2022 Nov 1;22(1):457. doi: 10.1186/s12872-022-02881-6. BMC Cardiovasc Disord. 2022. PMID: 36319975 Free PMC article.
-
Association between left atrial slow conduction velocity and recurrence of atrial fibrillation: a prospective study based on high-density mapping.J Interv Card Electrophysiol. 2025 Apr 30. doi: 10.1007/s10840-025-02052-5. Online ahead of print. J Interv Card Electrophysiol. 2025. PMID: 40304954
-
Dynamic Atrial Substrate During High-Density Mapping of Paroxysmal and Persistent AF: Implications for Substrate Ablation.JACC Clin Electrophysiol. 2019 Nov;5(11):1265-1277. doi: 10.1016/j.jacep.2019.06.002. Epub 2019 Jul 31. JACC Clin Electrophysiol. 2019. PMID: 31753431
-
The effect of fixed and functional remodelling on conduction velocity, wavefront propagation, and rotational activity formation in atrial fibrillation.Europace. 2024 Oct 3;26(10):euae239. doi: 10.1093/europace/euae239. Europace. 2024. PMID: 39283961 Free PMC article.
-
Conduction velocity is reduced in the posterior wall of hypertrophic cardiomyopathy patients with normal bipolar voltage undergoing ablation for paroxysmal atrial fibrillation.J Interv Card Electrophysiol. 2024 Jan;67(1):203-210. doi: 10.1007/s10840-023-01533-9. Epub 2023 Mar 23. J Interv Card Electrophysiol. 2024. PMID: 36952090 Review.
References
LinkOut - more resources
Full Text Sources