

Climate change impact on blood haemogram in the horse: a three-year preliminary study
- PMID: 39736933
- PMCID: PMC11683153
- DOI: 10.3389/fvets.2024.1482268
Climate change impact on blood haemogram in the horse: a three-year preliminary study
Abstract
Introduction: The global climatic changes pose a substantial threat to the well-being and productivity of both humans and animals.
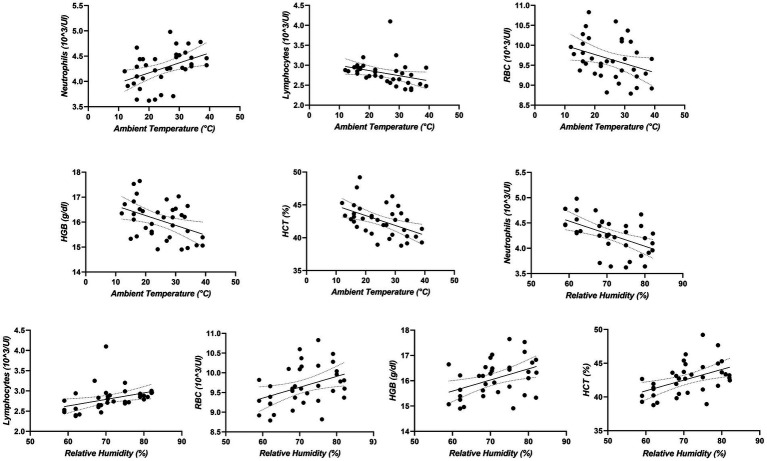
Methods: This study examined the impact of climate changes during different seasons over a 3-year monitoring period (2021-2023) on various blood parameters including, white blood cells (WBC), neutrophils, basophils, eosinophils, lymphocytes, and monocytes, hematocrit (HCT), hemoglobin (HGB), red blood cells (RBC), platelets (PLT), mean corpuscular hemoglobin concentration (MCHC), mean corpuscular volume (MCV), and mean corpuscular hemoglobin (MCH). The study focused on 25 Thoroughbred mares located in Kastamonu-Türkiye. Thermal and hygrometric parameters, including ambient temperature, relative humidity, and ventilation, were collected. Subsequently, Temperature-Humidity index (THI) was computed. Blood samples were collected on the first day of every month from January 2021 to December 2023 and used for a complete blood count analysis. Between 2021 and 2023, changes in environmental indicators were correlated to changes in hematological parameters.
Results: Two-way for repeated measures ANOVA revealed a significant seasonal fluctuation (<0.0001) in ambient temperature, relative humidity, and THI. There was a reduction in RBC (<0.01), and MCH (<0.01) every year, HGB (<0.0001) in summer 2021, 2022 and in summer and autumn 2023. HCT (<0.0001), MCV (<0.01), showed decreasing values in autumn 2022 and 2023. MCHC values showed increasing values in July and August 2021, 2022 and in June 2023. WBC levels increased throughout the spring periods of 2021 and 2022. In April 2021, there were elevated levels of lymphocytes and monocytes (<0.0001) respectively.
Discussion: These findings could be helpful to promote the monitoring of physiological status both for the assessment of welfare status and for diagnostic purposes for the evaluation of possible disease outbreaks due to climate change in veterinary medicine.
Keywords: climate changes; haemogram; hematology; horses; seasonal variations.
Copyright © 2024 Deniz, Aragona, Murphy, Tümer, Bozacı and Fazio.
Conflict of interest statement
The authors declare that the research was conducted in the absence of any commercial or financial relationships that could be construed as a potential conflict of interest.
Figures


References
-
- United Nations Environment Programme (UNEP) . Emissions gap report—Executive summary. Nairobi, Kenia: UNEP; (2020).
-
- Purwar V, Dm C, Singh S, Kumar J, Khare A, Thorat G. Assessment of haematological parameters during different climatic seasons. J Pharmacognosy Phytochem. (2019) 8:1741–4.
-
- Wiebe K, Lotze-Campen H, Sands R, Tabeau A, Van Der MD, Biewald A, et al. Climate change impacts on agriculture in 2050 under a range of plausible socioeconomic and emissions scenarios. Environ Res Lett. (2015) 10:085010. doi: 10.1088/1748-9326/10/8/085010 - DOI
-
- Taskinsoy J. Global cooling through blockchain to avoid catastrophic climate changes by 2050. SSRN Electron J. (2019). doi: 10.2139/ssrn.3495674 - DOI
LinkOut - more resources
Full Text Sources
Miscellaneous