

Optomechanical energy enhanced BF-QEPAS for fast and sensitive gas sensing
- PMID: 39736984
- PMCID: PMC11683322
- DOI: 10.1016/j.pacs.2024.100677
Optomechanical energy enhanced BF-QEPAS for fast and sensitive gas sensing
Abstract
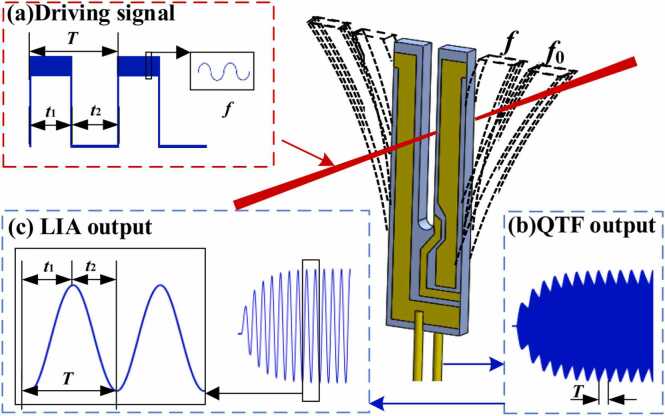
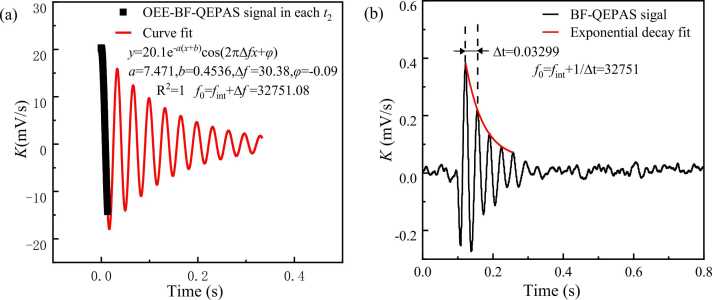
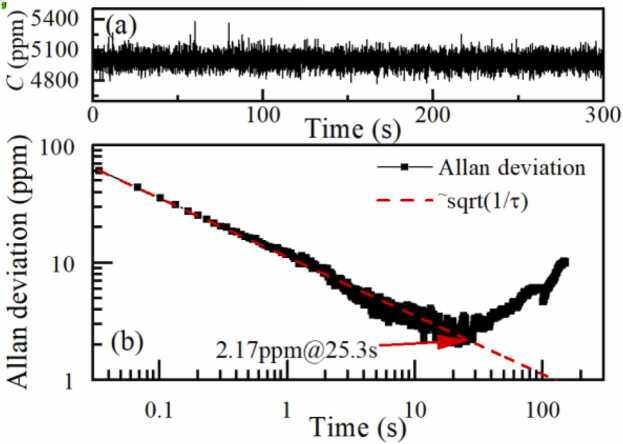
Traditional beat frequency quartz-enhanced photoacoustic spectroscopy (BF-QEPAS) are limited by short energy accumulation times and the necessity of a decay period, leading to weaker signals and longer measurement cycles. Herein, we present a novel optomechanical energy-enhanced (OEE-) BF-QEPAS technique for fast and sensitive gas sensing. Our approach employs periodic pulse-width modulation (PWM) of the laser signal with an optimized duty cycle, maintaining the quartz tuning fork's (QTF) output at a stable steady-state level by applying stimulus signals at each half-period and allowing free vibration in alternate half-periods to minimize energy dissipation. This method enhances optomechanical energy accumulation in the QTF, resulting in an approximate 33-fold increase in response speed and a threefold increase in signal intensity compared to conventional BF-QEPAS. We introduce an energy efficiency coefficient K to quantify the relationship between transient signal amplitude and measurement duration, exploring its dependence on the modulation signal's period and duty cycle. Theoretical analyses and numerical simulations demonstrate that the maximum K occurs at a duty cycle of 50 % and an optimized beat frequency Δf of 30 Hz. Experimental results using methane reveal a detection limit of 2.17 ppm with a rapid response time of 33 ms. The OEE-BF-QEPAS technique exhibits a wide dynamic range with exceptional linearity over five orders of magnitude and a record noise-equivalent normalized absorption (NNEA) coefficient of 9.46 × 10⁻¹⁰ W cm-1 Hz-1/2. Additionally, a self-calibration method is proposed for correcting resonant frequency shifts. The proposed method holds immense potential for applications requiring fast and precise gas detection.
Keywords: Continuous beat frequency; Energy accumulation incentive; Optical sensor; Quartz-enhanced photoacoustic spectroscopy.
© 2024 The Authors.
Conflict of interest statement
The authors declare that they have no known competing financial interests or personal relationships that could have appeared to influence the work reported in this paper.
Figures


References
-
- Felizzato G., Liberatore N., Mengali S., Viola R., Moriggia V., Romolo F.S. A deep learning approach to investigating clandestine laboratories using a GC-QEPAS sensor. Chemosensors. 2024;12:152. doi: 10.3390/chemosensors12080152. - DOI
-
- Menduni G., Zifarelli A., Kniazeva E., Russo S.D., Ranieri A.C., Ranieri E., Patimisco P., Sampaolo A., Giglio M., Manassero F., Dinuccio E., Provolo G., Wu H., Dong L., Spagnolo V. Measurement of methane, nitrous oxide and ammonia in atmosphere with a compact quartz-enhanced photoacoustic sensor. Sens. Actuators B: Chem. 2023;375:132953. doi: 10.1016/j.snb.2022.132953. - DOI
LinkOut - more resources
Full Text Sources
Miscellaneous
