. 2023;2(3):540.
Epub 2023 Jul 27.

Kv3-Expressing Cells Present More Elaborate N-Glycans with Changes in Cytoskeletal Proteins, Neurite Structure and Cell Migration

Affiliations

Kv3-Expressing Cells Present More Elaborate N-Glycans with Changes in Cytoskeletal Proteins, Neurite Structure and Cell Migration

M Kristen Hall et al. COJ Biomed Sci Res. 2023.

Abstract

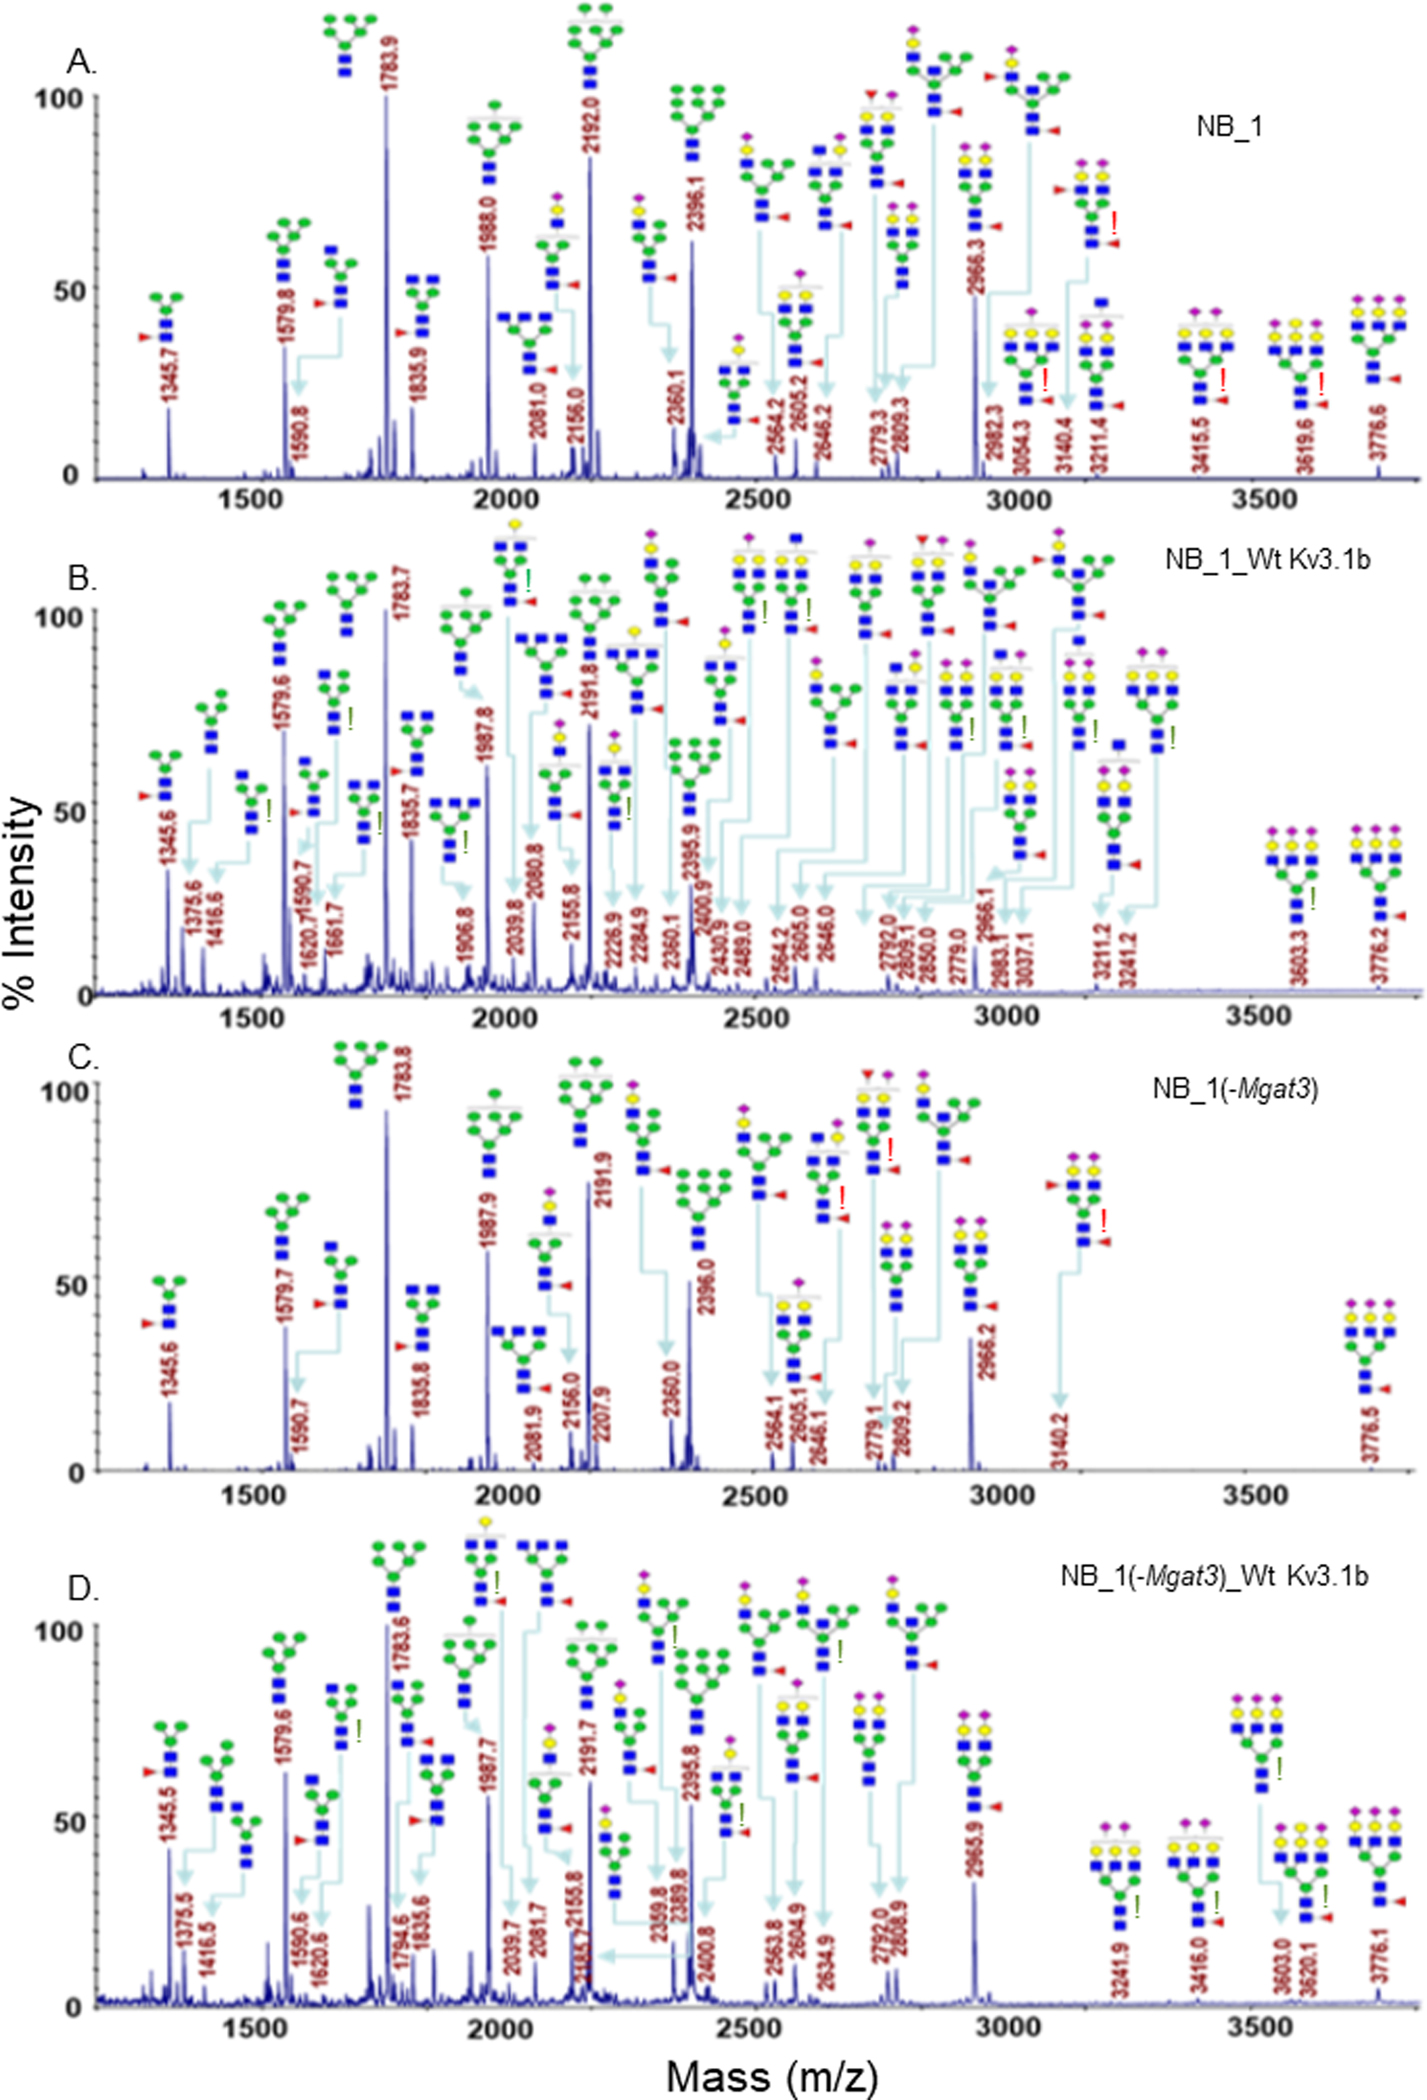
The cues contained by N-glycans relay the quality, cellular destination, and interactions of proteins, thereby, impacting cellular physiology. Voltage-gated K+ (Kv3) channels have two conserved N-glycosylation sites which are vital for Kv3 channel activity, and primary motor neuron development. Our previous studies showed that the parental (NB_1) and N-glycan mutant (NB_1(-Mgat1), NB_1(-Mgat2), and NB_1(-Mgat3)) Neuroblastoma (NB) cell lines have compromised N-acetylglucosaminyltransferase activities: GnT-I, GnT-II, or GnT-III. Herein, we stably expressed Kv3.1b in the parental and engineered N-glycan mutant Neuroblastoma (NB) cell lines to examine how changes in N-glycans alter the cytoskeleton, and subsequently cellular properties. MALDI-TOF MS verified that the parental and mutant cell lines had different N-glycan profiles. When Kv3.1b was expressed in NB cells with an intact Mgat1, the N-glycan population had more complex N-glycans with increased branching. Further NB cells with an intact Mgat2 had higher and lower levels of hybrid and oligomannose N-glycans, respectively. N-Glycan populations changed cytoskeletal protein abundancies and cell morphology. Moreover, all Kv3.1b-expressing cells, except NB_1(-Mgat2), had changed levels of F-actin, neurofilament and vimentin, along with modified neurite formation. In all cases, migratory rates were enhanced when cells expressed Wt Kv3.1b. Glycan populations and glycans attached to Kv3.1b altered spatial arrangement in membranes and both ER folding and transport proteins were not increased by expression of unglycosylated Kv3.1b. Kv3.1b expression in NB cells alters N-glycan populations and mediates adjustments in cytoskeletal proteins, and thereby cell morphology and cell migration, supporting roles in neuronal development and maintenance.

Keywords: Cell morphology; Cell motility; Cytoskeletal proteins; Glycans; Kv3 channels; N-glycosylation; Protein folding.


Figures

Figure 1:
Figure 1:
N-Glycosylation processing of Wt. Kv3.1b is changed in NB_1(-Mgat3) cells relative to the parental NB_1 cell line. Western blot of total membranes of NB_1 and NB_1(-Mgat3) stably expressing wild type (Wt) Kv3.1b or N220/229Q Kv3.1b. Molecular weight standards in kDa: 150, 100. Arrowheads denote glycosylated Kv3.1b protein with complex (green and yellow arrowheads); oligomannose (pink), hybrid (blue) types of N-glycans. Green line denotes glycosylated Kv3.1 protein.
Figure 2:
Figure 2:
Comparison of MALDI-TOF MS profiles of the permethylated N-glycans derived from NB cell lines. NB cell lines without, NB_1 (A) and NB_1(-Mgat3) (C), and with, NB_1_Wt Kv3.1b (B), and NB_1(-Mgat3) Wt Kv3.1b (D), glycosylated Kv3.1b expression. Data were obtained from dichloromethane extracted permethylated N-glycans with molecular ions present in sodiated form ([M + Na]+). Red exclamation points (A, C) signify N-glycans found only in NB cell lines not expressing Kv3.1b. Green exclamation points (B, D) denote increased N-glycans detected in NB cell lines expressing Kv3.1b.
Figure 3:
Figure 3:
Glycan profiles of NB cell lines without an intact Mgat1 or Mgat2. MALDI- TOF MS profiles of permethylated N-glycans derived from NB_1(-Mgat2) (A), NB_1(-Mgat2)_Wt Kv3.1b (B) and NB_1(-Mgat1) (C) cell lines. Data were obtained from dichloromethane extracted permethylated N-glycans and all molecular ions present in sodiated form ([M + Na]+). Red exclamation points (A) represent N-glycans detected only in the NB cell lines not expressing Kv3.1b. Green exclamation points (B) signify increases in the NB cell lines expressing Kv3.1b.
Figure 4:
Figure 4:
Quantification of MALDI-TOF MS profiles of permethylated N-glycans. Quantification of N-glycan types expressed in NB_1, NB_1 (-Mgat3), NB_1 (-Mgat2), and NB_1 (-Mgat1) cell lines (A, top row) and NB_1, NB_1 (-Mgat3), and NB_1 (- Mgat2) stably expressing Kv3.1b (A, bottom row). Fucosylated N-glycans by type in NB_1, NB_1 (-Mgat1), NB_1 (-Mgat2), and NB_1 (-Mgat3) cell lines (B, top row) and NB_1, NB_1 (-Mgat3), NB_1 (-Mgat2) stably expressing Kv3.1b (B, bottom row). Percent biantennary (light blue) and tri antennary (dark blue) N-glycans in NB_1, NB_1 (-Mgat3), NB_1 (-Mgat2), NB_1 (-Mgat1) cell lines (C, top row) and NB_1, and NB_1 (- Mgat3), NB_1 (-Mgat2) stably expressing Kv3.1b (C, bottom row).
Figure 5:
Figure 5:
Impact of N-glycans and Kv3.1b on cell morphology. Images of NB_1 (upper row) and NB_1(-Mgat1) (lower row) non-transfected (left panel) or expressing glycosylated Kv3.1b (right panel) (A). Yellow, pink, and red arrows and circles correspond to legend indicating structure type. Images encased in yellow, pink and red boxes are magnified (3x) and correspond to encircled areas to highlight the various neurite structures analyzed. Quantification of neurite number (B; n≥20) length (C; n≥52), and % neurite tip protrusions (D; n≥52). Further analysis categorizing types of neurite tip protrusions as % filopodia (E; n≥23), % lamellipodia (F; n≥23), and % with both filopodia and lamellipodia (G; n≥23). Data are presented as mean ± SEM and were all compared by one-way ANOVA with Holm-Bonferroni mean comparison (*p < 0.1, **p < 0.05).
Figure 6:
Figure 6:
N-glycan type associated with the Kv3.1b glycoprotein influences NB migratory rates. Representative images of cell wounds at 0 hours and 19 hours in non-transfected NB_1, NB_1 (-Mgat1), NB_1 (-Mgat2) and NB_1 (-Mgat3) (lower panels) or glycosylated Kv3.1b transfected (upper panels) (A). Bar graph illustrates cell mobility based on percent wound closure at 19h (B). Data are presented as mean ± SEM (n≥6) and Wt. Kv3.1 expressing NB cell line was compared to non-transfected NB cell line by student t-test (**p< 0.001).
Figure 7:
Figure 7:
Influence of N-glycans and Kv3.1b on actin polymerization and intermediate in NB cells. Western blots (n≥3) of filamentous and globular actin (A) and quantification (B) in NB_1 (n=5,4), NB_1 (-Mgat1) (n=5, 4), NB_1 (-Mgat2) (n=4, 3), and NB_1 (-Mgat3) (n=4, 3) cells without Kv3.1 (light green) or expressing Kv3.1 WT (dark green). Western blots of Neurofilament-L (NFL; n=4) (C) and Vimentin (Vim; n=3) (D) multiplexed with β-actin: rhodamine in cell lines as indicated. Quantification of protein levels relative to β-actin (E, F) in NB_1, NB_1 (-Mgat1), NB_1 (-Mgat2), and NB_1 (-Mgat3) cells without Kv3.1 (light green) or expressing Kv3.1 WT (dark green). Data are presented as mean ± SEM. Wt Kv3.1 expressing NB cell line was compared to non-transfected NB_1 cell line by student t-test (*p < 0.05, **p < 0.001) and non-transfected and Wt Kv3.1b expressing NB_1 cell line were all compared by one- way ANOVA with Holm-Bonferroni mean comparison (*p < 0.1, **p < 0.05).
Figure 8:
Figure 8:
Kv3.1b localization in outgrowths of rat neuroblastoma cell lines with atypical N-glycosylation. Representative TIRF (A) microscopy images acquired of glycosylated (WT) (upper panels) and glycosylated (N220/229Q) (lower panels) Kv3.1b proteins labeled with EGFP expressed in NB_1 (left columns) and NB_1(-Mgat3) (right columns) cells. Quantification of percent of Wt Kv3.1b (pink) and N220/229Q Kv3.1b (blue) localized in neurites of NB_1 and NB1_(-Mgat3) cells as detected via TIRF (n≥18) (B). Confocal microscopy images (C) of glycosylated (WT) (upper panels) and unglycosylated (N220/229Q) (lower panels) Kv3.1b proteins. in cell lines as indicated. Bar graphs indicate % Kv3.1 detected in neurites via confocal microscopy (n≥10) (D) in NB cell lines as shown. The Wt Kv3.1 expressing NB cell line was compared to N220/229Q Kv3.1b expressing NB cell line by student t-test (*p < 0.05, **p < 0.001). Wt Kv3.1b or N220/229Q Kv3.1b expressing NB cell lines were compared by one-way ANOVA with Holm-Bonferroni mean comparison (*p<0.1, **p<0.05). Black lines inside the bars denote statistical differences between WT_Kv3.1b and N220/9Q Kv3.1b within each cell line. Corresponding color lines above the bar graph indicate statistical differences among the cell lines.
Figure 9:
Figure 9:
N-glycans and expression of ER chaperones in neuronal cells. Western blots of BiP (n=5), calreticulin (CRT) (n=4), Grp94 (n=4), and KIF5B (n=4) multiplexed with β-actin: rhodamine (A) and their quantification in NB cells (as shown) expressing WT KV3.1 (pink) or N220/9Q_Kv3.1 (blue)(B). Corresponding color lines above the bar graph indicate statistical differences among the cell lines. (*, ***) inset within the bar graph signified differences between WT_Kv3.1b and N220/9Q Kv3.1b within indicated cell line. Data are presented as mean±SEM. Wt. Kv3.1 expressing NB cell line was compared to non-transfected NB_1 cell line by student t-test (*p<0.05, **p<0.001). Wt. Kv3.1b or N220/9Q Kv3.1b expressing NB cell lines were all compared by one-way ANOVA with Holm-Bonferroni mean comparison (*p < 0.1, **p < 0.05).

Similar articles

References

    1. Chang IJ, He M, Lam CT (2018) Congenital disorders of glycosylation. Ann Transl Med 6(24): 477. - PMC - PubMed
    1. Verheijen J, Tahata S, Kozicz T, Witters P, Morava E (2020) Therapeutic approaches in Congenital Disorders of Glycosylation (CDG) involving N-linked glycosylation: an update. Genet Med 22(2): 268–279. - PMC - PubMed
    1. Stanley P, Taniguchi N, Aebi M (2015) N-Glycans. In: Varki A, Cummings RD, Esko JD, Stanley P, Hart GW, et al. (Eds.), (3rd edn), Essentials of Glycobiology, Cold Spring Harbor Laboratory Press, New York, USA, pp. 99–111.
    1. Grissmer S, Ghanshani S, Dethlefs B, McPherson JD, Wasmuth JJ, et al. (1992) The Shaw-related potassium channel gene, Kv3.1, on human chromosome 11, encodes the type l K+ channel in T cells. J Biol Chem 267(29): 20971–20979. - PubMed
    1. Kaczmarek LK, Zhang Y (2017) Kv3 channels: Enablers of rapid firing, neurotransmitter release and neuronal endurance. Physiol Rev 97(4): 1431–1468. - PMC - PubMed

LinkOut - more resources