

Combination decoction of Astragalus mongholicus and Salvia miltiorrhiza mitigates pressure-overload cardiac dysfunction by inhibiting multiple ferroptosis pathways
- PMID: 39737072
- PMCID: PMC11683366
- DOI: 10.3389/fphar.2024.1447546
Combination decoction of Astragalus mongholicus and Salvia miltiorrhiza mitigates pressure-overload cardiac dysfunction by inhibiting multiple ferroptosis pathways
Abstract
Background: Astragalus mongholicus (AM) and Salvia miltiorrhiza (SM) are commonly used in traditional Chinese medicine to treat heart failure (HF). Ferroptosis has been studied as a key factor in the occurrence of HF. It remains unclear whether the combined use of AM and SM can effectively improve HF and the underlying mechanisms.
Objective: This study aims to explore whether the combined use of AM and SM can improve HF by inhibiting ferroptosis. It also examines the roles and interactions of the pathways associated with GPX4, FSP1, and DHODH.
Methods: In vitro experiments used angiotensin II-induced (4 μM for 48 h) hypertrophic H9c2 cells, while in vivo studies employed a rat model of transverse aortic constriction-induced (to 1 mm for 8 weeks) HF. Interventions included decoctions of AM and SM (for animal experiments) and medicated serum (for cell experiments), along with specific pathway inhibitors such as erastin, FSP1 inhibitor and brequinar. Subsequently, various molecular biology methods were used to measure the protein levels of GPX4, FSP1, and DHODH, as well as each sample group's ferroptosis-related and HF-related indicators, to elucidate the underlying mechanisms.
Results: The combined use of AM and SM can effectively restore the levels of GPX4, FSP1, and DHODH that are reduced after HF, as well as improve indicators related to ferroptosis and HF. When GPX4, FSP1, or DHODH is inhibited, the ferroptosis-inhibiting effect and the ability of AM and SM to improve HF are both weakened. When two of the three proteins are inhibited, the protective effect of HDC is strongest when GPX4 is retained, followed by FSP1, and weakest when DHODH is retained.
Conclusion: This study confirms that the combined use of AM and SM inhibits ferroptosis and alleviates HF by increasing GPX4, FSP1, and DHODH levels. It shows that the protective effect is strongest through GPX4, followed by FSP1, and weakest through DHODH. These findings provide new insights into the therapeutic mechanisms of this combination of botanical drugs.
Keywords: Astragalus mongholicus; DHODH; FSP1; GPX4; Salvia miltiorrhiza; ferroptosis; heart failure.
Copyright © 2024 Xu, Liu, Chen, Guo, Lu, Zhang, Wang and Shen.
Conflict of interest statement
The authors declare that the research was conducted in the absence of any commercial or financial relationships that could be construed as a potential conflict of interest.
Figures
 represents an individual sample data point. HDC, Astragalus mongholicus and Salvia miltiorrhiza Combination; AngII, Angiotensin II; HF, Heart failure; F, Ferrostatin-1; E, Erastin; L-S, Low Dosage Astragalus mongholicus and Salvia miltiorrhiza Medication-Containing Serum; H-S, High Dosage Astragalus mongholicus and Salvia miltiorrhiza Medication-Containing Serum; LVEF, Left Ventricular Ejection Fraction; NT-proBNP, N-terminal pro B-type Natriuretic Peptide; TAC, Transverse Aortic Constriction; L, Low Dosage Astragalus mongholicus and Salvia miltiorrhiza Decoction; H, High Dosage Astragalus mongholicus and Salvia miltiorrhiza Decoction.
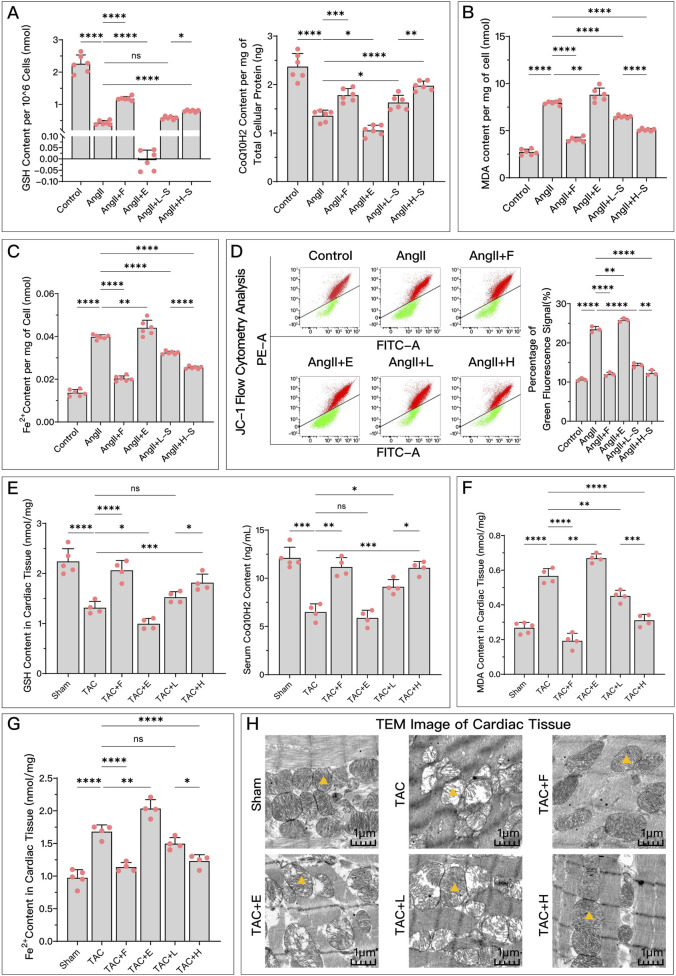
 indicating one of the mitochondria in the image. pns ≥ 0.05, p* < 0.05, p** < 0.01, p*** < 0.001, p**** < 0.0001.
  represents an individual sample data point. HDC, Astragalus mongholicus and Salvia miltiorrhiza Combination; HF, Heart failure; AngII, Angiotensin II; F, Ferrostatin-1; E, Erastin; L-S, Low Dosage Astragalus mongholicus and Salvia miltiorrhiza Medication-Containing Serum; H-S, High Dosage Astragalus mongholicus and Salvia miltiorrhiza Medication-Containing Serum; TAC, Transverse Aortic Constriction; L, Low Dosage Astragalus mongholicus and Salvia miltiorrhiza Decoction; H, High Dosage Astragalus mongholicus and Salvia miltiorrhiza Decoction; GSH, Reduced Glutathione; CoQ10H2, Reduced Coenzyme Q10; MDA, Malondialdehyde; PE-A, Phycoerythrin Area; FITC-A, Fluorescein Isothiocyanate Area.
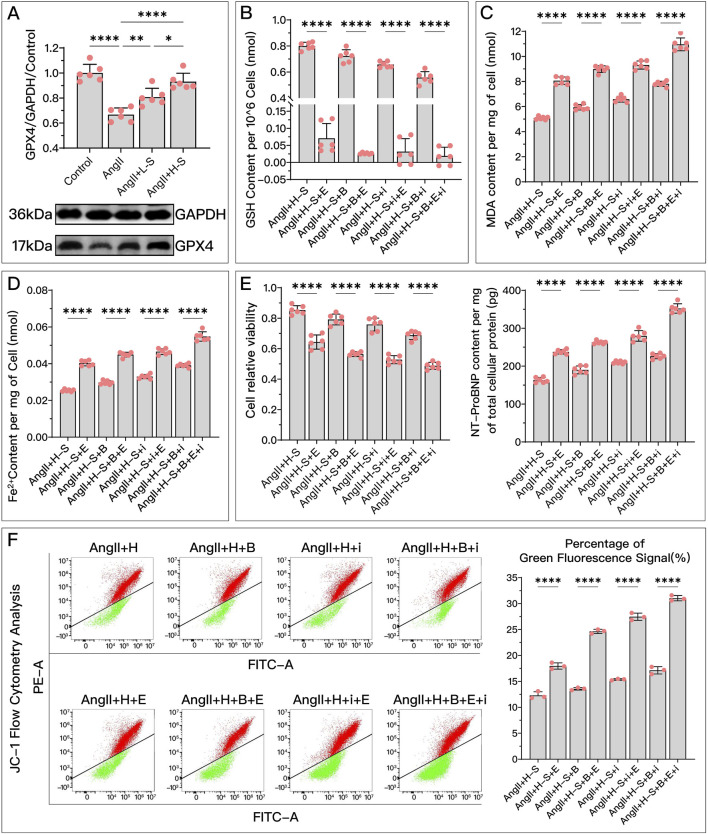
 represents an individual sample data point. HDC, Astragalus mongholicus and Salvia miltiorrhiza Combination; GPX4, Glutathione Peroxidase 4; GAPDH, Glyceraldehyde 3-Phosphate Dehydrogenase; AngII, Angiotensin II; L-S, Low Dosage Astragalus mongholicus and Salvia miltiorrhiza Medication-Containing Serum; H-S, High Dosage Astragalus mongholicus and Salvia miltiorrhiza Medication-Containing Serum; GSH, Reduced Glutathione; FSP1, Ferroptosis Suppressor Protein 1; DHODH, Dihydroorotate Dehydrogenase; E, Erastin; B, Brequinar; i, Inhibitor of FSP1; MDA, Malondialdehyde; NT-proBNP, N-terminal pro B-type Natriuretic Peptide; PE-A, Phycoerythrin Area; FITC-A, Fluorescein Isothiocyanate Area.
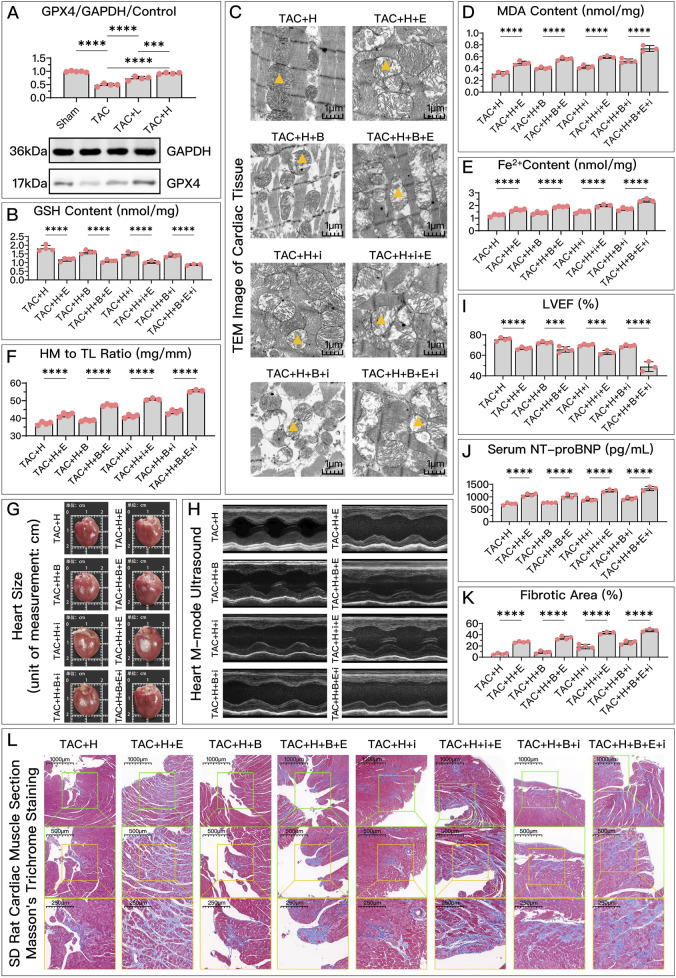
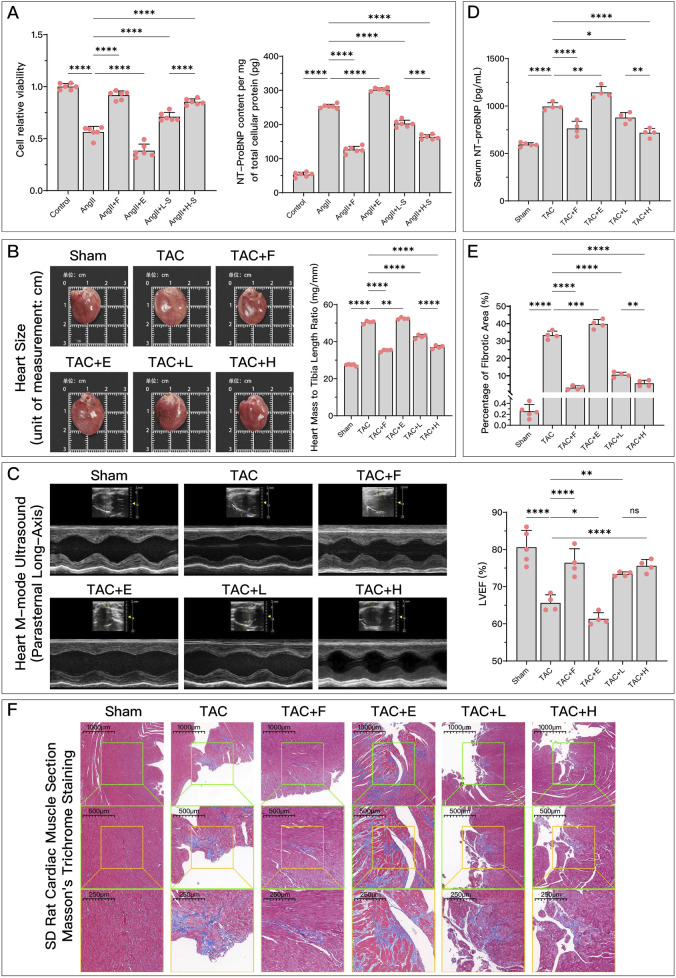
 indicates one of the mitochondria), MDA levels, Fe2+ content, and serum NT-proBNP levels. (F, G) The heart mass to tibia length ratio and gross cardiac images in HF rats. (H, I) M-mode echocardiography images of the left ventricle adjacent to the sternum and quantitative analysis of LVEF in HF rats. (L) Masson’s trichrome staining of myocardial tissue in HF rats (×50, ×100, ×200 magnifications), with blue staining indicating collagen deposition, suggestive of myocardial fibrosis. (K) Quantitative analysis of fibrotic area based on Masson’s trichrome staining. p*** < 0.001, p**** < 0.0001.
  represents an individual sample data point. HDC, Astragalus mongholicus and Salvia miltiorrhiza Combination; HF, Heart failure; GPX4, Glutathione Peroxidase 4; GAPDH, Glyceraldehyde 3-Phosphate Dehydrogenase; TAC, Transverse Aortic Constriction; L, Low Dosage Astragalus mongholicus and Salvia miltiorrhiza Decoction; H, High Dosage Astragalus mongholicus and Salvia miltiorrhiza Decoction; FSP1, Ferroptosis Suppressor Protein 1; DHODH, Dihydroorotate Dehydrogenase; GSH, Reduced Glutathione; E, Erastin; B, Brequinar; i, Inhibitor of FSP1; TEM, Transmission Electron Microscopy; MDA, Malondialdehyde; NT-proBNP, N-terminal pro B-type Natriuretic Peptide; HM, Heart Mass; TL, Tibia Length; LVEF, Left Ventricular Ejection Fraction.
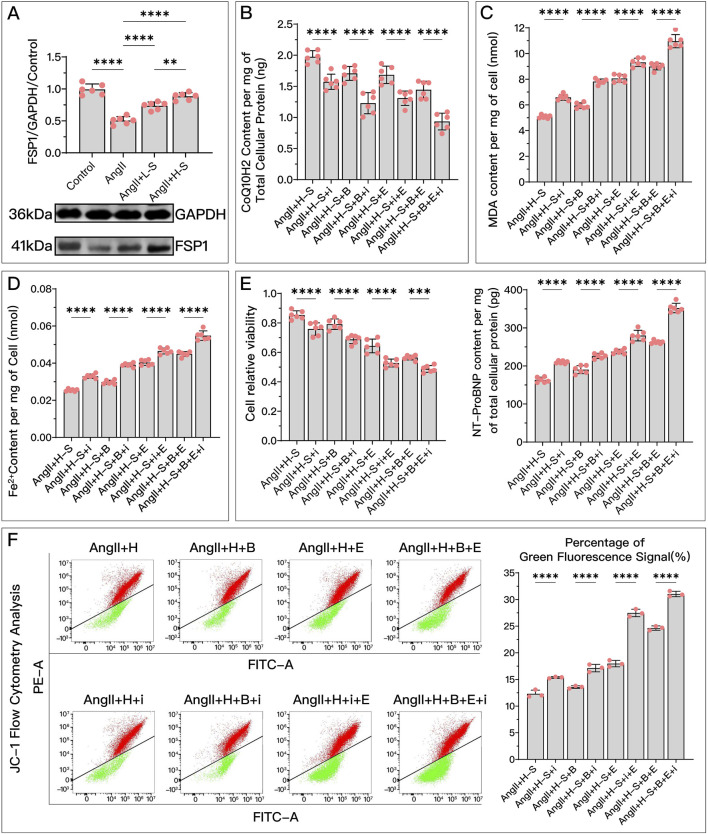
 represents an individual sample data point. HDC, Astragalus mongholicus and Salvia miltiorrhiza Combination; FSP1, Ferroptosis Suppressor Protein 1; GAPDH, Glyceraldehyde 3-Phosphate Dehydrogenase; AngII, Angiotensin II; L-S, Low Dosage Astragalus mongholicus and Salvia miltiorrhiza Medication-Containing Serum; H-S, High Dosage Astragalus mongholicus and Salvia miltiorrhiza Medication-Containing Serum; CoQ10H2, Reduced Coenzyme Q10; GPX4, Glutathione Peroxidase 4; DHODH, Dihydroorotate Dehydrogenase; i, Inhibitor of FSP1; B, Brequinar; E, Erastin; MDA, Malondialdehyde; NT-proBNP, N-terminal pro B-type Natriuretic Peptide; PE-A, Phycoerythrin Area; FITC-A, Fluorescein Isothiocyanate Area.
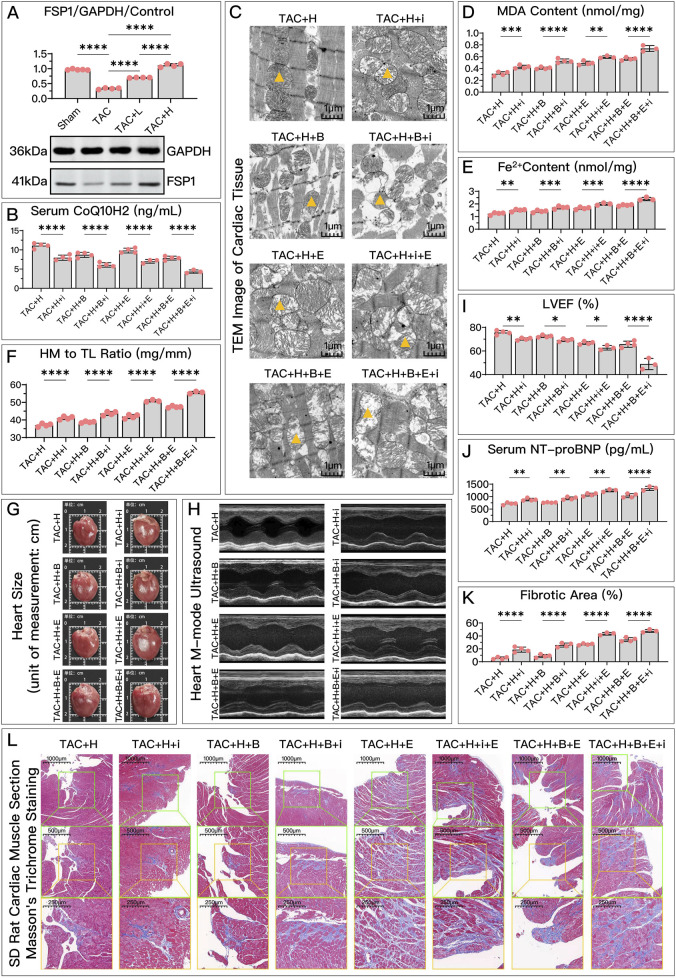
 indicates one of the mitochondria), MDA levels, Fe2+ content, and serum NT-proBNP levels. (F, G) Heart mass to tibia length ratio and gross cardiac images in HF rats. (H, I) Parasternal long-axis M-mode echocardiography images of the left ventricle and quantitative analysis of LVEF in rats. (L) Masson’s trichrome staining of myocardial tissue in HF rats (×50, ×100, ×200 magnifications), where blue staining indicates collagen deposition, indicative of myocardial fibrosis. (K) Quantitative analysis of the fibrotic area based on Masson’s trichrome staining. p* < 0.05, p** < 0.01, p*** < 0.001, p**** < 0.0001.
  represents an individual sample data point. HDC, Astragalus mongholicus and Salvia miltiorrhiza Combination; HF, Heart failure; FSP1, Ferroptosis Suppressor Protein 1; GAPDH, Glyceraldehyde 3-Phosphate Dehydrogenase; TAC, Transverse Aortic Constriction; L, Low Dosage Astragalus mongholicus and Salvia miltiorrhiza Decoction; H, High Dosage Astragalus mongholicus and Salvia miltiorrhiza Decoction; CoQ10H2, Reduced Coenzyme Q10; GPX4, Glutathione Peroxidase 4; DHODH, Dihydroorotate Dehydrogenase; i, Inhibitor of FSP1; B, Brequinar; E, Erastin; TEM, Transmission Electron Microscopy; MDA, Malondialdehyde; NT-proBNP, N-terminal pro B-type Natriuretic Peptide; HM, Heart Mass; TL, Tibia Length; LVEF, Left Ventricular Ejection Fraction.
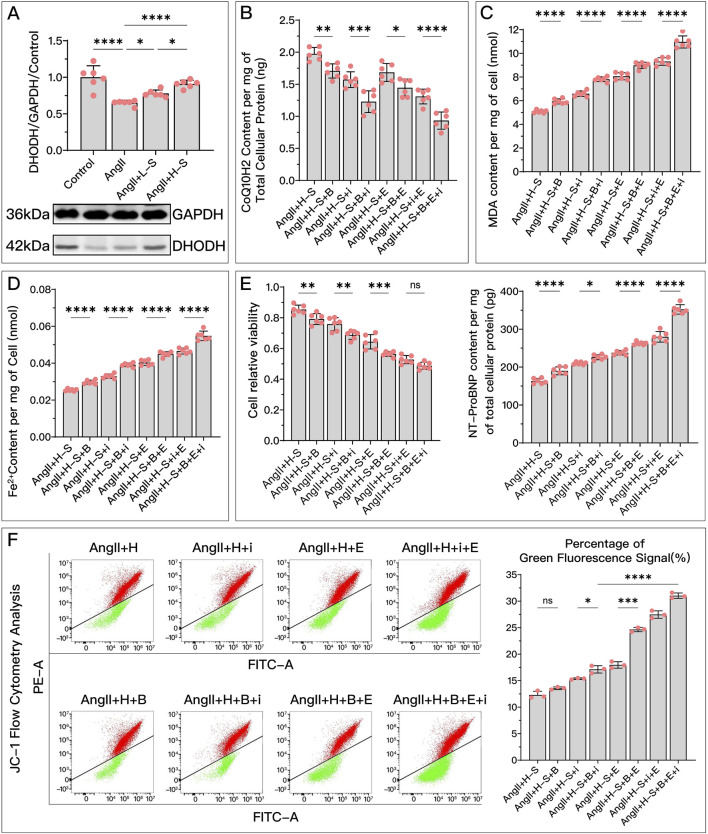
 represents an individual sample data point. HDC, Astragalus mongholicus and Salvia miltiorrhiza Combination; DHODH, Dihydroorotate Dehydrogenase; WB, Western blotting; GAPDH, Glyceraldehyde 3-Phosphate Dehydrogenase; AngII, Angiotensin II; L-S, Low Dosage Astragalus mongholicus and Salvia miltiorrhiza Medication-Containing Serum; H-S, High Dosage Astragalus mongholicus and Salvia miltiorrhiza Medication-Containing Serum; CoQ10H2, Reduced Coenzyme Q10; GPX4, Glutathione Peroxidase 4; FSP1, Ferroptosis Suppressor Protein 1; B, Brequinar; i, Inhibitor of FSP1; E, Erastin; MDA, Malondialdehyde; NT-proBNP, N-terminal pro B-type Natriuretic Peptide; PE-A, Phycoerythrin Area; FITC-A, Fluorescein Isothiocyanate Area.
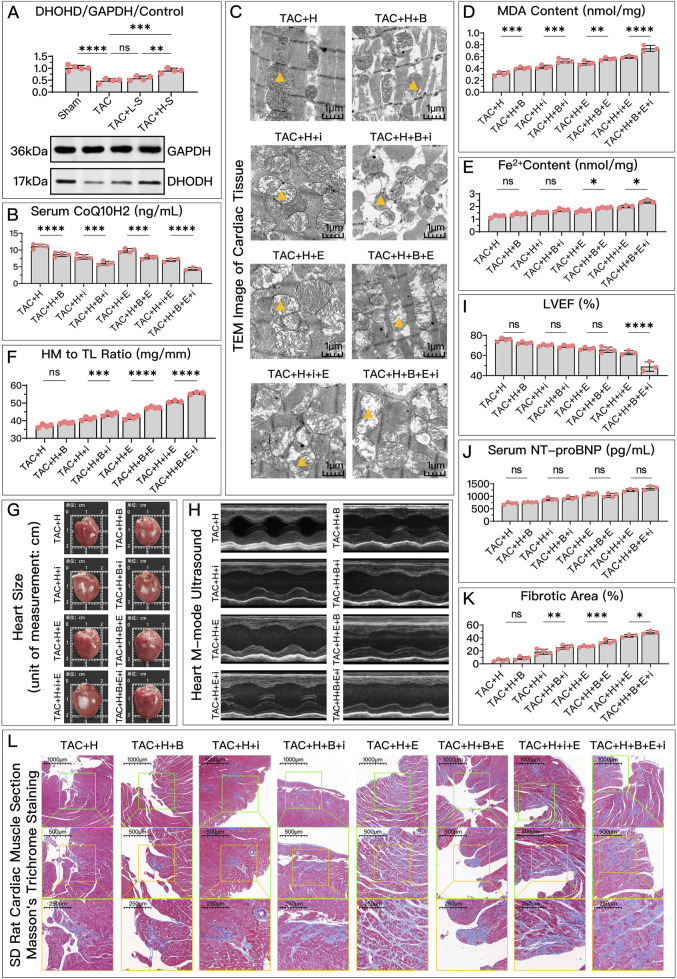
 indicates one of the mitochondria), MDA levels, Fe2+ content, and serum NT-proBNP levels. (F, G) Heart mass to tibia length ratio and gross cardiac images in HF rats. (H, I) Parasternal long-axis M-mode echocardiography images of the left ventricle and quantitative analysis of LVEF in rats. (L) Masson’s trichrome staining of myocardial tissue in HF rats (×50, ×100, ×200 magnifications), where blue staining indicates collagen deposition, suggestive of myocardial fibrosis. (K) Quantitative analysis of the fibrotic area based on Masson’s trichrome staining. pns≥0.05, p*<0.05, p**<0.01, p***<0.001, p****<0.0001.
  represents an individual sample data point. HDC, Astragalus mongholicus and Salvia miltiorrhiza Combination; HF, Heart failure; DHODH, Dihydroorotate Dehydrogenase; GAPDH, Glyceraldehyde 3-Phosphate Dehydrogenase; TAC, Transverse Aortic Constriction; L, Low Dosage Astragalus mongholicus and Salvia miltiorrhiza Decoction; H, High Dosage Astragalus mongholicus and Salvia miltiorrhiza Decoction; CoQ10H2, Reduced Coenzyme Q10; GPX4, Glutathione Peroxidase 4; FSP1, Ferroptosis Suppressor Protein 1; B, Brequinar; i, Inhibitor of FSP1; E, Erastin; TEM, Transmission Electron Microscopy; MDA, Malondialdehyde; NT-proBNP, N-terminal pro B-type Natriuretic Peptide; HM, Heart Mass; TL, Tibia Length; LVEF, Left Ventricular Ejection Fraction.
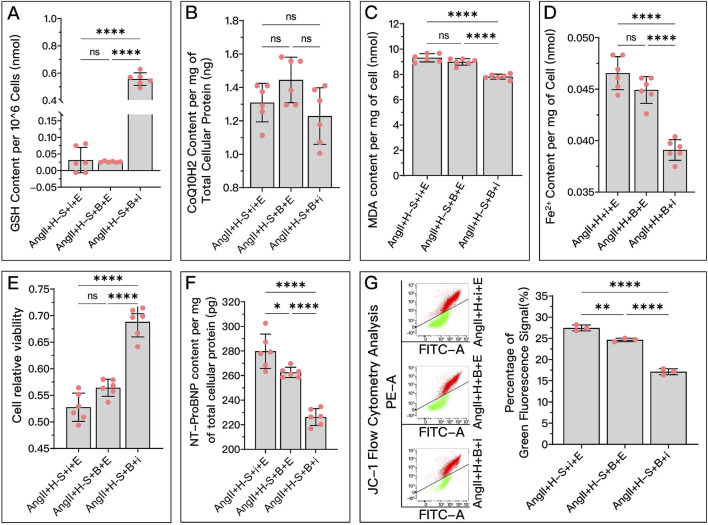
 represents an individual sample data point. GPX4, Glutathione Peroxidase 4; FSP1, Ferroptosis Suppressor Protein 1; DHODH, Dihydroorotate Dehydrogenase; HDC, Astragalus mongholicus and Salvia miltiorrhiza Combination; AngII, Angiotensin II; H-S, High Dosage Astragalus mongholicus and Salvia miltiorrhiza Medication-Containing Serum; i (iFSP1), Inhibitor of FSP1; E, Erastin; B, Brequinar; GSH, Reduced Glutathione; CoQ10H2, Reduced Coenzyme Q10; MDA, Malondialdehyde; NT-proBNP, N-terminal pro B-type Natriuretic Peptide; PE-A, Phycoerythrin Area; FITC-A, Fluorescein Isothiocyanate Area.
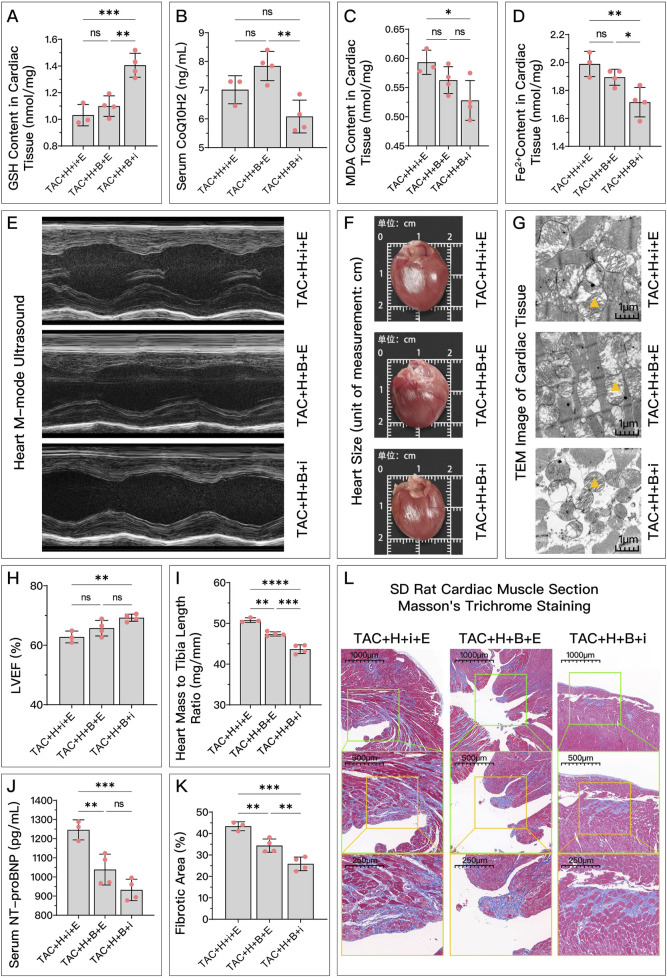
 indicates one of the mitochondria. (J) Serum NT-proBNP levels in these groups of SD rats. (L) Masson’s trichrome staining of myocardial tissue (×50, ×100, ×200 magnifications), where blue staining indicates collagen deposition, suggestive of myocardial fibrosis. (K) Quantitative analysis of the fibrotic area ratio based on Masson’s trichrome staining images. pns≥0.05, p*<0.05, p**<0.01, p****<0.0001.
  represents an individual sample data point. GPX4, Glutathione Peroxidase 4; FSP1, Ferroptosis Suppressor Protein 1; DHODH, Dihydroorotate Dehydrogenase; HDC, Astragalus mongholicus and Salvia miltiorrhiza Combination; HF, Heart failure; TAC, Transverse Aortic Constriction; H, High Dosage Astragalus mongholicus and Salvia miltiorrhiza Decoction; i, Inhibitor of FSP1; E, Erastin; B, Brequinar; GSH, Reduced Glutathione; CoQ10H2, Reduced Coenzyme Q10; MDA, Malondialdehyde; LVEF, Left Ventricular Ejection Fraction; NT-proBNP, N-terminal pro B-type Natriuretic Peptide; PE-A, Phycoerythrin Area; FITC-A, Fluorescein Isothiocyanate Area.
References
LinkOut - more resources
Full Text Sources
Research Materials
Miscellaneous